Monthly Archives: December 2016

Electricity use 2016

The immerSUN provides a useful app showing electricity use which includes an annual option.  The graph below shows the 2016 annual data:
Although some of the data was only collected from mid-March 2016, the graph still shows useful information. I think that the graph overstates bought / imported electricity in January to March but understates generated electricity proportionately in the same period.

The purple line shows monthly electricity consumption and is broadly consistent month-to-month.

The green line shows the generated electricity from the solar PV system.  Its seasonality is clearly visible.  Solar generation exceeds electricity use in four summer months, and is very close in a fifth.

The red line shows bought electricity.  It’s generally a mirror image of the green line reflecting more purchased electricity in winter and less in summer, but is not zero even in months where generated electricity exceeds used electricity due to time of day issues – cooking and car charging often occur at times when solar output is low such as cooking in the evening and charging at night.

The blue line shows surplus day-time electricity being used to heat water, and thus saving gas.

The turquoise line shows surplus day-time electricity being exported once the water has reached its set point.

It will be interesting to see how this changes in 2017 as a result of a full year of solar car charging in its current mature condition and with the new battery storage that should help get more of the generated electricity used by saving it for evening use.

Solar PV Generation 2016

The end of 2016 marks the end of the first full calendar year of solar PV operation in this house since the system was installed in late September 2015. In 2016 we’ve generated 4,129 kWh – 12.5% more than the 3,668 kWh annual output estimated for the system.

Income for 4,129 kWh generation with 50% deemed export is £641, with further savings made from the self-use of the electricity rather buying electricity or gas.   Detailed monitoring of these savings only started in March 2016, so there’s less than a full year of data, and my ability to use generated electricity improved through the year – particularly with my electric car charger control project.  From March to December 2016 we used 44% of the generated electricity replacing bought electricity, and a further 28% of the generated electricity replaced bought gas for hot water.  Back in September at the anniversary of the solar PV installation I estimated these energy savings as a combined £200 (link).

The chart above shows the minimum, mean and maximum daily generation for each calendar month since installation.

As one might expect, significant seasonal variation is evident month-to-month and well as day-to-day variation within any month. June 2016 looks a bit disappointing compared to May and July. The last few days of September 2015 immediately after the panels were installed were obviously quite good for September, but within the spread for September 2016. October looks quite similar for 2015 and 2016, while November 2016 is rather better than November 2015.  December again looks quite similar for both years.

Solar panel power outputs deteriorate with time.  My panels are supposed to have at least 90% of the original minimum power output after 10 years, and 80% after 25 years.  Generally mine seem to be performing well with annual generation significantly higher than estimated, and no evidence of performance deterioration in the late September to end of December period for which 2 years of data exists.

Battery capacity

As you may recall my storage battery has a usable storage capacity of 4 kWh which, with the quoted round trip efficiency of 80%, would mean it takes in 5 kWh of energy to make 4 kWh available for output later.

We’ve been away for a couple of days, leaving the house drawing a low amount of power in our absence, however yesterday the battery reports having discharged 5.9 kWh despite its 4kWh capacity.

I’ve already had some days when throughput was greater than capacity, but that’s generally been when the battery charged fully overnight and then partially recharged from solar PV during the day. However this was not the case yesterday where, although there’s a dip in demand associated with limited daytime generation on a dull winter’s day, there’s no evidence of battery charging.

There is a characteristic of battery behaviour that may describe some of this which is described by Perkert’s law. Peukert’s law describes a relationship where battery capacity reduces as current increases according to a power relationship. Since my battery is discharging at about 350 VA that much less than its 1200 VA maximum capability so it may appear to have more capacity.

However it seems to have both greater input and output energy than its rated usable capacity suggests (input energy remains higher than output energy) so it would seem that there’s something else going on here; whether that’s an early life effect, a genuinely larger capacity than nominal, or some other effect is unknown.

The battery has a nominal capacity of 8.8 kWh to provide is usable capacity of 4 kWh, so it’s possible that some characteristic of the control software is making more of the nominal capacity available than would normally be the case.


Best use of generated power (cont.)

In order to illustrate how the combination of battery and immerSUN distributes generated electric power at different levels of generation I created this chart.

For different levels of power generation across the bottom, the chart shows how the power is divided between battery charging (and occasionally discharging), electric car charging, and water heating; which are generally prioritised in that order. My prior post explained the rationale for the 500 Watt switching threshold for the vehicle charger – based on 1.4 kW of mid-value car charging being better value than a mix of 800 Watts of high value battery charging and 600 Watts of low value water heating.

Alternatively you might like to consider that the horizontal axis represents passing time after daylight comes and that the chart shows how diversion changes as the sun reaches its zenith.  You might then view the end of the day as a mirror image of this as the output of the panels ramps down in late afternoon, although at the end of the day there’s the greatest possibility that one or more of the storage devices is/are full and thus the greatest chance of electricity being exported.

Of course all of this assumes that the storage devices aren’t already full, and indeed that the electric car is present at all. As storage devices fill, or indeed if the car is absent, the system automatically switches to the next best value alternative:

  • Battery full – more car charging and/or water heating.
  • Car full or absent – more battery charging and/or water heating depending on power output.
  • Hot water at maximum temperature – this is the lowest priority electricity use so when this is full we don’t currently have another use to divert power to. However there is an unused output on the immerSUN so it would be possible to drive another load. The underfloor heating in the kitchen would be a possibility, although there’s unlikely to be much overlap between days when there’s enough surplus to reach this point and days when kitchen heating is required so it may never repay the cost of fitting the cables.

Best use of generated power

Over the last few days I’ve been rethinking the best use of generated power.
The prioritisation of battery charging over water heating is clear due to the significant cost difference between day time electricity and any time gas, but the situation on car charging is more complex. It occurred to me that there could be times when prioritising battery charging and water might not always be the lowest cost solution since car charging avoiding mid-price nighttime electricity might be a bigger saving than a lesser amount of high value battery charging combined with low value gas-replacement.

For example, if we look at the lowest level of EV charging that amounts to about 1.4 kW. With our night-time rate of 7.87 p/kWh, 1.4kWh of solar power used for car charging saves 11.0 p of night time electricity.  If the battery is maxed out at 800 VAh that saves 7.34 p of later day time electricity. The water heating using the balance of 0.6 kW saves a further 1.76 pence of any time gas. Thus the total save from 1.4 kWh used for a combination of battery charging plus water heating is 9.1 p, compared to 11.0 p from car charging – so it would appear to be better value to do 100% car charging when a 1.4 kW surplus exists.

A bit of further analysis aimed to establish the point at which it became better value to charge the car, rather than combine battery charging and water heating, even if that involved a small level of mains import. The answer is that, with my energy costs, it makes sense to enable 1.4 kW of charger when 1.3 kW of export would have existed thereby potentially importing 0.1 kW. In practice this 0.1 kW may be supplied by the battery.

Given that the battery has priority by the way it’s wired, and takes up to 800 VA, then I intend to try a 500 W export threshold to start the car charger since 800 VA + 500W ~ 1.3 kW.

A sunny December day

Today as expected was well above average for December with 8.2 kWh generated so it was a good opportunity to confirm correct prioritisation of battery charging and water heating.

The graph above from the immerSUN clearly shows the green area of electricity being generated from the solar panels, the purple line of the ‘house’ electrical load (including battery charging) rising first (i.e. the priority load) within the green area, and then the blue line representing the water heating rising second. The purple line being at about 1kW is consistent with 200 Watts of house load with the 800 VAp battery charger on top.

Water heating starts to reduce first with battery charging around 14:00. Shortly after 14:00 the house switches to running from an increasing amount of stored energy which lasts until shortly before 20:00.

From the battery’s perspective you can see ‘device power in’ i.e. battery charging rising first, followed by ‘grid power out’ which is actually power available to the immerSUN and should correspond with the immerSUN’s blue line. As the sun goes down power diversion for water heating is reduced first, following by power for battery charging; until finally from about 14:30 the battery switches from charging to depletion ‘device power out’ running the house until shortly before 20:00 by which time it’s supplied around 3kWh.

System data from battery and immerSUN perspective

Today (briefly!) I watched the battery storage and immerSUN operating alongside each other. As you may recall things are arranged such that the battery should charge first (at up to 800 VA) and then once the battery is drawing full power (in the absence of a car) the immerSUN makes hot water.

From the immerSUN’s perspective as PV output rises the load of the house (which is actually the battery charging) also rises. Once the battery is charging at its maximum 800 VA power then any remaking PV is diverted to making hot water by the immerSUN. Later as PV output drops the battery continues to match the zero PV output discharging the battery to make the house load zero according to the immerSUN until the battery is exhausted – 2 hours of house load in this illustration.

From the battery’s perspective between 10 and 12 it can be seeing hitting its maximum 800 VA, while a varying amount of excess power is seen to be exported. In reality this isn’t true export, its power available to the second priority device (the immerSUN) and corresponds to the immerSUN’s blue line for diversion.

Overall self-use was 96% although admittedly on a low base. Thursday should be interesting as that’s sunny all day on the forecast.

Our hot water cylinder

A year ago when we replaced our gas boiler we also replaced the hot water cylinder. There were various reasons for that:

  1. I wanted to use an immersion heater to maximise use of generated PV electricity
  2. The old cylinder didn’t have an immersion heater and we were advised against trying to open the portal on a 40 year old cylinder.
  3. Ideally a cylinder for such heating would have a low down entry portal for the immersion heater so that the whole cylinder volume is heated – whereas our portal was in the top.
  4. Our old cylinder was uninsulated, although it did have an insulating jacket.
  5. Given that we’re potentially heating day’s hot water up-front with solar PV rather than on demand by gas then we might reasonably want a larger stored volume.

We ended up with the 210 litre Gledhill tank illustrated for which we had to sacrifice an airing cupboard shelf as it’s that much taller than the old cylinder. Both immersion heater and thermostat for the gas are at similar height towards the bottom. The smaller cylinder at the side is to manage expansion of the water in the absence of an expansion tank in the loft.

Prioritising the battery

In combining both battery storage and water heating from surplus PV output I was keen to ensure that the two solutions worked together well. I consider that there are potentially two issues with such an arrangement:

  1. Firstly, the system may go unstable. With two independent systems each trying to absorb the same PV output, they may overreact both claiming the excess and putting the house into import, then both back-out in response to the input restoring the system to export, and then repeat the cycle endlessly etc. In control system terms you might consider that it had too much gain.
  2. Secondly, even if stable, the resulting split of diversion into two systems (battery and immersion heater) may not be optimal. In my case a kWh of stored electricity is worth more than four times a kWh of gas saved – so I’d clearly want to prioritise battery charging.

I considered various relatively complex solutions and then thought of one of great simplicity which required no additional parts.

My solution is simply to install the current clamp for the high priority device around both the incoming power cable and the cable to the lower priority device. The nature of a current clamp is that the current it reports is the sum of all the cables that it encircles. Thus, by placing the battery clamp around both the incoming supply and immersion heater feed, it doesn’t matter how much of the potential export has been diverted to the immerSUN, the battery clamp still sees what would have been exported were the immerSUN not active and gradually takes that power. The immerSUN in turn sees the reducing export / increasing import on the meter tail and backs off to restore the balance.

My installer had previously combined immerSUN and battery without such an arrangement and advised that the slow response of the battery compared to the immerSUN remained stable, but as the immerSUN responded most quickly it was prioritised.

However the above graph from the immerSUN shows my battery successfully tracking the PV output, so my arrangement is working successfully.

The only downside, which for me isn’t an issue, is that the immersion heater becomes invisible to the battery. Even if the immersion heater is operated via an immerSUN boost when no PV output is available, the incoming mains current is entirely matched by current in the immersion heater feeder in the opposite direction, and the battery’s current clamp sees nothing. Thus the battery cannot support the immersion heater because it doesn’t know that the immersion heater is drawing any current. I however don’t see this an issue since we use gas to heat the water when the ImmerSUN’s diversion is insufficient. Even if we did use electricity the battery is not able to deliver sufficient power to run the immersion heater at 3kW.

In my installation the battery current clamp is actually inside the consumer unit to minimise the additional wiring to allow the clamp to encircle both the incoming mains and the immersion heater feed.

Why I did buy a battery (almost)

Well, after consideration going back months, I did finally buy a battery (almost). Conceptually I’ve long thought that a time would come when I’d have a storage battery to store excess solar electricity from when I couldn’t use it all, and then use it at a later time; but until now I’ve been put off by various technical constraints and the cost. However a few weeks ago I saw an appeal for homeowners to participate in a battery trial sponsored by a DNO (the companies who own local substations and the cables down the street). After initially being told that the scheme was full, I was subsequently offered a place – presumably because others have dropped out. In exchange for giving the DNO 18 months of usage data (for which a data logger is installed in the house) I get a discounted storage system to keep.

img_0637
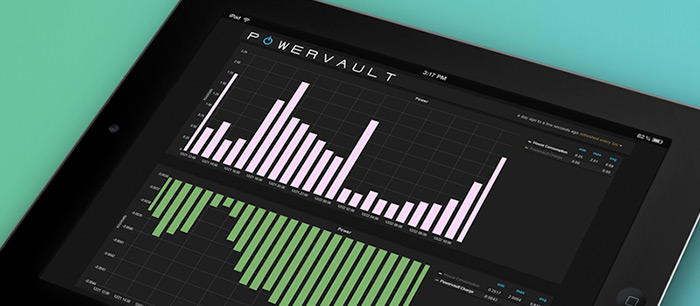
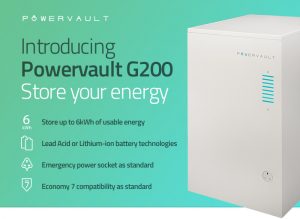
The battery that I’m being offered is a PowerVault with 4kWh usable capacity. It’s connected on the AC side of my inverter, and can be charged either by the surplus on my solar PV or, when there’s insufficient PV output, on cheap night-time power for later daytime use. It also has a UPS function that could usefully maintain power to my PC, internet, phone etc during a power cut. On the downside it has a relatively low output power so it can’t fully power larger consumers like the oven, car charger etc; although it can sustain lighting, TV, the fridge and a host of smaller loads that make up modern electricity consumption.

This means I now have multiple means to save surplus free power when it’s available and avoid buying power at the time of need which are, in order of financial attractiveness:

  1. Charge the storage battery avoiding later day time electricity purchase.
  2. Charge my electric car avoiding later night time electricity purchase.
  3. Make hot water avoiding later gas purchase.

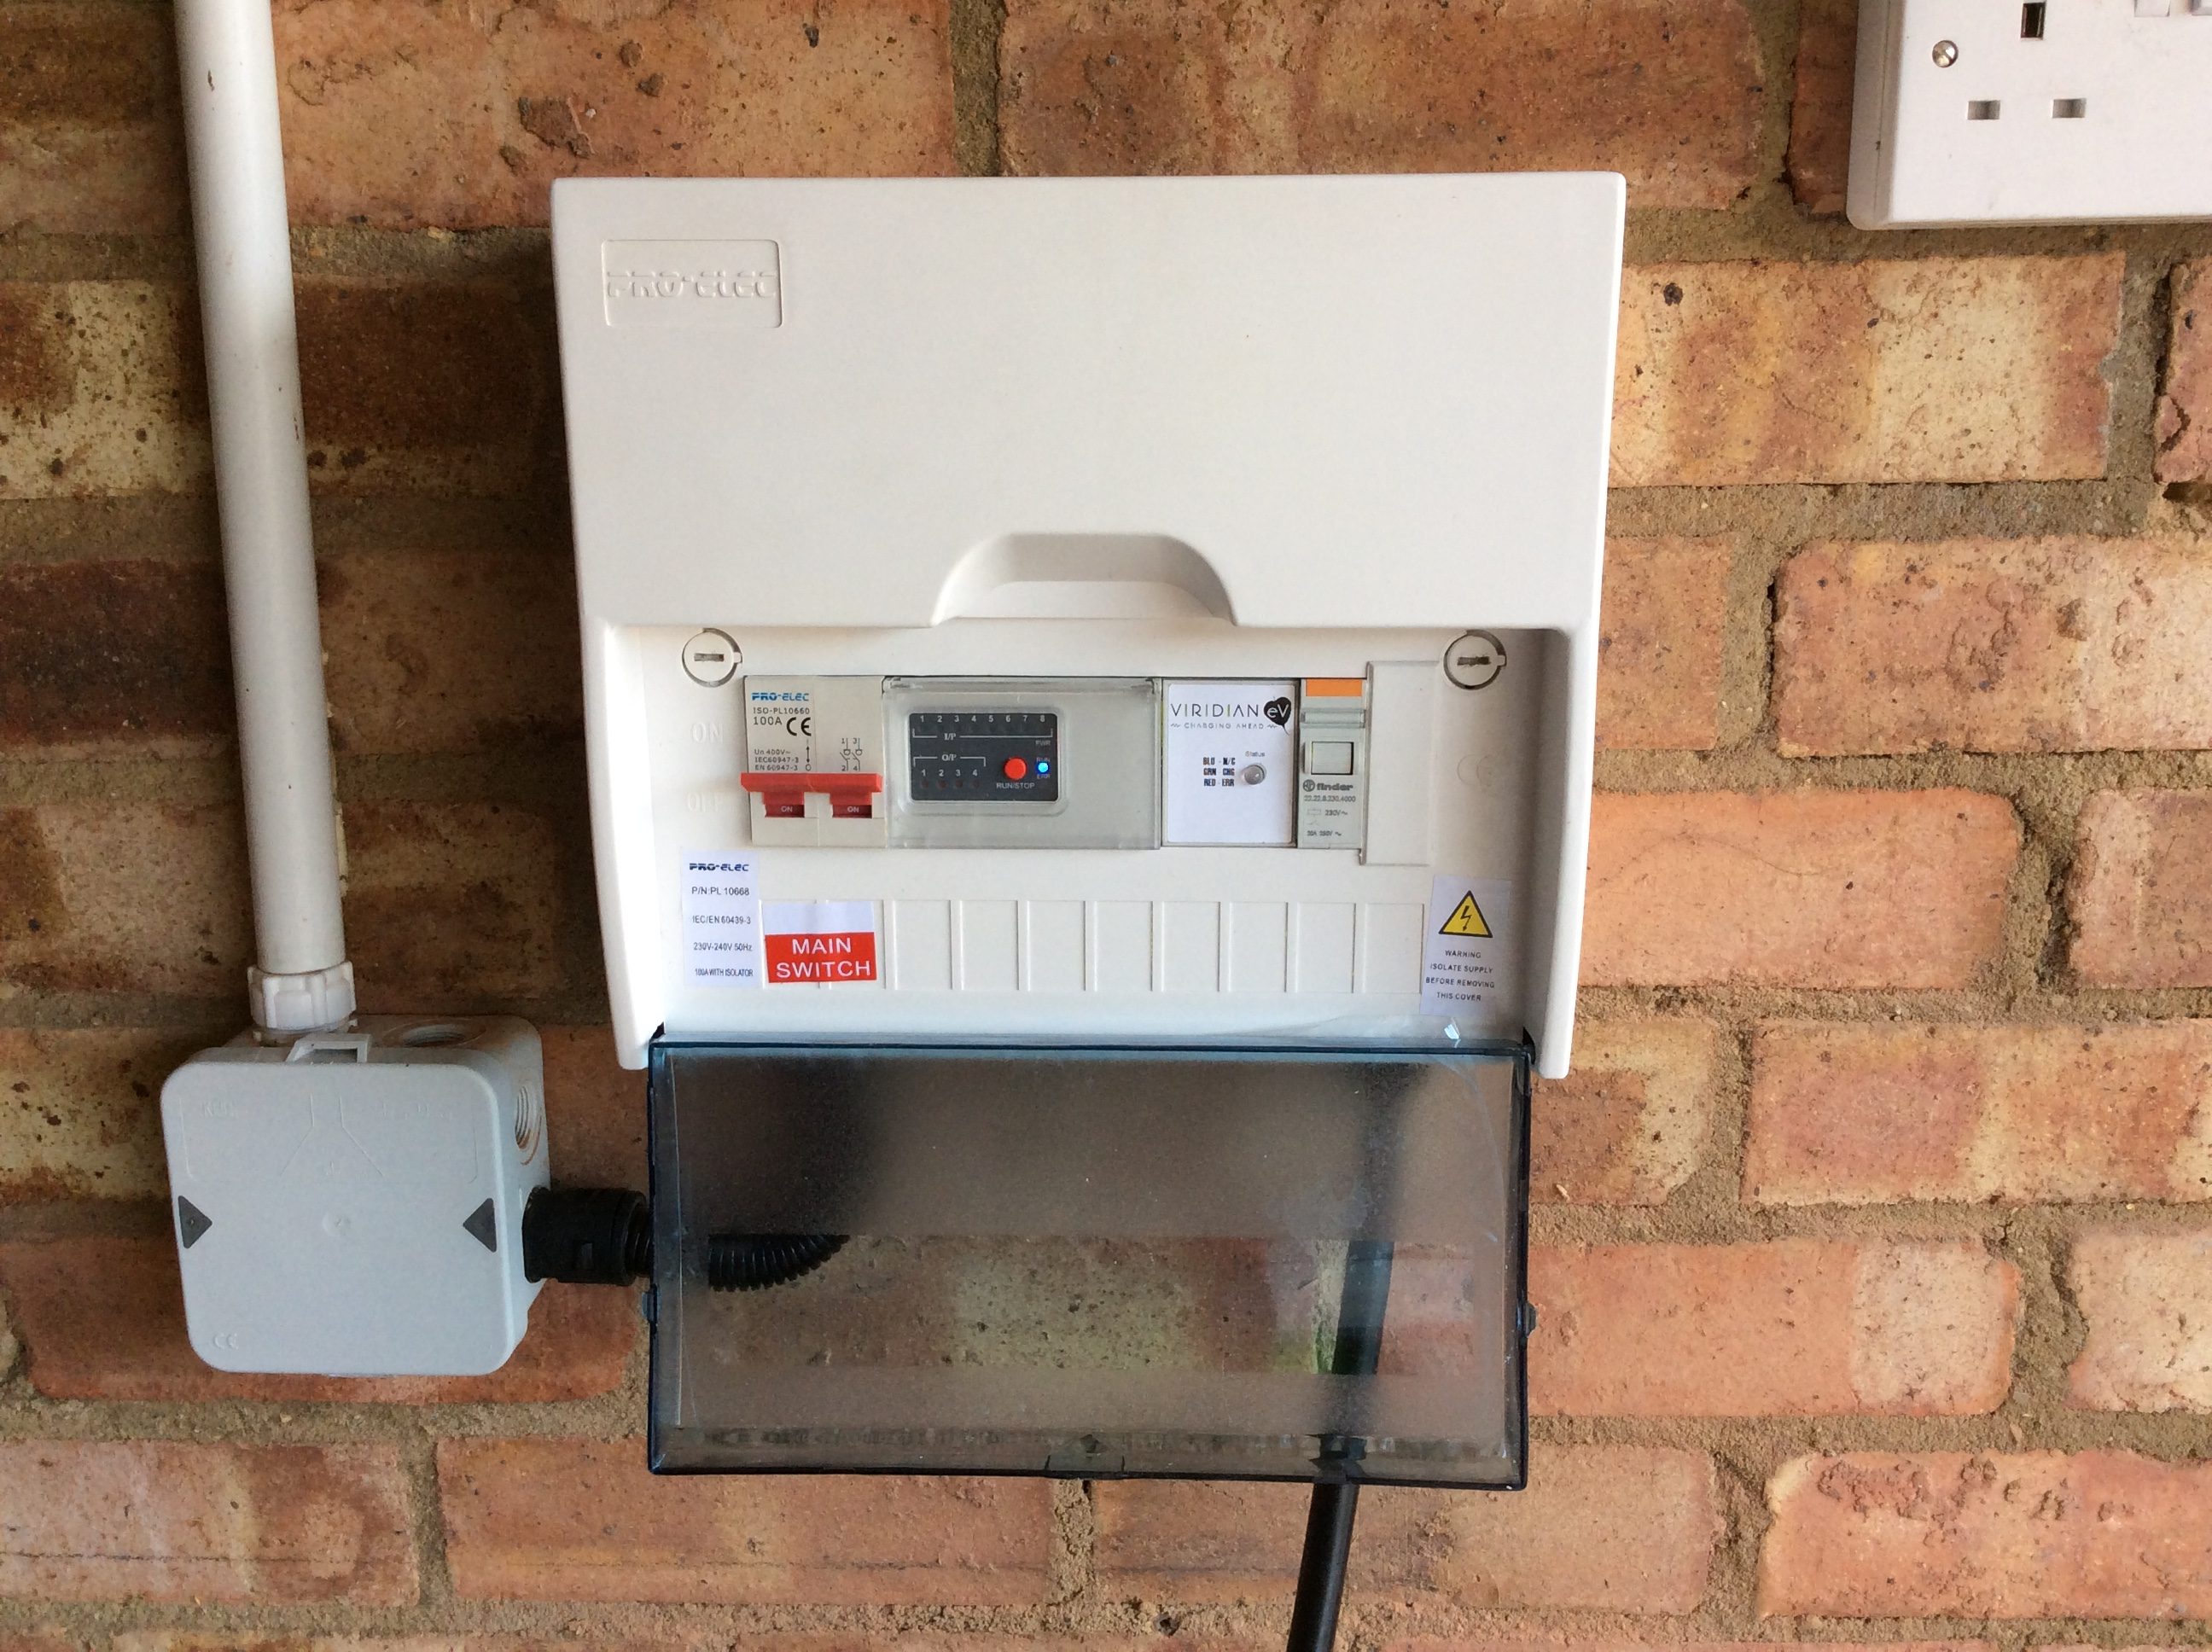
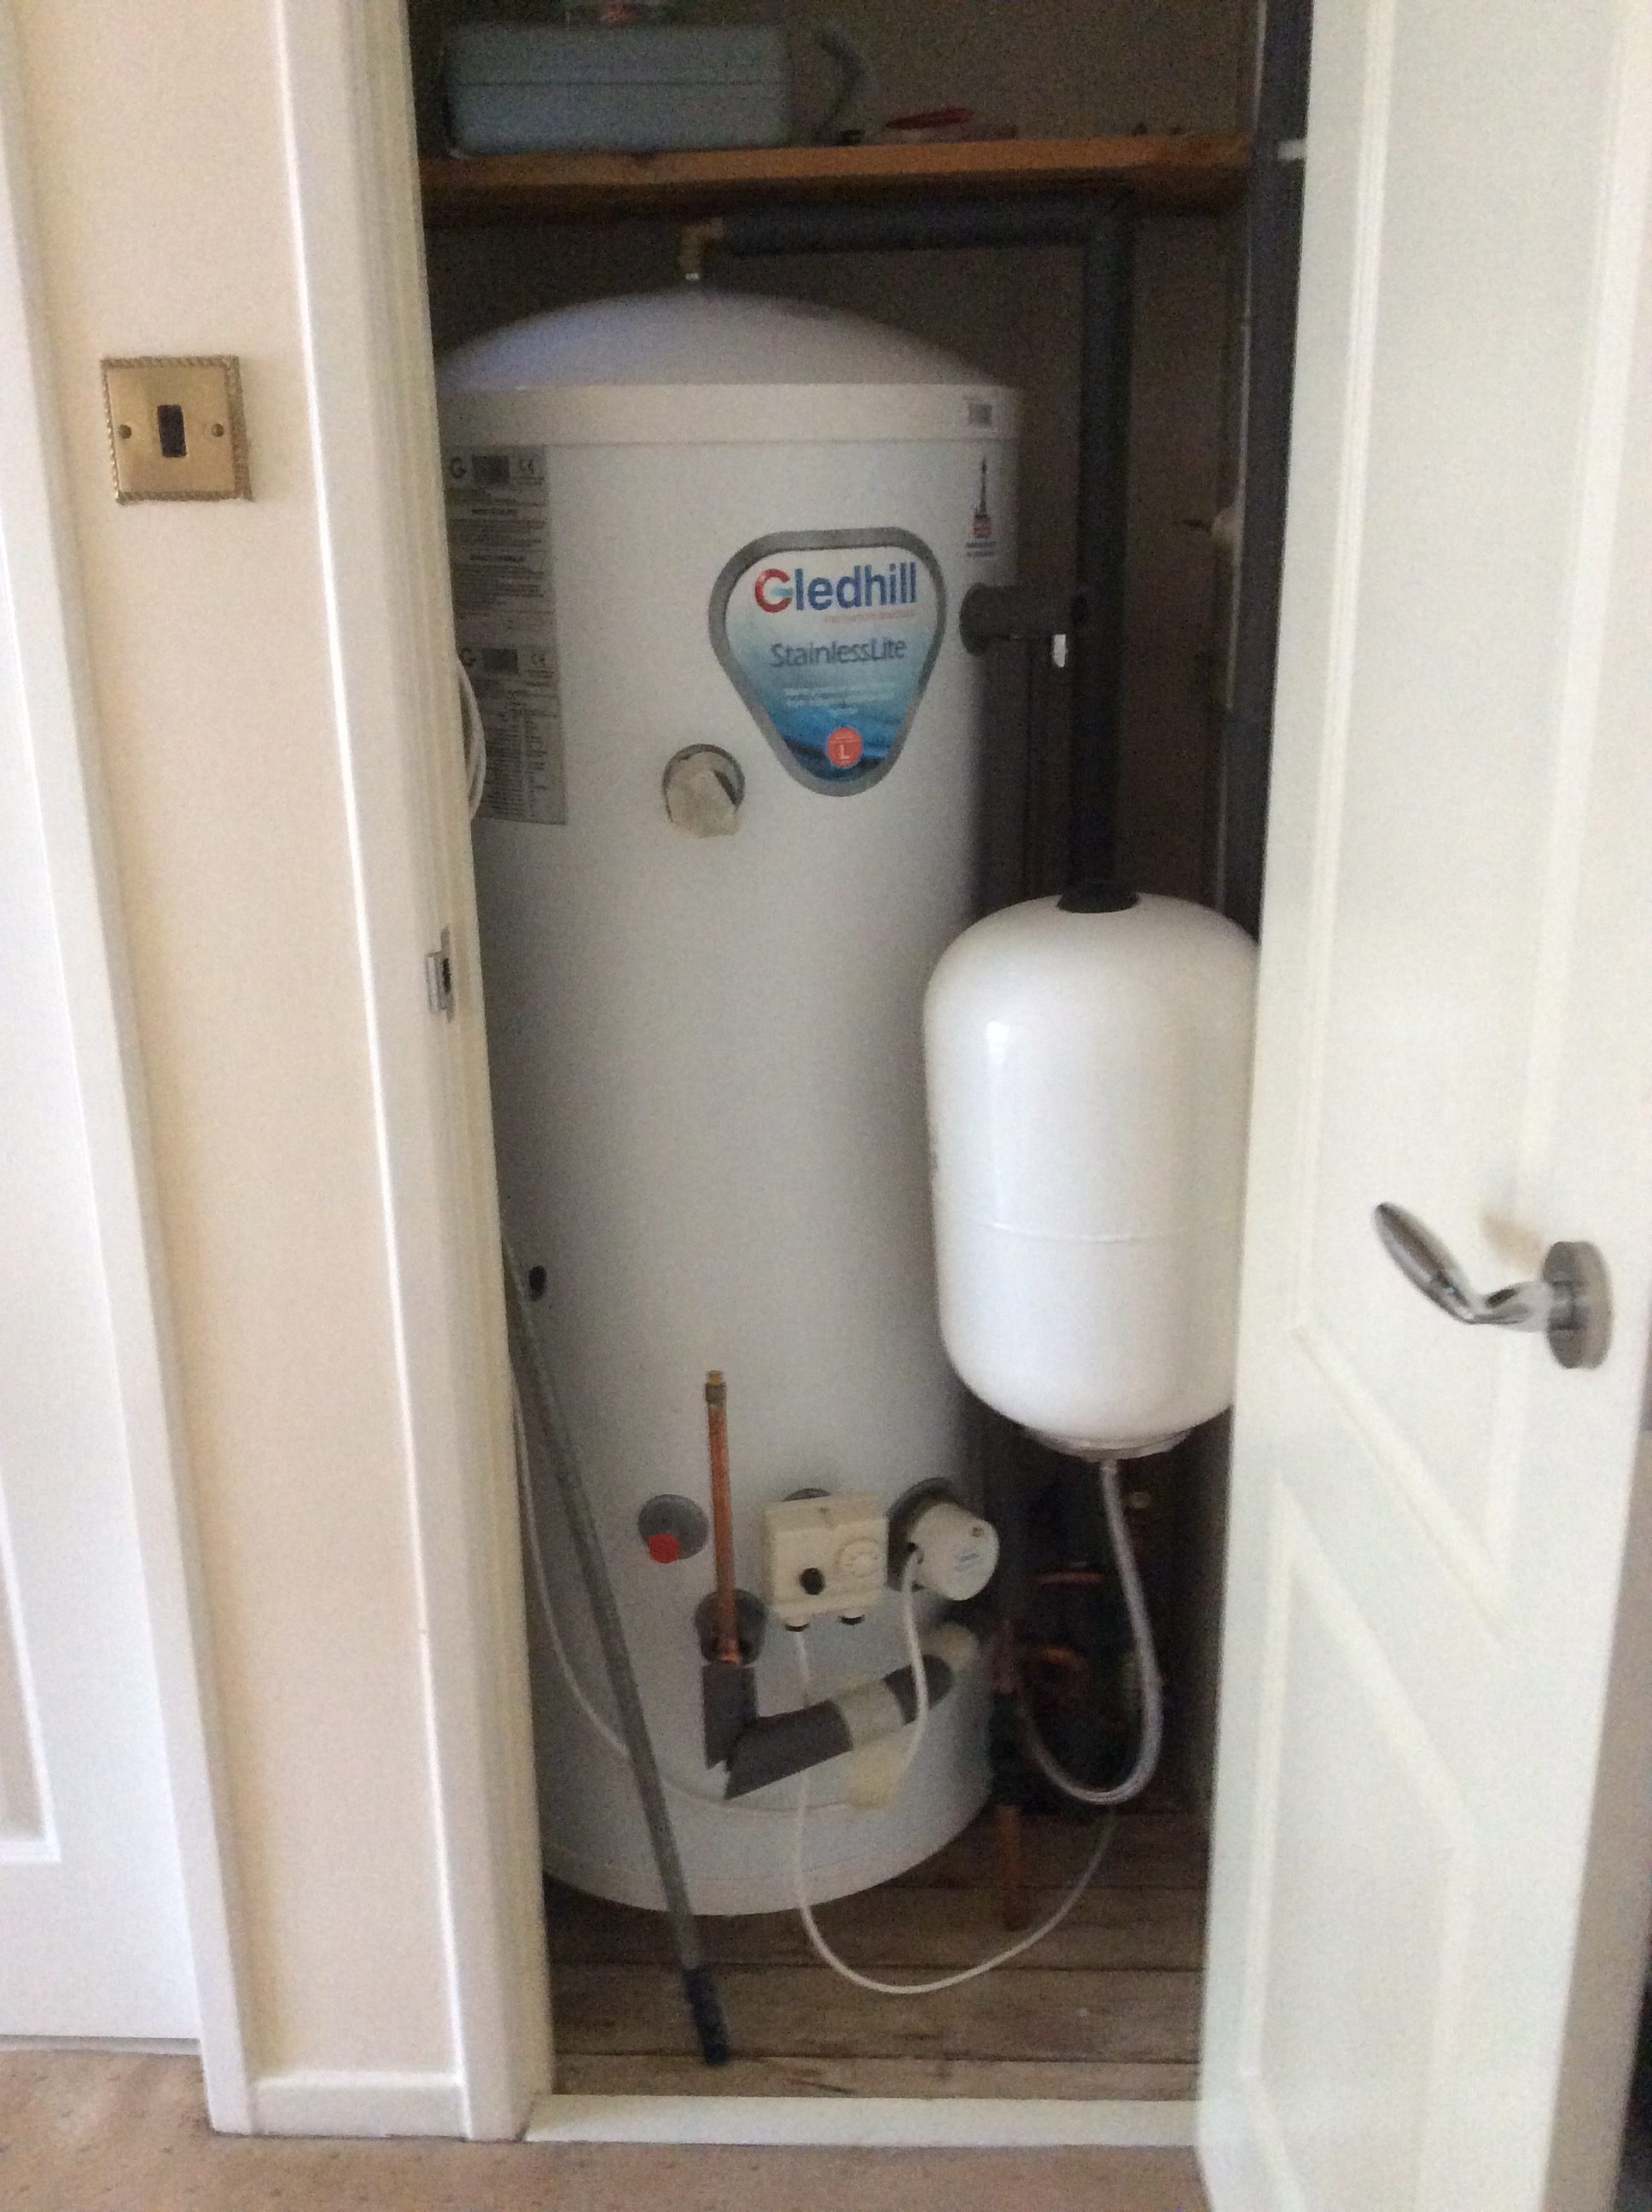
The system itself is about the size of a slimline dishwasher and is designed to sit under a worktop. I however now have my battery installed in the study, under my desk, a location chosen because of its proximity to the consumer unit and because any waste heat from the battery will (along with my PC) help to heat an otherwise unheated room. It could alternatively have gone in the adjacent utility room, but I’d have needed to sacrifice a cupboard and the utility room has no need of any more heat as it’s home to the boiler already.

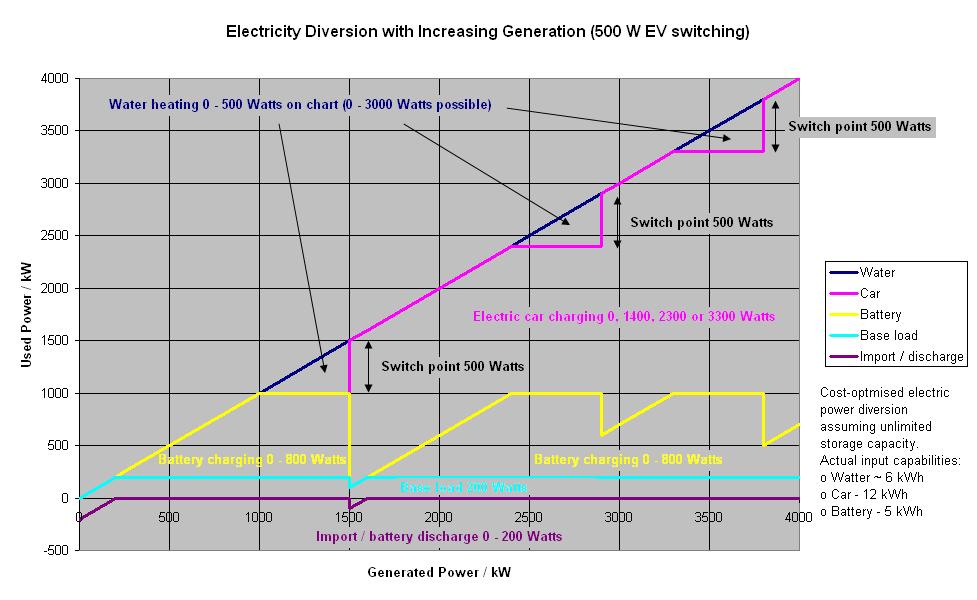
One of my concerns was whether the storage battery control system and immerSUN might interact as both sought to divert the same power to their respective storage devices, but I think I’ve worked out how to ensure the storage battery always has priority while allowing the immerSUN to work simultaneously. One could imagine that, for example, at the height of a summer day the maximum 800VA would be going into the battery while the immerSUN managed nearly 3kW into car and/or hot water.

img_0638
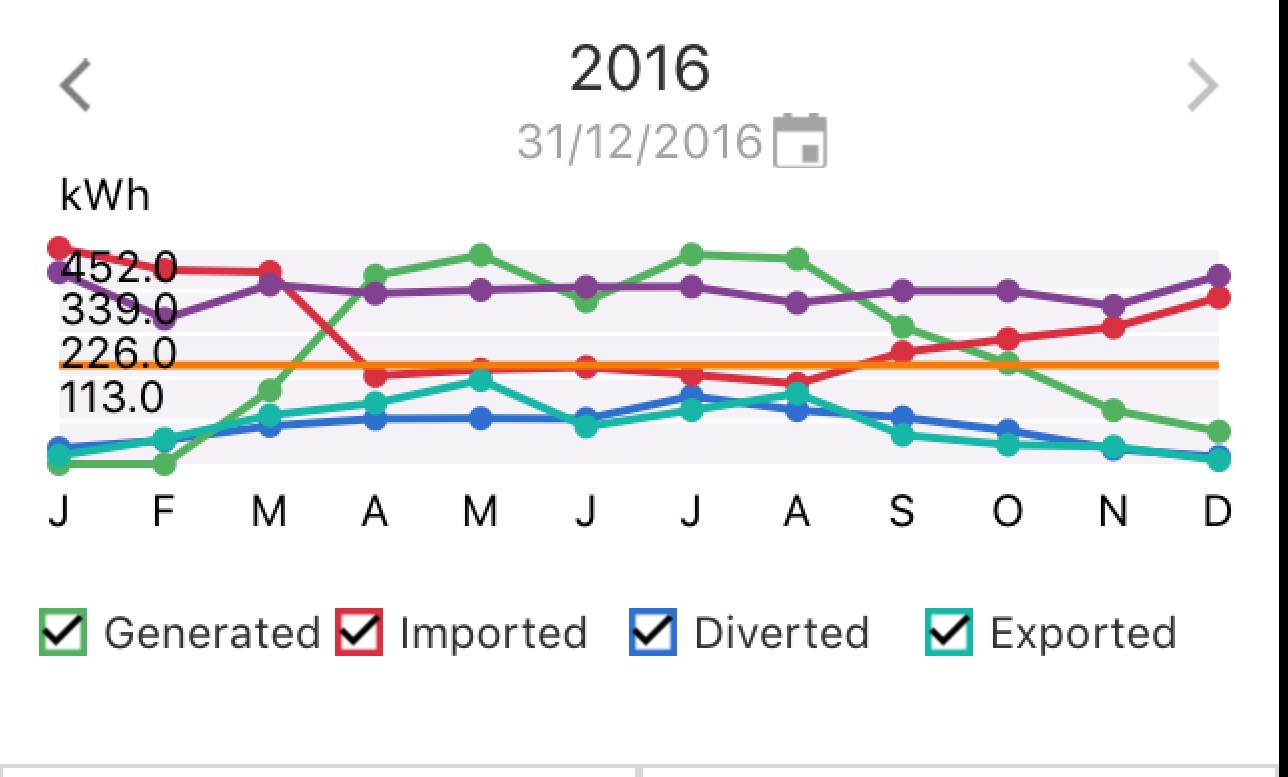
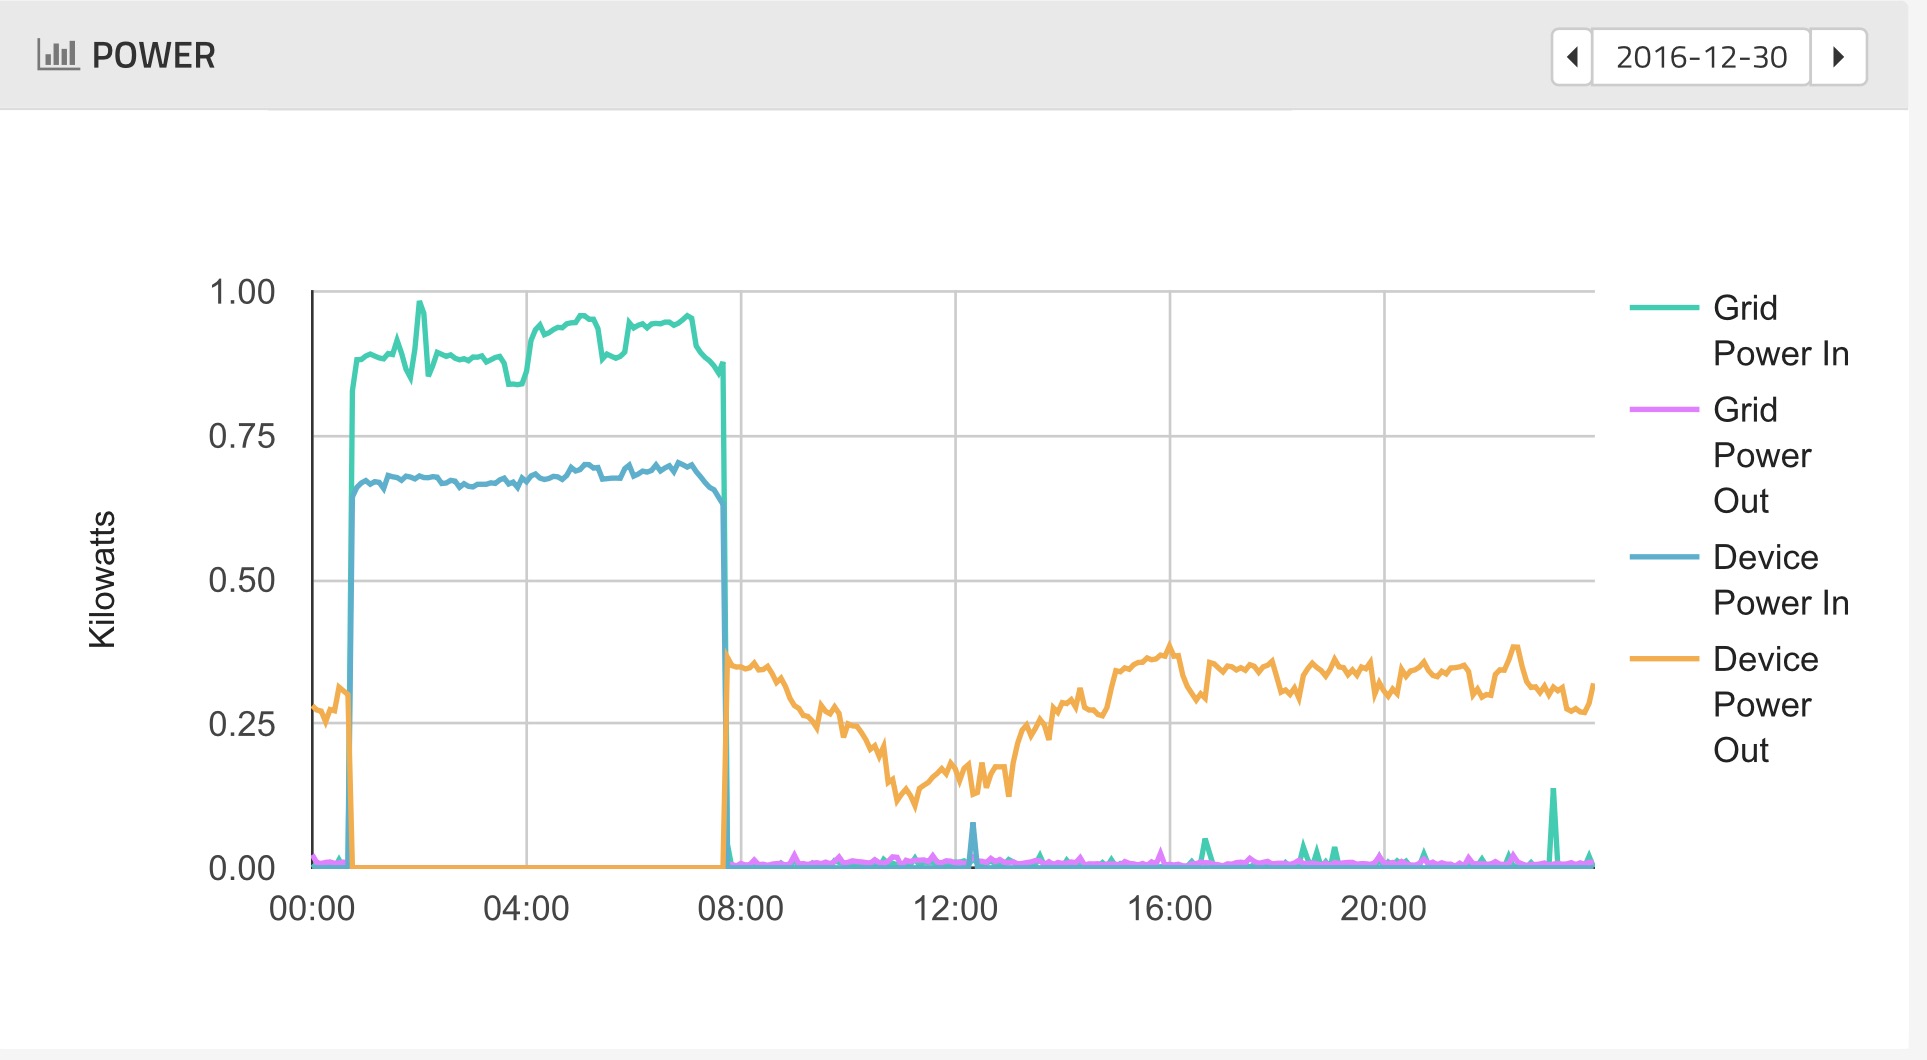
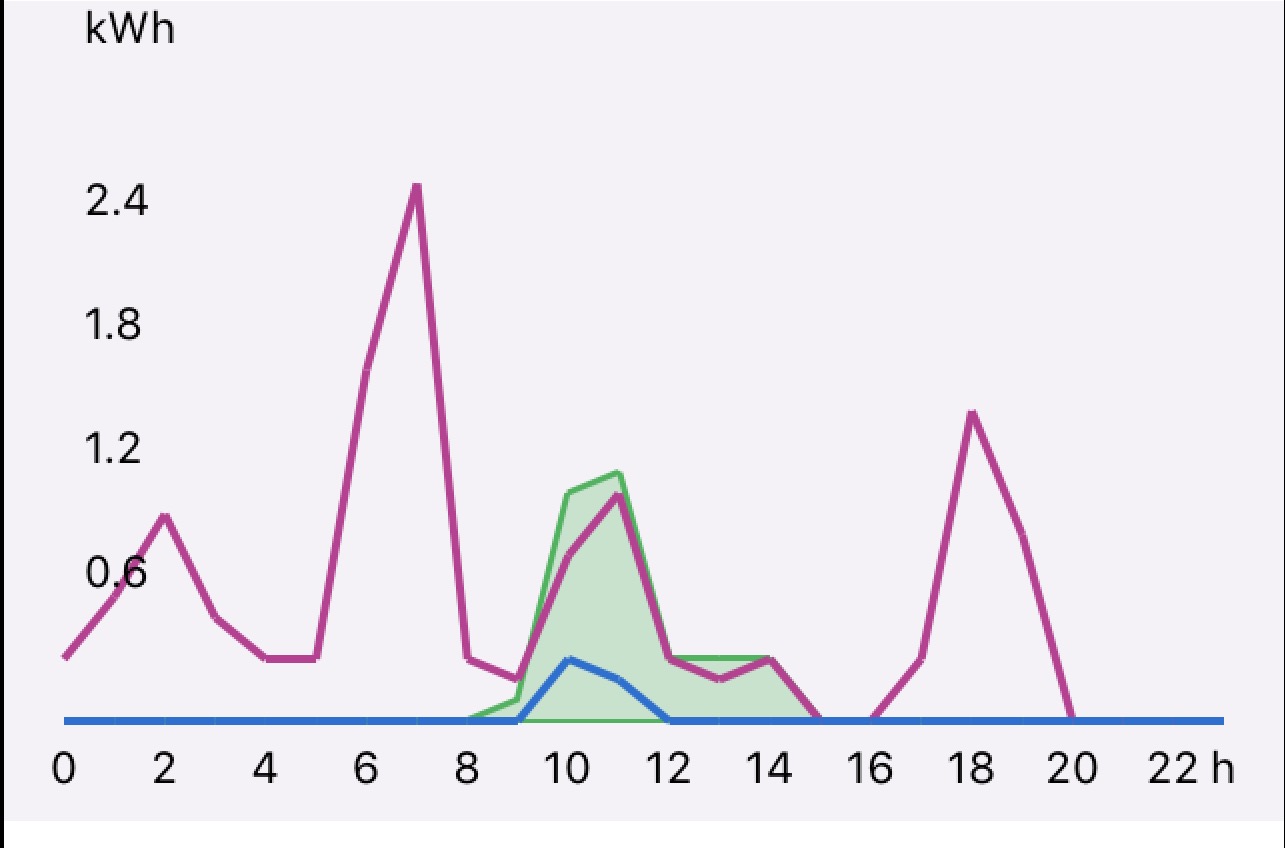
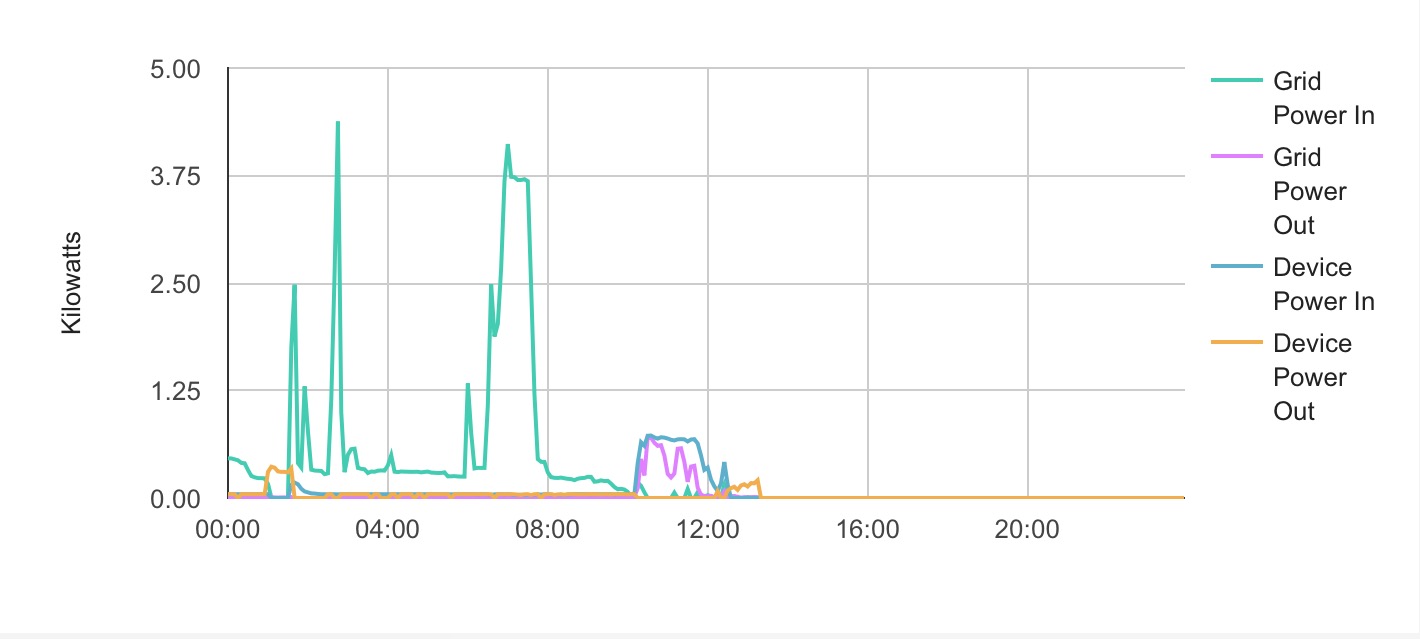
When it comes to viewing system activity then there’s opportunity for me to see what’s happening or has happened on any day through the cloud servers for both the storage battery and the immerSUN. I’ve not got to grips with the storage batteries’ data logging yet. However, from the immerSUN’s perspective, battery charging looks like additional household load up to 800 VA (but not to the point of exceeding PV output), while battery discharging looks like reducing the household load by up to 1200 VA (but not beyond zero).

And why did I buy a battery (almost)? Well, ignoring the fact that I have a battery but no invoice so far, I won’t have to pay the full installed price because of the subsidy provided by the trial so I’ve arguably only bought some of the battery.