For some time now my Home Energy Management System (HEMS) has been managing many of my domestic electricity consumers including:
- car charging
- dishwasher
- home storage battery
- washing machine
- water heating via immersion heater

The overarching strategy has been to:
- maximise use of my own solar energy (rather than consume from the grid)
- prioritise consumers for best value within the constraint of available solar generation
- when power is needed from the grid to optimise the purchase price by shifting consumption to the cheapest periods (my price changes every half an hour)
For some consumers such as car charging and water heating this has resulted in those consumers switching between two modes:
- self-consumption when they are enabled to use the ‘free’ electricity from my own solar panels (subject to device prioritisation) with some proportional control
- boost when they run at full power drawing some if not all of the required power from the grid at the lowest available price
However the quite exceptional stress being put on the grid in the UK has prompted some expansion of capability. It’s normal once in a while that my electricity prices go negative, commonly caused by the overlap of large amounts of renewable electricity on the grid (e.g. excess solar output on sunny afternoons and/or high windfarm output due to wind conditions) and low demand (summer nights without heating demand, summer afternoons, bank holidays etc) which is exacerbated by the current corona situation. The current corona situation has made this more common and the plunge pricing events more extreme with multiple hours of negative pricing today some of which are into double digits (which I think is unprecedented). For car charging and water heating this has resulted in a new control mode.
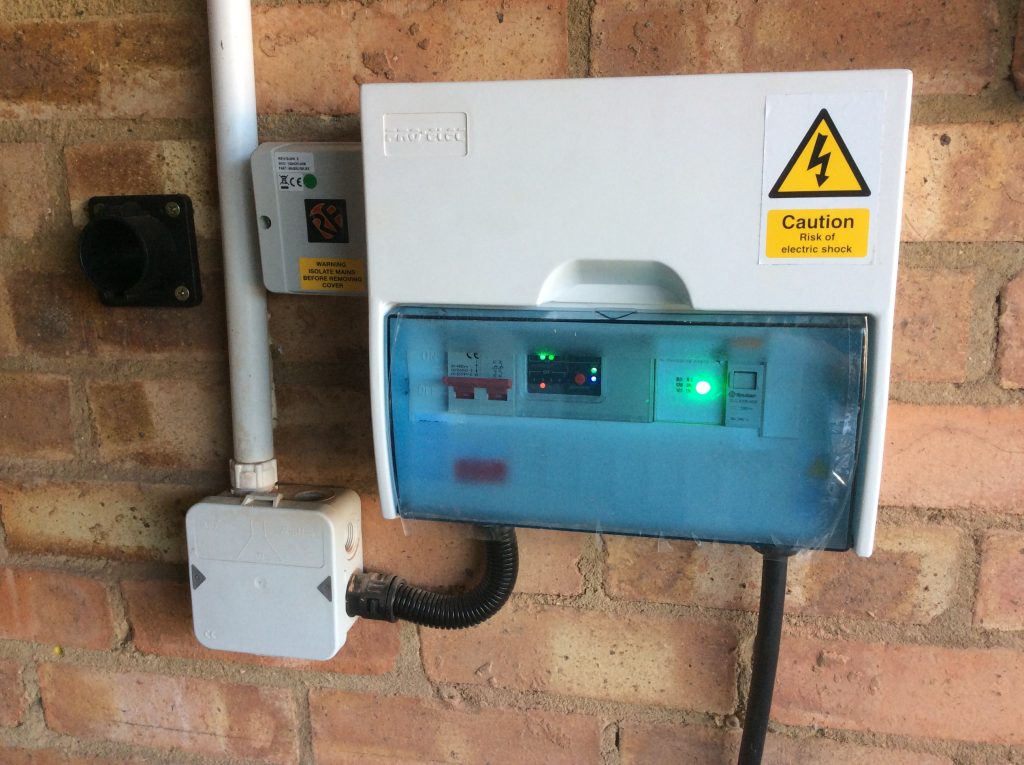
Stepped Mode 3 EVSE in consumer unit case 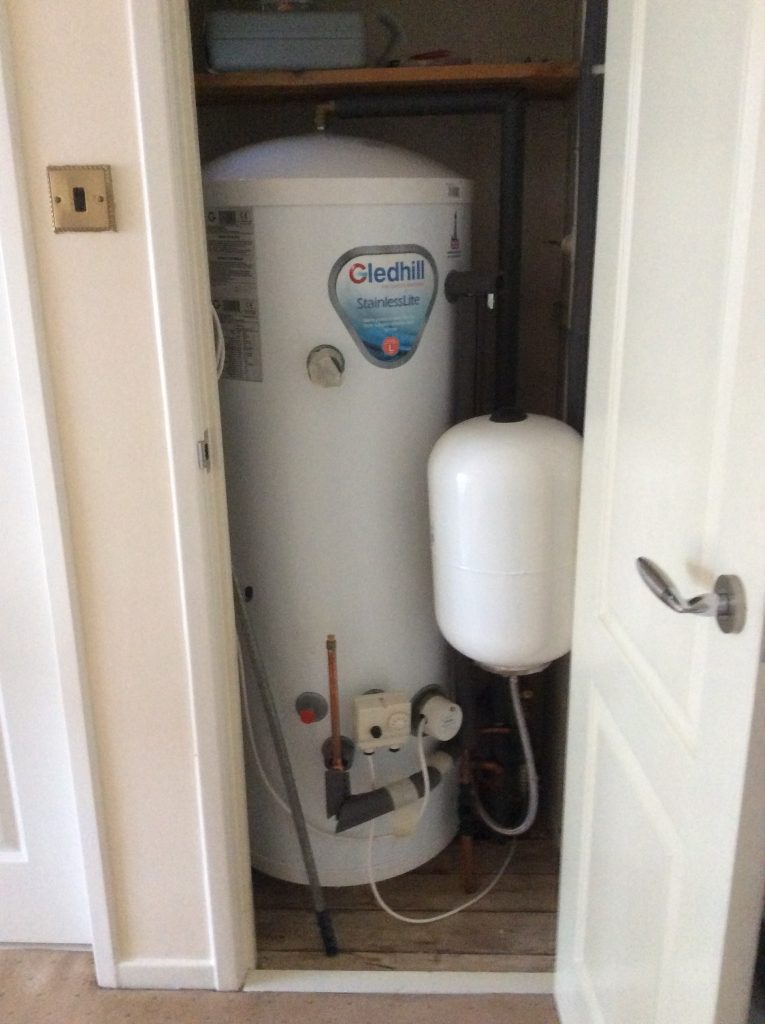
Hot water cylinder with immersion heater
The new control mode is a disabled status where the the device neither self-consumes nor is forced on. In the short term this increases export to the grid, but the mode is intended to help balance the grid disabling consumption for now to enable more consumption when the grid is under most extreme stress from an excess of generation over demand. Or to think of it another way, it passes up the opportunity to use free electricity now in order to be paid to use electricity later, responding to the price incentive to support balancing the grid.
Thus on a normal day these devices switch half-hourly between self-consumption (free electricity) and Boost (paid for electricity), but on a price plunge day then they switch half hourly between the new disabled state (no electricity, increased export) and the existing Boost (but now paid-to-consume electricity).
The full availability of modes is thus:
| mode / other | abbreviation | battery storage | car charger | water heating |
|---|---|---|---|---|
| Make and model | Powervault G200 | N/A | Immersun v2 | |
| Control means | API | Relay | Mixed API and relay | |
| Mode – Boost | ++ | Powervault “Force charge” | via HEMS relay (Ch 1) | Via HEMs relay (Ch 2) to Immersun “External Boost” input. |
| Mode – Self-consumption only | + | Priority #1 Powervault “Charge only” | Priority #2 via Immersun relay output (Ch 3) | Priority #3 Immersun default behaviour |
| Mode -Disabled | 0 | N/A – Available in API but not used by HEMS. | via HEMS relay (Ch 4) | Immersun “Holiday” mode via API |
| Mode – Both self-consumption and self-discharge available | +/- | Powervault “Normal” via API | N/A – No reverse flow from car to home available (not V2X capable) | N/A |
We should thus be better equipped to support the grid in the current circumstances.
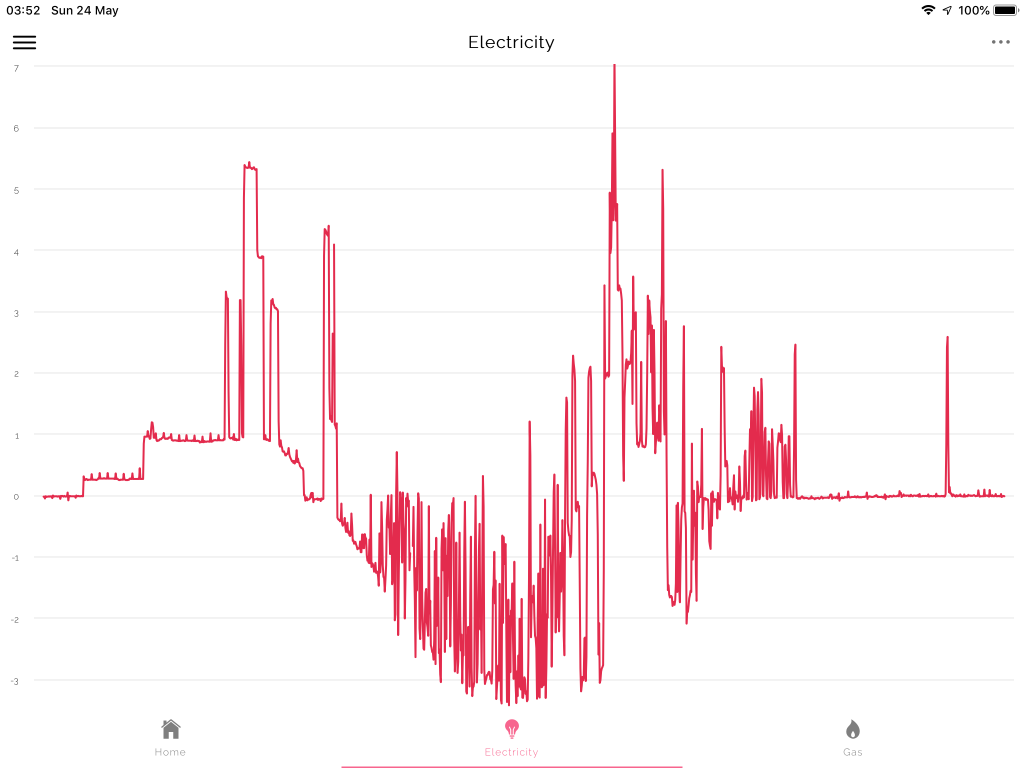
The chart above shows the resulting behaviour. In particular the large negative currents through the morning to early afternoon show that much of the normal self-consumption has been disabled. Then from mid-afternoon the import shows the effect of enabling multiple consumers simultaneously. Here the behaviour of the car charging and water heating was boosted as this point, while the dishwasher’s and washing machine’s existing behaviour added to load.
Not that it has anything to do with the revised controls, but the spikiness of the export during the day shows the highly variable nature of the export through the day being a function of both variable generation through passing clouds and variable consumption with kettle boils and the like. Thus it’s important that consumers for self-consumption have automated closed loop control since manual control of an immersion heater or car charger to achieve high self-consumption with minimal import would have been almost impossible even with a level of human intervention wholly at odds with the scale of savings achieved – small savings hour-by-hour add up over the day, weeks and months but their value is relatively tiny compared to the labour to attempt equivalent control manually.
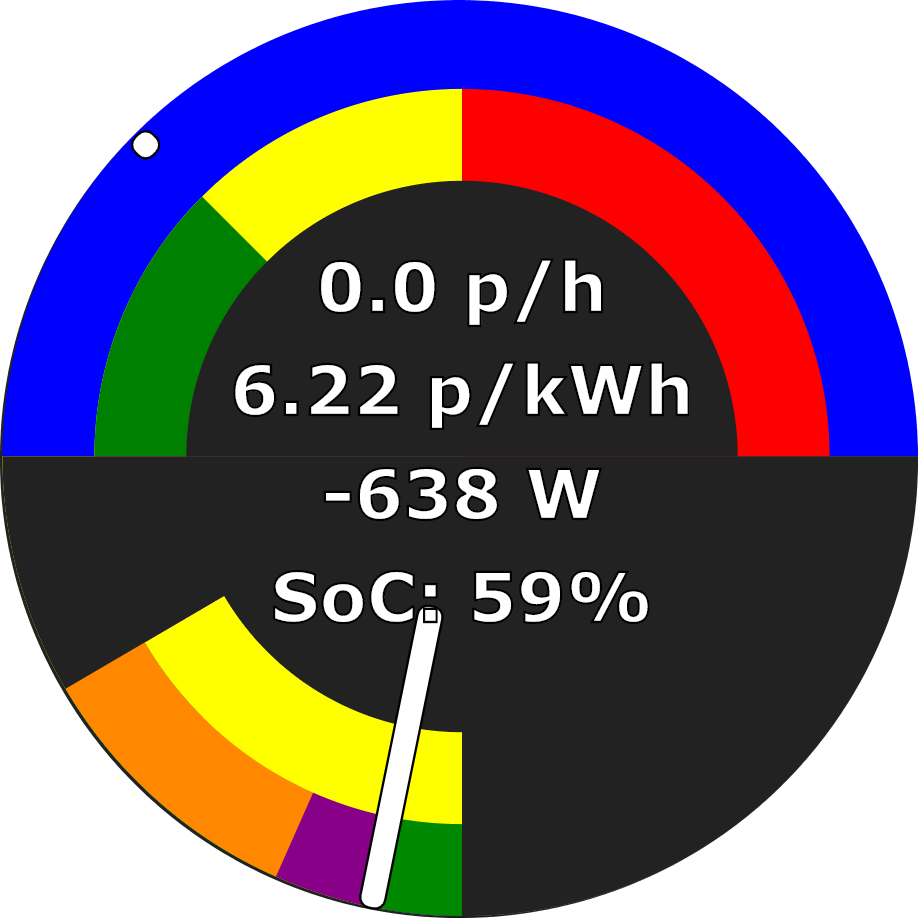
Here is a similar import-only half-hourly view from the smart meter WAN side:
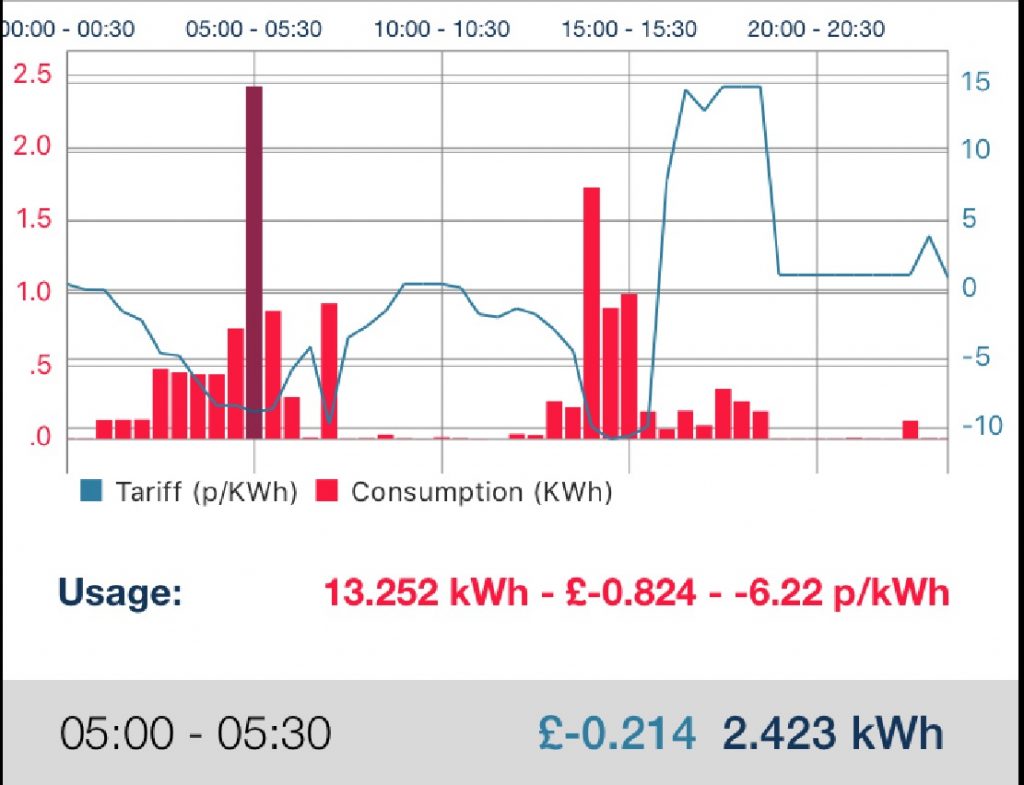
The screenshot above clearly shows those periods of import being targeted at the periods with the most negative prices. Since different consumers need power for different periods of time (for example it takes about 7 hours to charge the battery, but only 2 or 3 for a tank of hot water) then consumption rises as cost falls. My consumption-weighted average cost was -6.22 p/kWh yesterday. However the same price point during the day or night has delivered different consumption from the grid as the output of the solar panels must be consumed before consumption from the grid starts. We are still some way from the point where it becomes economically attractive to disable the solar panels.
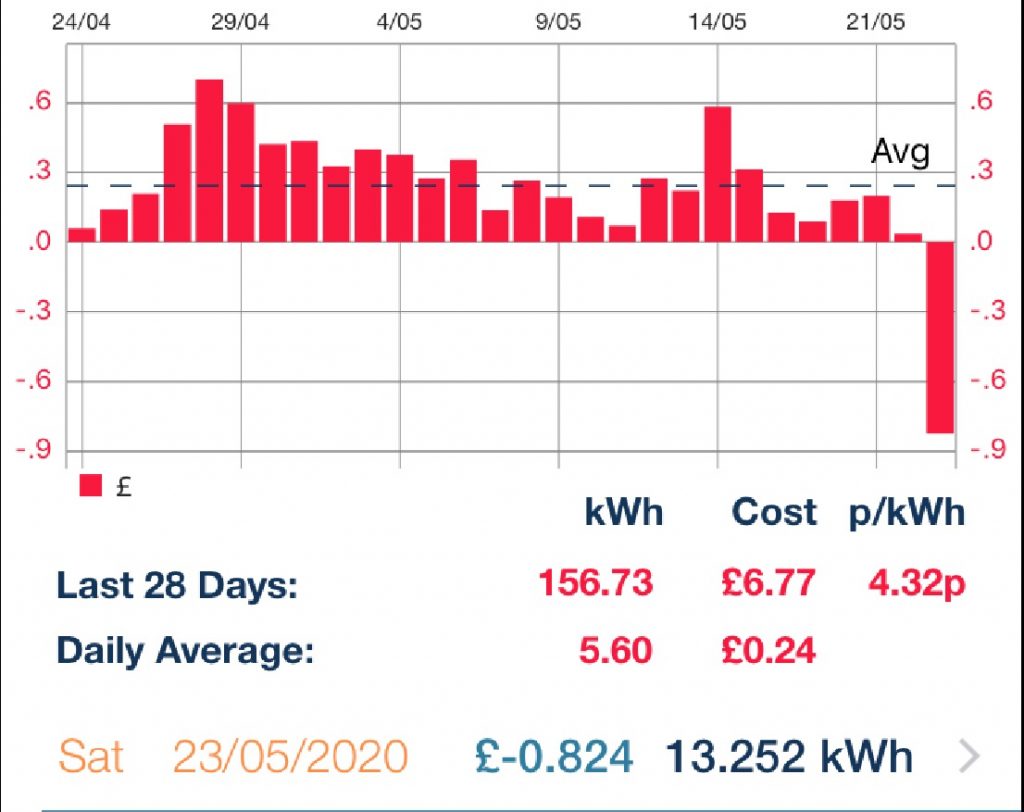
Finally the above image shows the last 28 days of electricity average cost in p/kWh. Although some other days included some periods of negative pricing, the quite exceptional pricing yesterday is amply illustrated with the combination of extreme prices and the new load management mode delivering revenue (i.e. negative cost) of 82.4 pence through consumption of 13.252 kWh at an average 6.22 p/kWh.
This is something of a zero sum game in terms of consumption as I don’t artificially increase consumption to improve income – such as leaving the oven on with the door open during a summer day – this is all about shifting consumption that would have happened anyway. However we have not only supported the grid when it is most stressed but also reduced our energy costs significantly (to the point of being significantly negative) by moving consumption from being predominately self-consumption (i.e. from our own solar panels) to being predominantly grid consumption.