Monthly Archives: April 2020

Octopus Agile Tariff

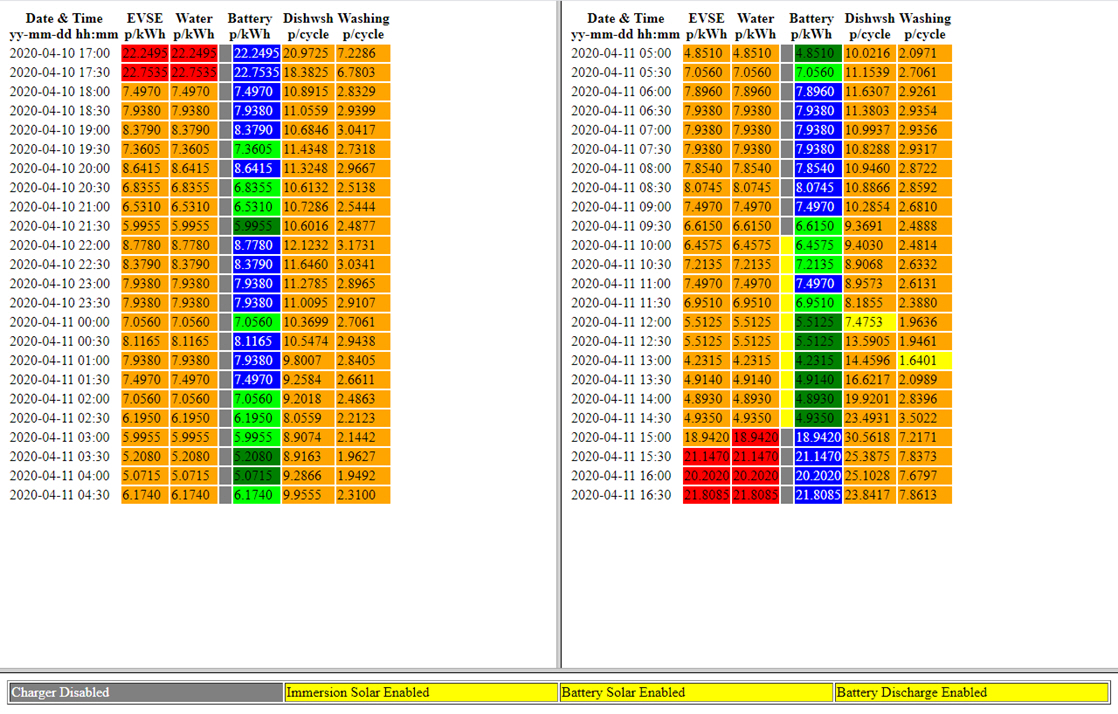
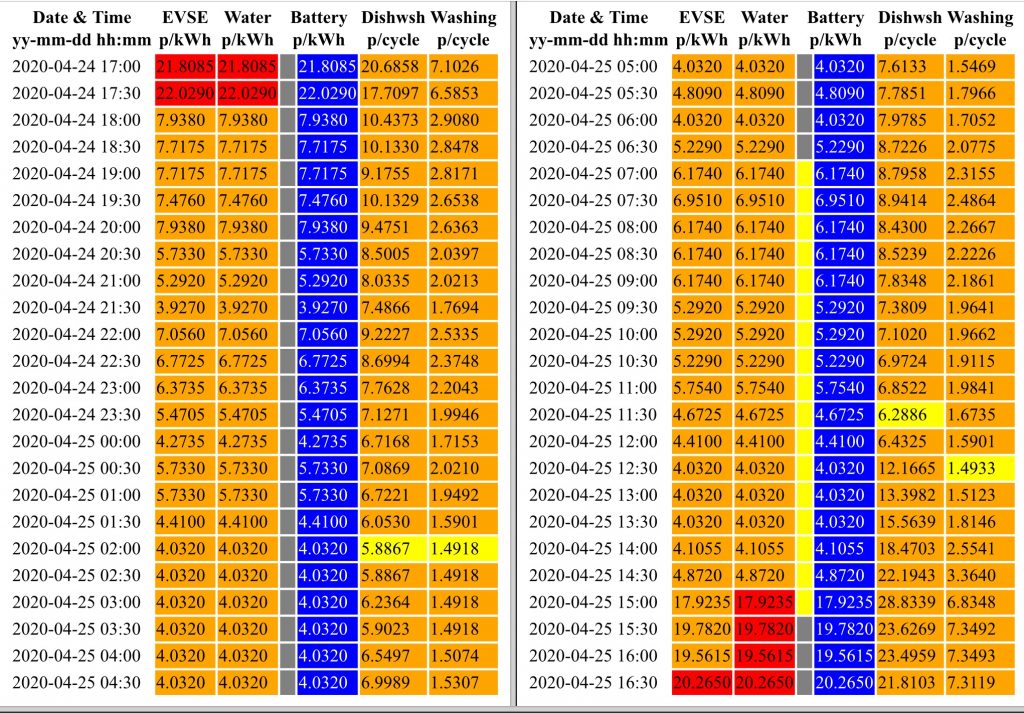
Much of the optimisation of my home exploits the cost-saving potential of the Octopus Agile electricity tariff. This tariff is a radical departure from a typical UK tariff. Rather than a fixed unit price that applies 24/7, the Agile tariff exploits the smart meter to provide up to 48 different half-hourly prices per day which change day-to-day according to a formula linked to daily electricity auctions in an absolutely transparent manner.

Octopus’ transparent pricing

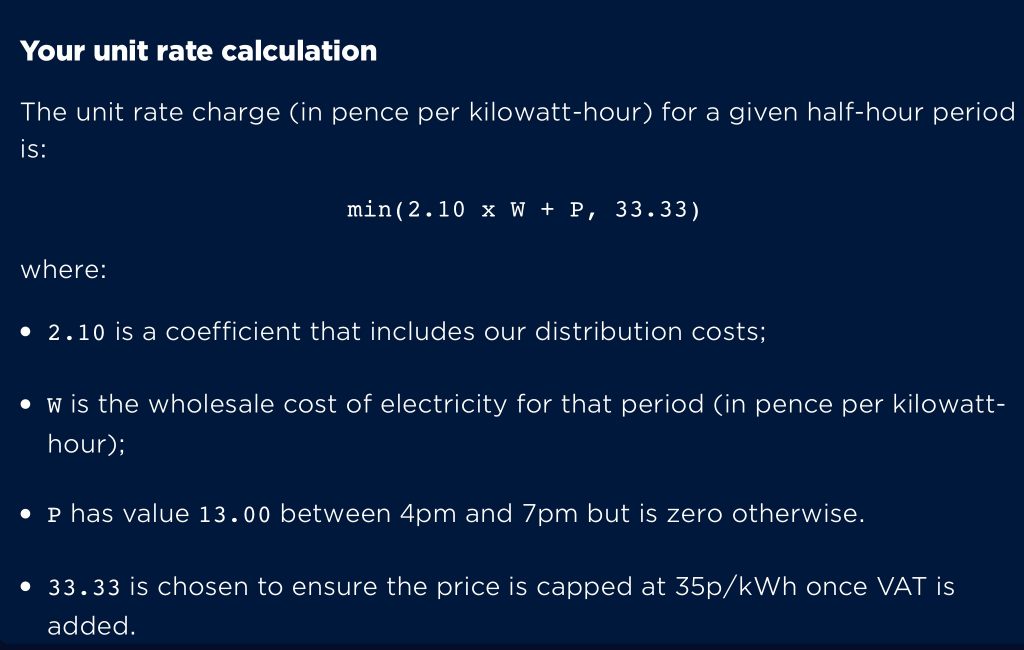
The prices can vary from several pence per kWh negative (i.e. being paid to use electricity) to a cap at 35 p/kWh which might apply in the early evening. That therefore places a some risk on the consumer, but equally can provide significant benefit. There are regional differences in the equation reflecting variation in the costs to distribute electricity in different parts of the country, so your formula might not be exactly the same as mine, but will be very similar.

Agile bill summary for two months ending mid-April 2020.

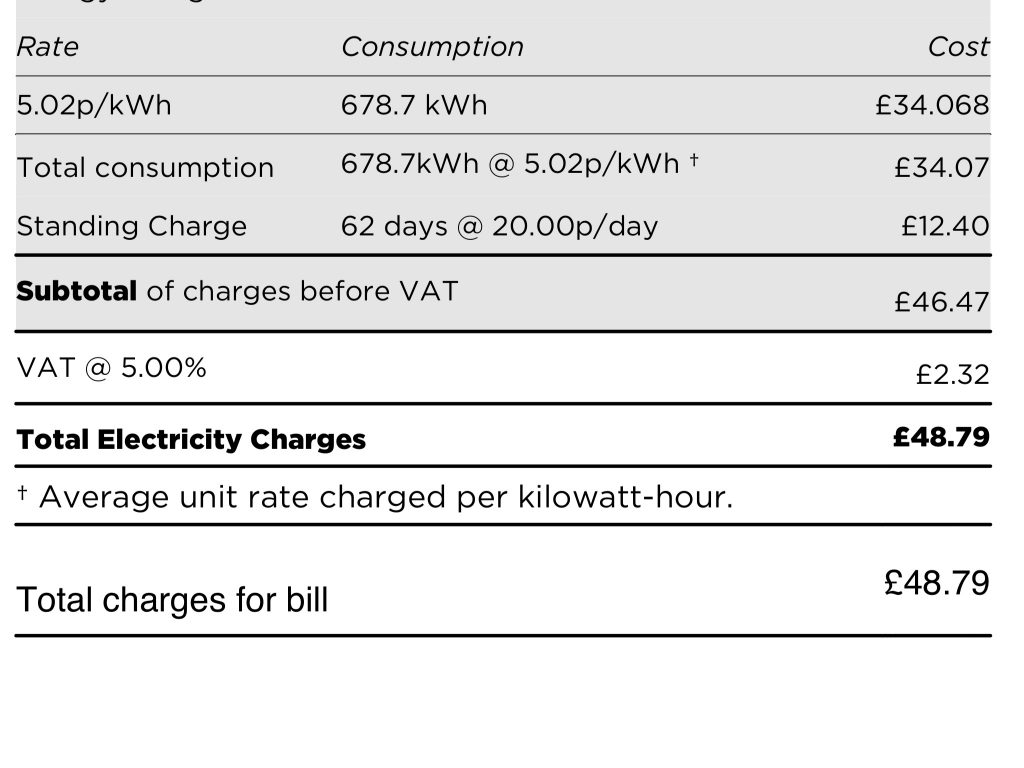
That average 5.02 p/kWh is not just competitive versus other tariffs – it tramples all over them. Personally I’m continually plagued by advertising claiming to save me £100s versus existing tariffs, but none ever comes remotely close to this rate. Thus, with my consumption pattern, I think that this is an unrivalled tariff. The Energy Saving Trust has calculated the average UK electricity cost at 15.75 p/kWh as at March 2019 (their latest analysis at the time of writing), so I’m currently paying a third of that average rate.

Of course you won’t ever see this tariff recommended on a switching website. Indeed, I’ve never seen any smart tariff recommended on a switching website, because they only ever seem to offer the choice between flat rate tariffs and Economy 7. In my opinion the lack of smart tariffs always denies consumers access to what may genuinely be the cheapest tariff for them by short term switches between tariffs that are pretty much alike. Those switching sites don’t want consumers to find long-term value, instead they want consumers to keep switching so that they keep earning commission.

However for me, not only have Octopus demonstrated long-term value, but they provide 100% renewable power, and are the only electricity company to be Which? recommended for 3 consecutive years. For you there’s a further £50 to be saved if you click on the image below and sign-up for any one of Octopus’ tariffs.

Octopus referral

Washing on sunshine

As regular readers will recall I’ve recently updated my battery controls with solar predication. For some years now my battery storage has automatically charged during sunshine and later discharged in the evening, and over the last year I added the HEMS to manage buying electricity including for the battery when the electricity cost was cheapest as there’s little solar in the winter, but now the HEMS has the ability to automatically adjust how much power is bought from the grid depending on how much output is expected from the solar panels in order to deliver a charged battery by the end of the day when the electricity price rises significantly. The battery charging can thus swing from all solar to all grid and all points in between entirely automatically based on the solar forecast.

Predicted solar output for March 16th to 18th as of the evening of March 15th.

Now however I’ve also added the capability to adjust when the wet goods – dishwasher and washing machine – run as a function of expected solar panel output.

As with the battery controls, I don’t attempt to match generation half hour by half hour with device operation because of uncertainty around how precisely a solar forecast from the evening before will match actual solar production up to twelve hours later. Instead my solar algorithm extracts the number of hours of significant solar production and the earliest start time of that production. For the battery that information is used to modify the number of hours of battery charging to be bought from the grid and the end of the window during which those hours of charging may be bought. Now I’ve updated the controls for the wet goods similarly.

The existing wet good controls look to start the machine at the time when the electricity cost for the cycle is cheapest within a time window set by the user, so the user defines the earliest and latest acceptable start times and the algorithm finds the cheapest start time within that window. The updated wet goods controls assess the number of hours of solar charging available and if both (i) the window exceeds a certain size and (ii) the user’s time window includes the solar window then the user window is narrowed to start at the start of the solar window. The resulting start time between the start of the solar window and the end of the user window may not be absolutely the cheapest grid cost but my assumption is that the solar contribution (which could be up to 100%) will in practice make this the cheapest grid cost as any power needed from the grid will be at a relatively good price. If this start time in the solar window does not reflect absolutely the cheapest grid cost then a second start time may also be identified which is the cheapest grid cost.

HEMS schedule with start times for wet goods within the solar window.

In the above example the start times are both within the solar window and the cheapest energy price, so no cheaper alternative is also offered. Start times within the solar window tend to be in the afternoon as the grid energy costs are lower. This also improves the probability that the battery may briefly discharge if the total load exceeds the solar output. However in the above example the energy price is so low that the battery is also force-charging (it’s dark green) so any surplus demand will come from the grid.

HEMS schedule with start times both inside and outside the solar window

In the above example the cheapest time to run each cycle from the grid is at night, although given the availability of solar during the day then any small saving in grid costs at night is very likely wiped out by the ability to run some (if not all) of the cycle during the day from the solar surplus rather than the grid. Both start times are available – the absolutely lowest grid cost and the lowest grid cost during the solar window.

It’s probably also worth mentioning the implications of running the appliance alongside the battery status being different colours:

  • Blue battery and state of charge being at or over 80% – appliance is prioritised over battery allowing battery to discharge to meet appliance needs as required – least likely to draw anything from grid (but likely highest cost to draw from grid)
  • Light green battery or (blue battery and state of charge being below 80%) – appliance is prioritised over battery charging alone (so battery may not discharge to support appliance) – a little more likely to draw anything from grid (but likely mid cost to draw from grid)
  • Dark green battery – battery charging and appliance are equal priority – most likely to draw something from grid (but likely cheapest cost to draw from grid, even to the point of being paid to draw from grid at times)

What happens without internet?

Today we are increasingly reliant upon the internet. During the current crisis when many are confined to home the internet provides opportunities unimaged to previous generations. Whether it’s online shipping, entertainment, using zoom or other online meeting tools to maintain family, society or church connections; the internet provides the means to supply us with our material needs, entertainment and social contacts in ways unimagined previously.

However our home, and other smart homes, may be particularly vulnerable should the internet become unavailable either in general or a particular service upon which we rely becomes unavailable. I thus thought that for this post I’d reflect upon the services our home relies upon for normal operation and what the impact of their absence would be. I will also reflected upon other failures of the service where such failures have been previously observed.

HEMS schedule for 11-12/04/2020
ServiceEffect if unreachableeffect of other observed failure
Solar forecastingIn unreachable when daily schedule being generated then schedule assumes no solar production like mid-winter.On April 7th I observed several hours around the middle of the day when there were no forecasted or estimated actuals reported, but the service continued to accept our measured readings. No impact on HEMS operation.
Agile electricity price data.If unreachable when daily schedule being generated then schedule carries over from prior. Schedule may be generated by manual initiation of the script when the required data becomes available.
If necessary operation of the car charger PLC could be suspended causing the car to charge at full power immediately and the car’s own timer used to set operating hours if needed.
If tomorrow’s price data is not yet published (i.e. it’s overdue), then the optimisation is performed using the most recent day’s price data. Since today will no longer be within the dataset provided by the solar forecast (as it’s no longer in the future) then no solar window will be found and so all the required number of hours will be bought assuming today’s (not tomorrow’s) prices, so the battery will still be charged but at a sub-optimal cost. The optimisation can be started manually once the overdue pricing data is available.
Immersun APIIf the real time generation data wasn’t available at all then solar car charging would be disabled. Car charging based on bought electricity price would continue.I have observed occasions when the real time data ceases to be updated (presumably because communications between immersun and cloud is lost) which then throws out the upload to the solar forecasting and the disabling of solar car charging at low generation levels. The forecasting site doesn’t seem to be phased by some erroneous data having never yet dropped below 0.96 correlation. The solar car charging has once been enabled later than it should which had some impact on battery state of charge, but was disabled slightly later via the immersun relay output.
An API is also used to switch the immersun into or out of holiday mode on days with significant periods of negatively-priced electricity. Unavailability of the API could leave the immersun locked in holiday mode and thus completely unable to heat water, or not in holiday mode when it should be causing self-consumption to continue when export would be more optimal to allow for negatively-priced import later. Vacation mode may be enabled or disabled manually via the immersun’s front panel to mitigate.
Powervault APILack of availability of the API would disable the ability to switch operating modes. This would leave the Powervault either charging from solar only or force charging, and may or may not permit discharge. The unit can be reset to normal state via repeated operation of front panel button which would disable scheduling but provide default solar operation.
WIFIPLUG APILack of availability would prevent the wet goods being turned on via API. Operation via the bushputton on the plug and indeed via Apple Homekit should remain.
Apple HomekitThe heating and other automations are run from Apple Homekit. My understanding is that the local service is provided from the two Apple TVs acting as hubs which should continue. Remote access via devices not in the home would be disabled.
Hildebrand APII have access to an API giving data from the HAN side of my smart meter and independent current measurement, but this is not currently used for control so no operational impact.
Impact assessment for loss of different cloud services

Overall I would conclude that there’s no significant issue here. The house would continue to be heated and appliances will still work. Any impact would be around energy consumption and cost only.

Some mitigation could be arrived at by:

  • resetting the Powervault storage battery to restore default normal operation,
  • manually starting or stopping vacation mode on the immersun’s front panel, and
  • suspending operation of the PLC on the car charger to enable car charging.

Tuning up for the performance

Last night rather unexpectedly my solcast solar irradiance data tuned itself. I use this data to predict the output of my solar panels and adjust what I buy from the grid in response. I had expected that tuning would happen eventually, but my understanding was that two month’s data was required, not the two week’s data that I had so far supplied.

Prior to tuning my predictions had looked like this..

solcast predictions before tuning

Although the system is clearly predicting output to a reasonable degree of accuracy, there are two obvious issues:

  1. The orientation of the array from due south seems a little off, as my array starts and ends generation earlier than the prediction suggesting the the orientation should be slightly more easterly in the model.
  2. The peak at a sustained 4 kW is overly optimistic. The panels can generate 4 kW according to my monitoring, but only relatively briefly and certainly not for more than an hour in March.

Nevertheless, the overall identification of better and worse days is clearly working.

solcast predictions after tuning

However after tuning both issues have been resolved. The measured and predicted curves match very closely. Note that the prior predictions have been updated by the tuning process, so March 26th which is included in both the images looks subtly different. Note also that my control is based on forecasts from the evening before, not the ‘1 hour ahead forecasts’ illustrated above. You may also observe that there is a discrepancy in the morning of April first, where the measured data is zero while the estimated actuals and forecasts are quite healthy, which arises as a result of a temporary failure of the immersun server from where the data is taken.

The ability to do tuning requires an upload of data. I upload generation data continuously at 5-minute intervals (the shortest allowed interval) which may explain the early availability of the tuned results. The script that I use to achieve this takes data indirectly from my ImmerSUN and is modified from this script. I achieved a 99% correlation which is pretty good. Subsequently it seems that the tuning takes place automatically each day.

Visualising the data

Multiple commentators have discussed the importance of knowing the Agile price at all times in order to optimise electricity costs and have developed a series of tools to enable that including phone apps, monitor screens, web pages etc.

Agile price visualisation via web page

However I think that the solution that I’m about to outline is easily the most sophisticated solution that I’ve seen.

The proposal takes automotive and aeronautical head-up-display capability and traditional cathode ray tube technology and integrates that combination in a whole new way.

Eyeball with integrated cathode ray projector.

The integrated projector shines the required price data onto the back of the cornea to give the recipient of the implant a continuous view of Agile pricing in a similar way to a head-up display. The copper band is used to modulate an electromagnetic field to deflect a cathode ray across the surface of the cornea to superimpose the future electricity prices on the user’s field of view.

Deflection of cathode ray by electromagnetic field to create image on back of cornea

The recipient of the implant receives a continuous graphical display of Agile pricing even when the eye is closed In a similar way to a head-up display. This round-the-clock price awareness is ideal to ensure optimal electricity costs.

Sophisticated graphics provide a continuous visualisation

Efforts to commercialise this technology are currently underway with launch anticipated on the thirteenth Thursday of 2021 as Oculus Agile.

Oculus Agile logo