One of the roles of my Home Energy Management System (HEMS) is to switch the control state of my Powervault storage system. Many users would probably leave the system in Normal where it always either charges or discharges proportionally to solar surplus or deficit respectively. Other users on time of use tariffs might also program charging on cheap night time electricity in a fixed time window. However my HEMS integration allows for automatically charging in varying cheap windows only when solar production won’t be enough to fully charge the battery.
Powervault G200 storage system
The Powervault has six Control States covering different combinations of charging and discharging behaviour. Only three of these are used in my implementation. The other states could be more relevant if I was paid to export to the grid, and the value of that export started to exceed bought electricity costs; but in my case I’m not paid for export and thus any export is an error state.
Control state
Charge
Discharge
When used
Force discharge
No
Full power
unused
Only discharge
No
Proportionate
unused
Normal
Proportionate
Proportionate
High electricity cost
Only charge
Proportionate
No
Medium electricity cost
Force charge
Full power
No
Low electricity cost
Disabled
No
No
unused
Powervault Control States
While I could use the HEMS to load a full daily schedule into the Powervault, instead I store all my schedules in the HEMS itself and switch the state of the Powervault (and indeed my other devices) every half hour as dictated by the schedule. This approach also gives me some flexibility to nuance Control State as a function of state of charge which isn’t available via the Powervault’s own scheduler.
The HEMS thus has three roles:
Creating the daily schedule from future electricity prices and the solar forecast.
Switching the states of the devices every 30 minutes following the schedule.
Real time data display and data upload to Solcast the solar forecasting service.
Last December I wrote of reviving my Powervault home storage battery with new internal batteries. However subsequently I decided that my old batteries were worth more to me for their remaining storage capacity than they were to me as scrap, and instead I would try to use both my old and new batteries.
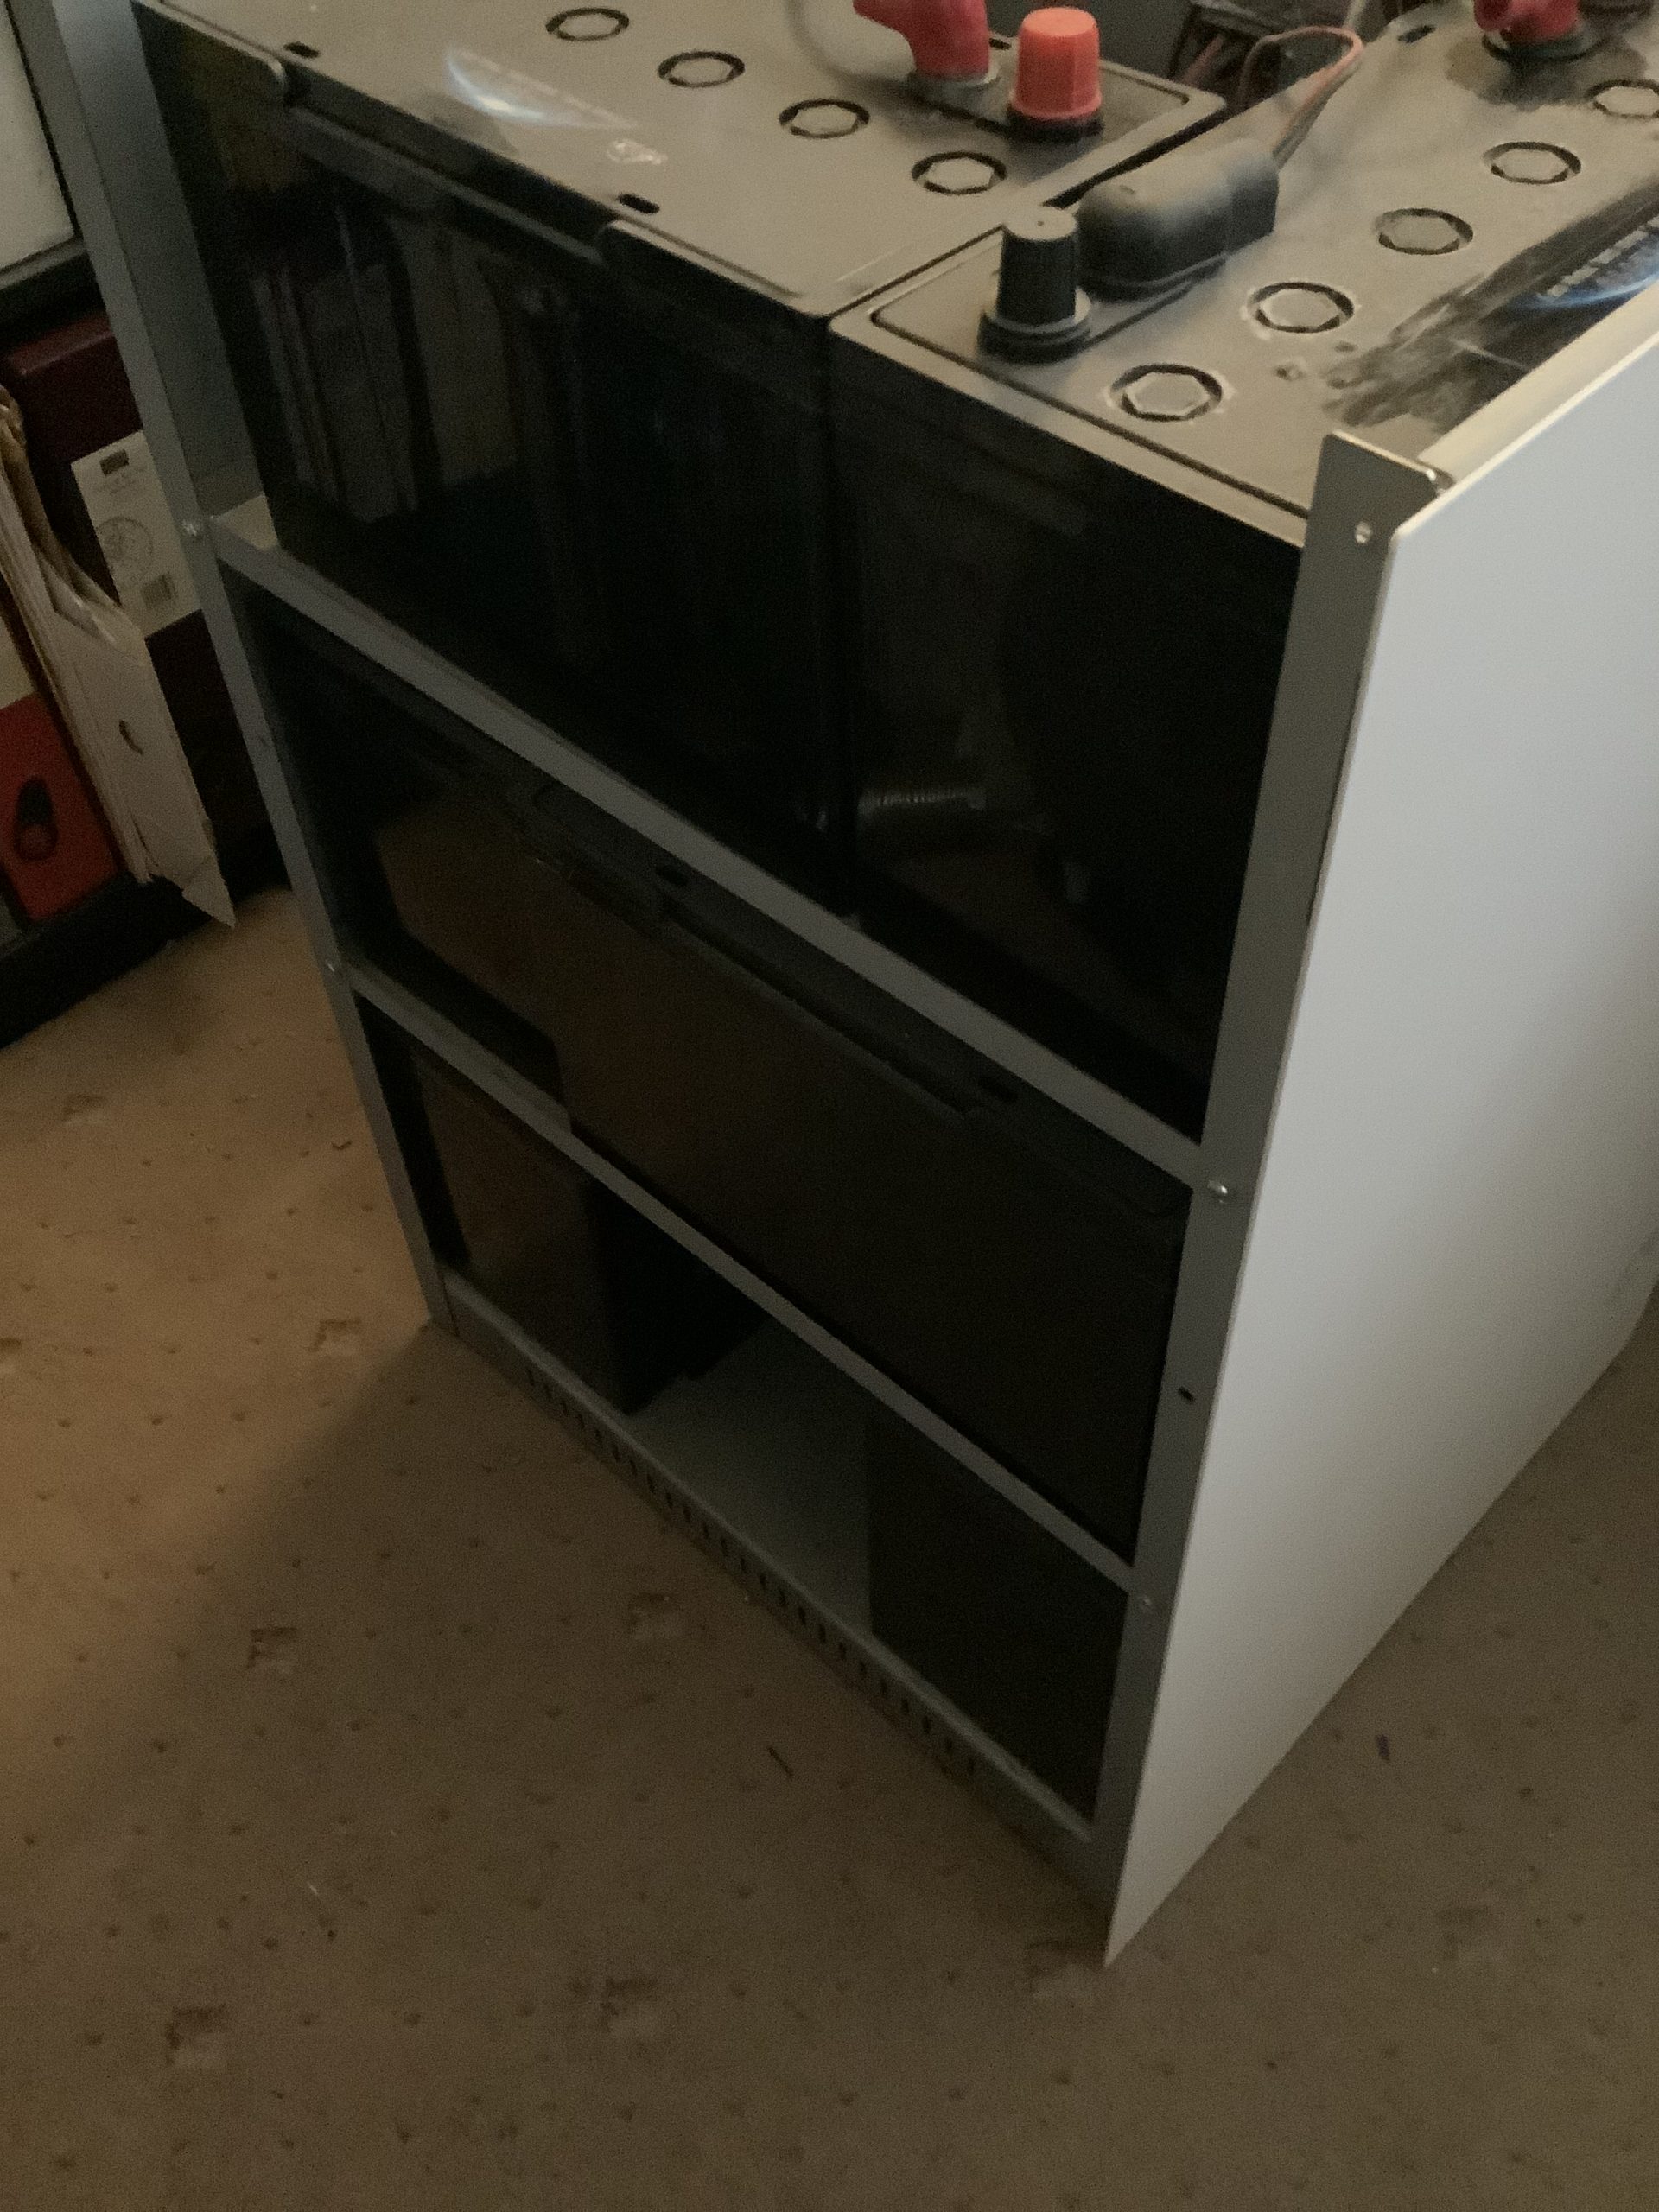
I knew that there wasn’t space inside the case for two sets of batteries so I planned to add the additional batteries in a separate rack outside the standard case.
Powervault G200 storage
Electronics side of G200
I decided to explore the right hand side of the Powervault where the controls reside. The picture shows a large blue box which is the inverter/charger and handles the conversion of AC to DC to charge the battery, and DC to AC to discharge the battery. The open green circuit board to the right controls the inverter/charger and connects it to the internet for monitoring and control. Down the middle is an umbilical that connects the batteries (on the reverse side of the panel) to the inverter/charger. Each pair of batteries on a shelf is connected separately to the inverter/charger.
I fairly rapidly determined that there wasn’t space to add additional battery cables to the inverter/charger so instead I added two terminal blocks (see right) in the free space to the right, moved the existing battery cables from the inverter/charger to the blocks, and then added new cables from the blocks to the inverter. At this point the system was checked to ensure that all was working correctly.
Terminal block with applications
DC fuse
I then added two DC cables from the blocks, through a suitable fuse, and through new cable glands to the external batteries.
All the additional parts including batteries, blocks, cables, fuse and glands are intended for similar battery storage applications in boats or caravans.
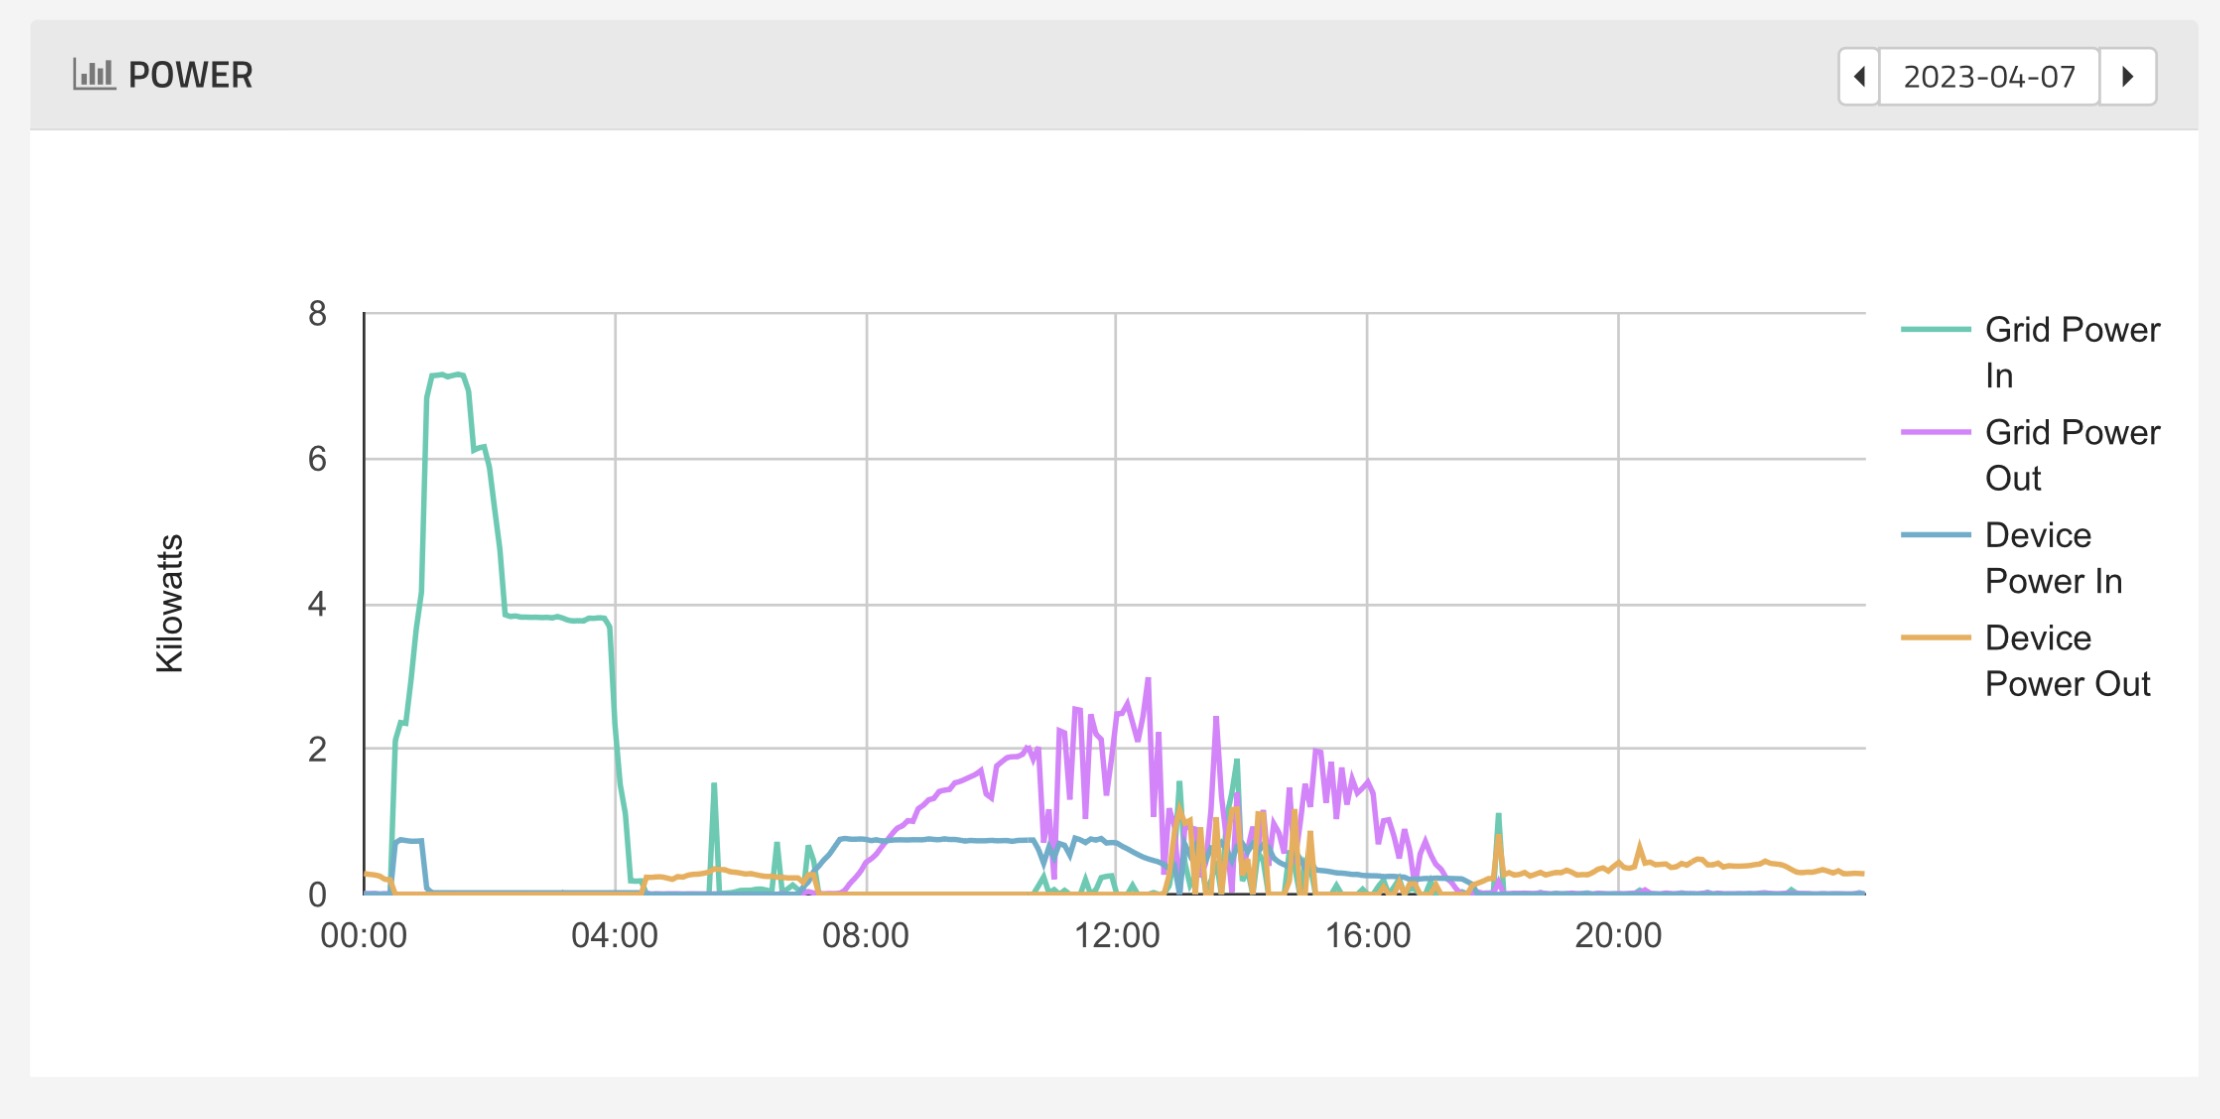
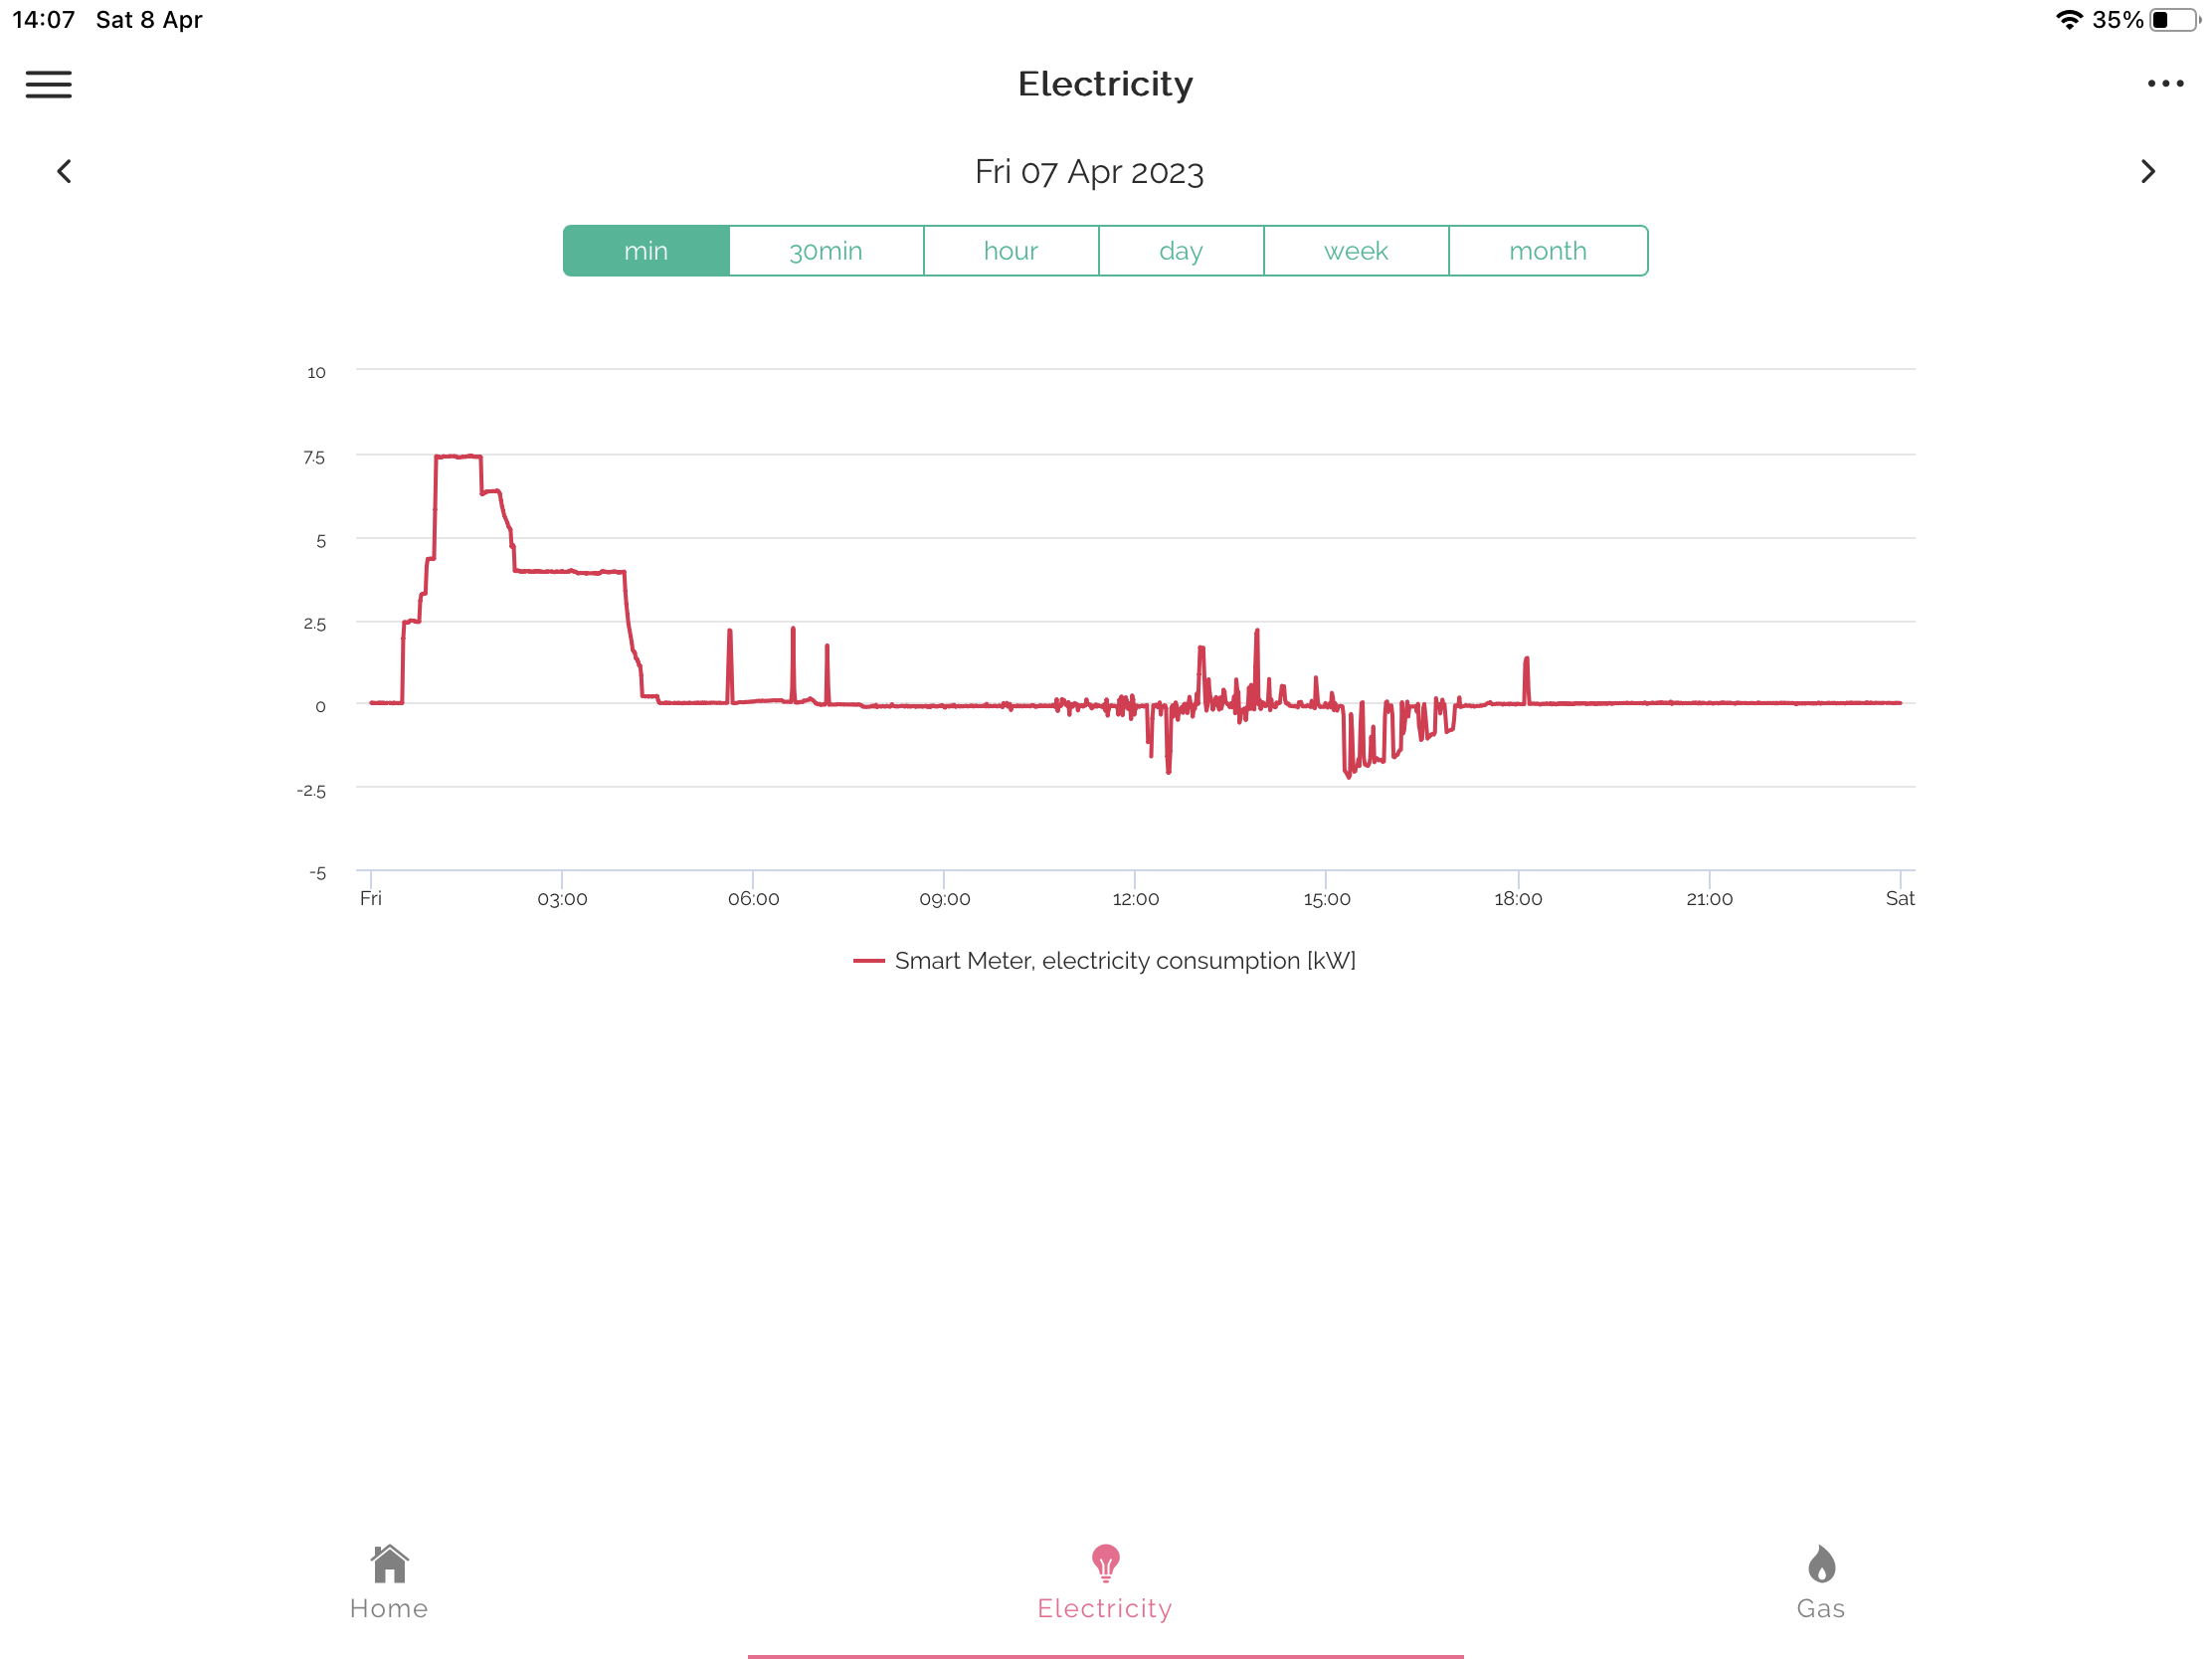
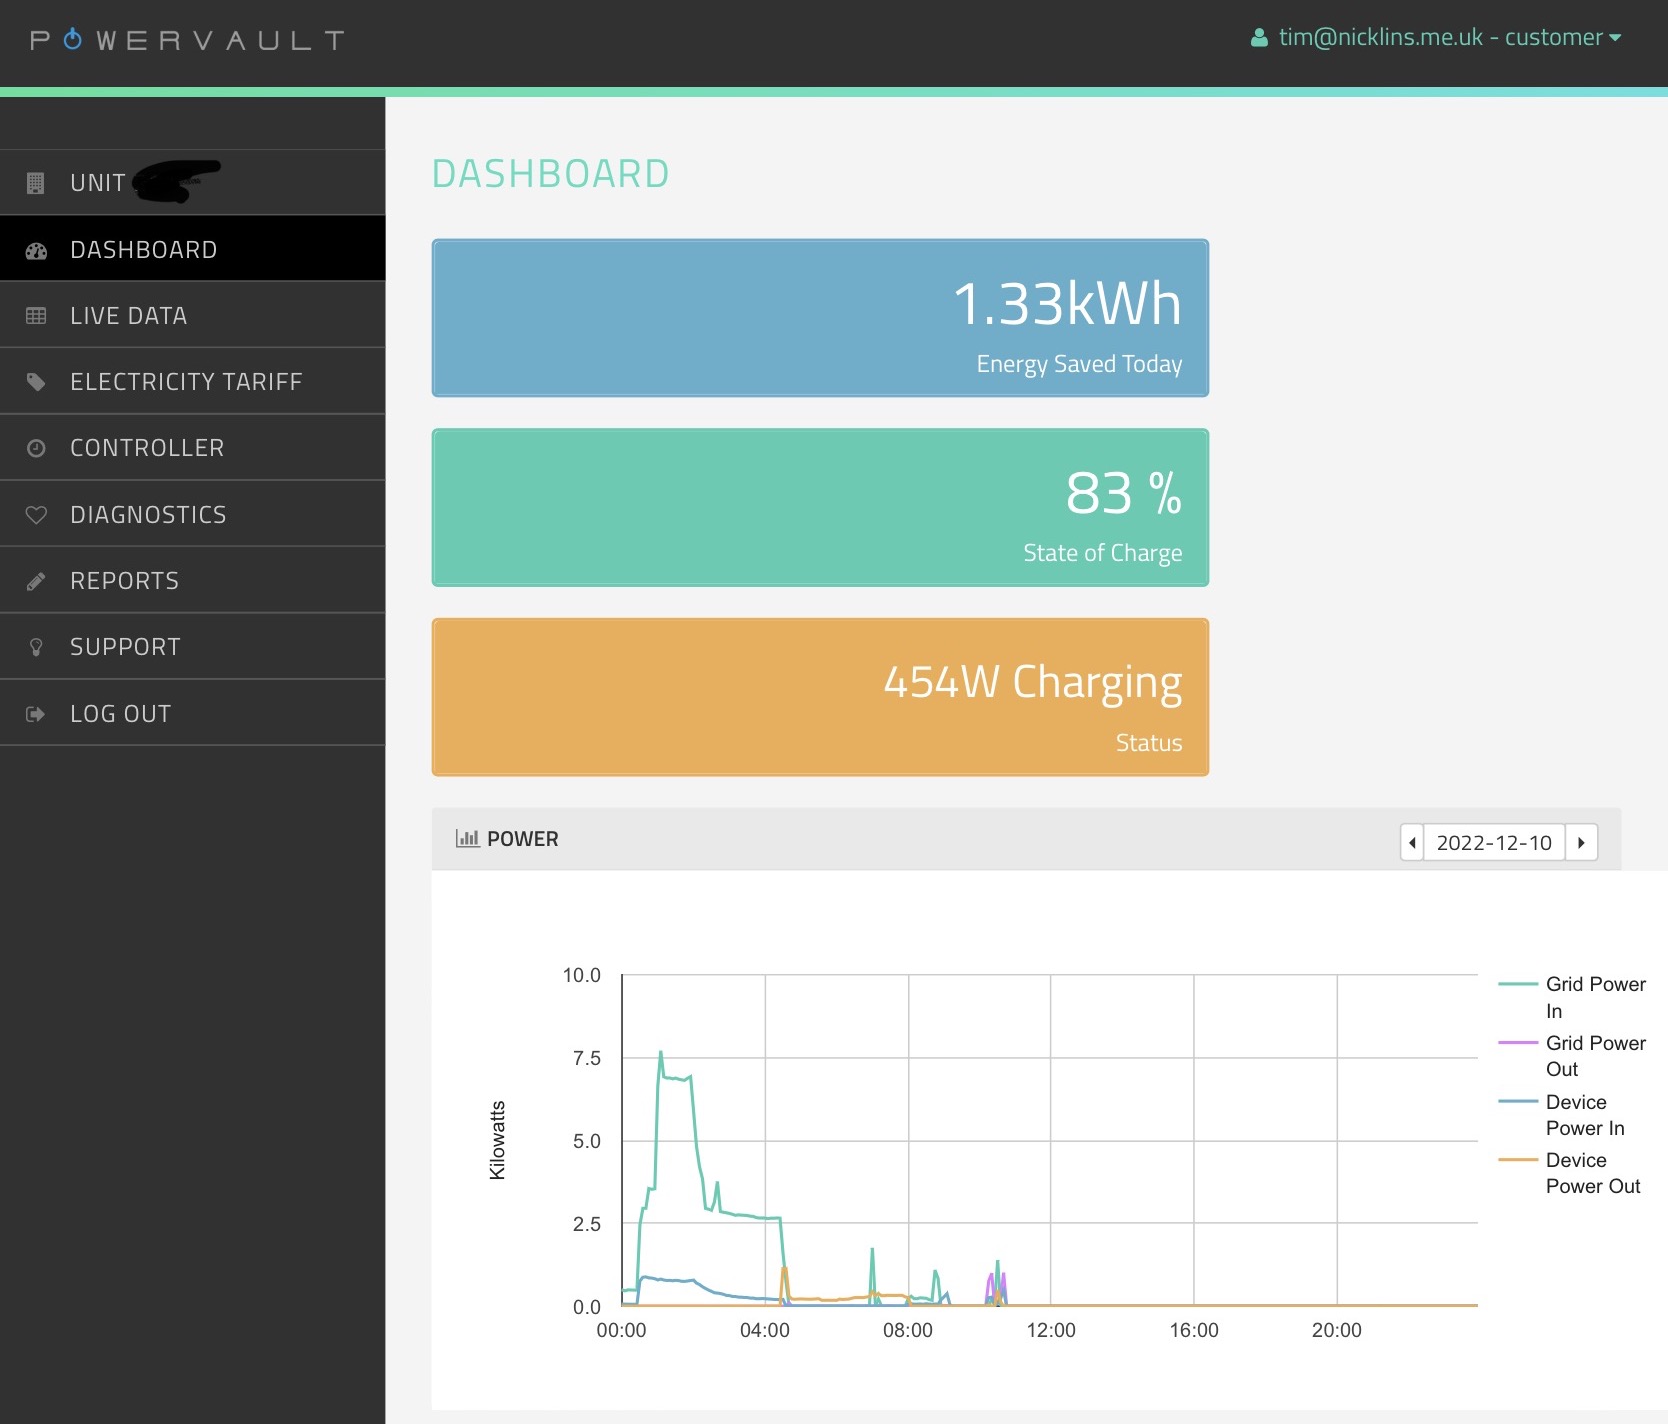
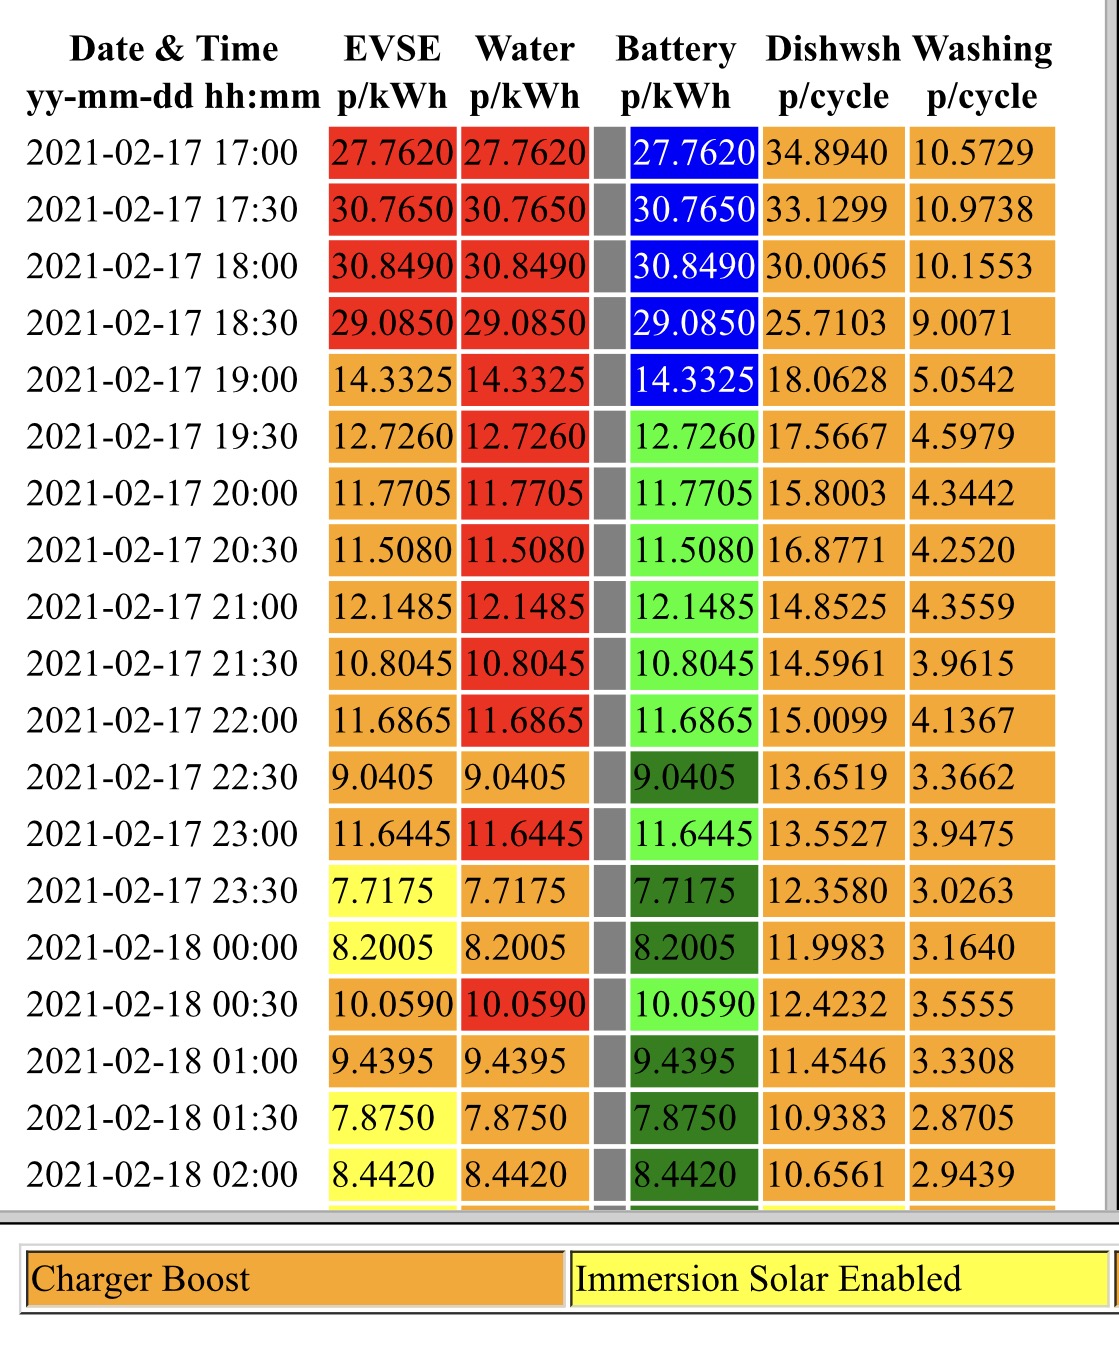
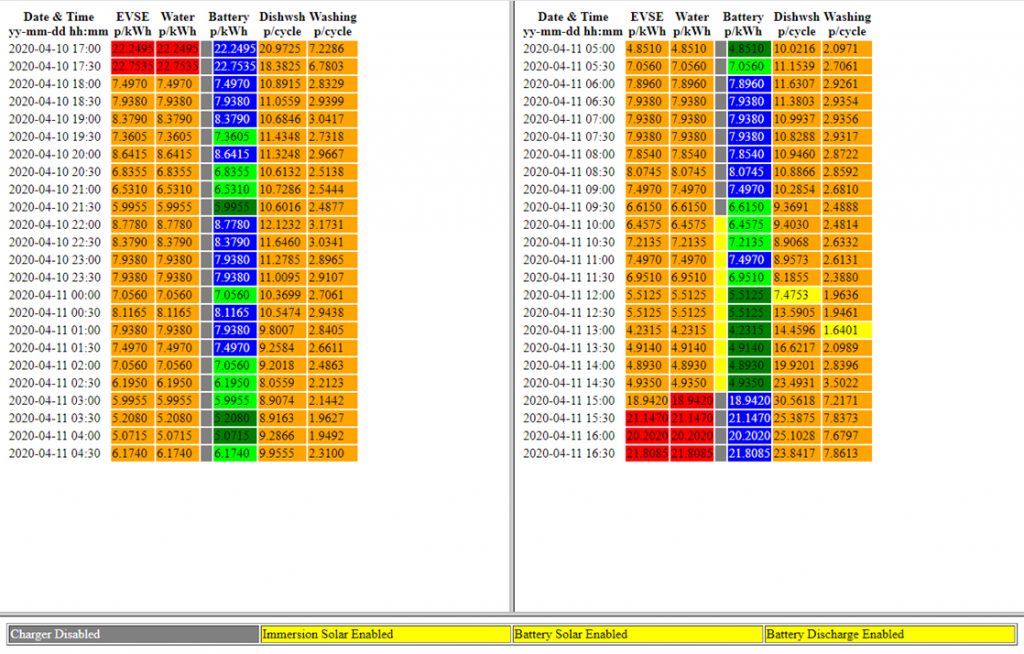
The results of this are that the battery continues to function correctly supporting the needs of the house. The above graphs, from Powervault and smart meter respectively, show:
00:00 to 00:30 – home still running on stored energy from yesterday having already run through yesterday evening on stored energy.
00:30 to 01:00 – battery charges for half an hour on cheap rate power (7.5 p/kWh) as HEMS predicts that today may not be sunny enough to fully charge the battery.
01:00 to 04:30 – battery idle while other household loads charge from cheap power.
04:30 to 07:00 – house runs from stored energy until sun comes up.
07:00 to 18:00 – house running from solar with battery charging, car charging and water heating at times from solar. Some export from 15:00 as all storage devices (battery, car and water cylinder are fully charged).
18:00 to 00:00 – home runs from battery.
Through the day the battery supported the house to the tune of 5.18 kWh and then the next day for 30 minutes until the cheap rate started. The Powervault had notionally 4 kWh usable capacity as supplied, although theoretical capacity was higher (3 x 120 Ah x 24 Volts = 8.64 kWh). Theoretical capacity is higher now, but I suspect that the control board continues to limit the usable capacity. A low ratio of usable capacity to theoretical capacity should be good for battery longevity as depth of discharge is limited. The older batteries have now been in use for over six years, although they have only been supported by the newer batteries for a couple of months.
Having recently spend around £600 replacing the internal batteries in my Powervault G200, I thought I’d look at the economics of that decision.
Powervault G200 storage
Originally I bought the Powervault to store the surplus electricity from my solar panels and then use that electricity later instead of buying electricity. I don’t receive any revenue for exporting electricity so to fill my battery from my solar surplus costs me nothing. I currently pay 35 p/kWh for daytime electricity. So, if I fill my battery from my solar surplus then I save 4 kWh (the capacity of the battery) x 35 p/kWh = £1.40 per day.
More recently I also charge the battery on cheap overnight electricity when there won’t be enough solar to charge the system fully.
I only get four hours of cheap power which isn’t enough to fully charge the battery. The battery charges at 0.8 kW so in four hours would use 4 hours x 0.8 kW = 3.2 kWh which at 7.5 p/kWh costs 24 pence. The system has a cycle efficiency of 80% so 3.2 kWh in gives 3.2 kWh x 0.8 = 2.56 kWh out. 2.56 kWh energy out is worth 2.56 kWh x 35 p/kWh = 89.6 pence. Having spend 24 pence to save 89.6 pence then I’ve made net savings of 65.6 pence per day.
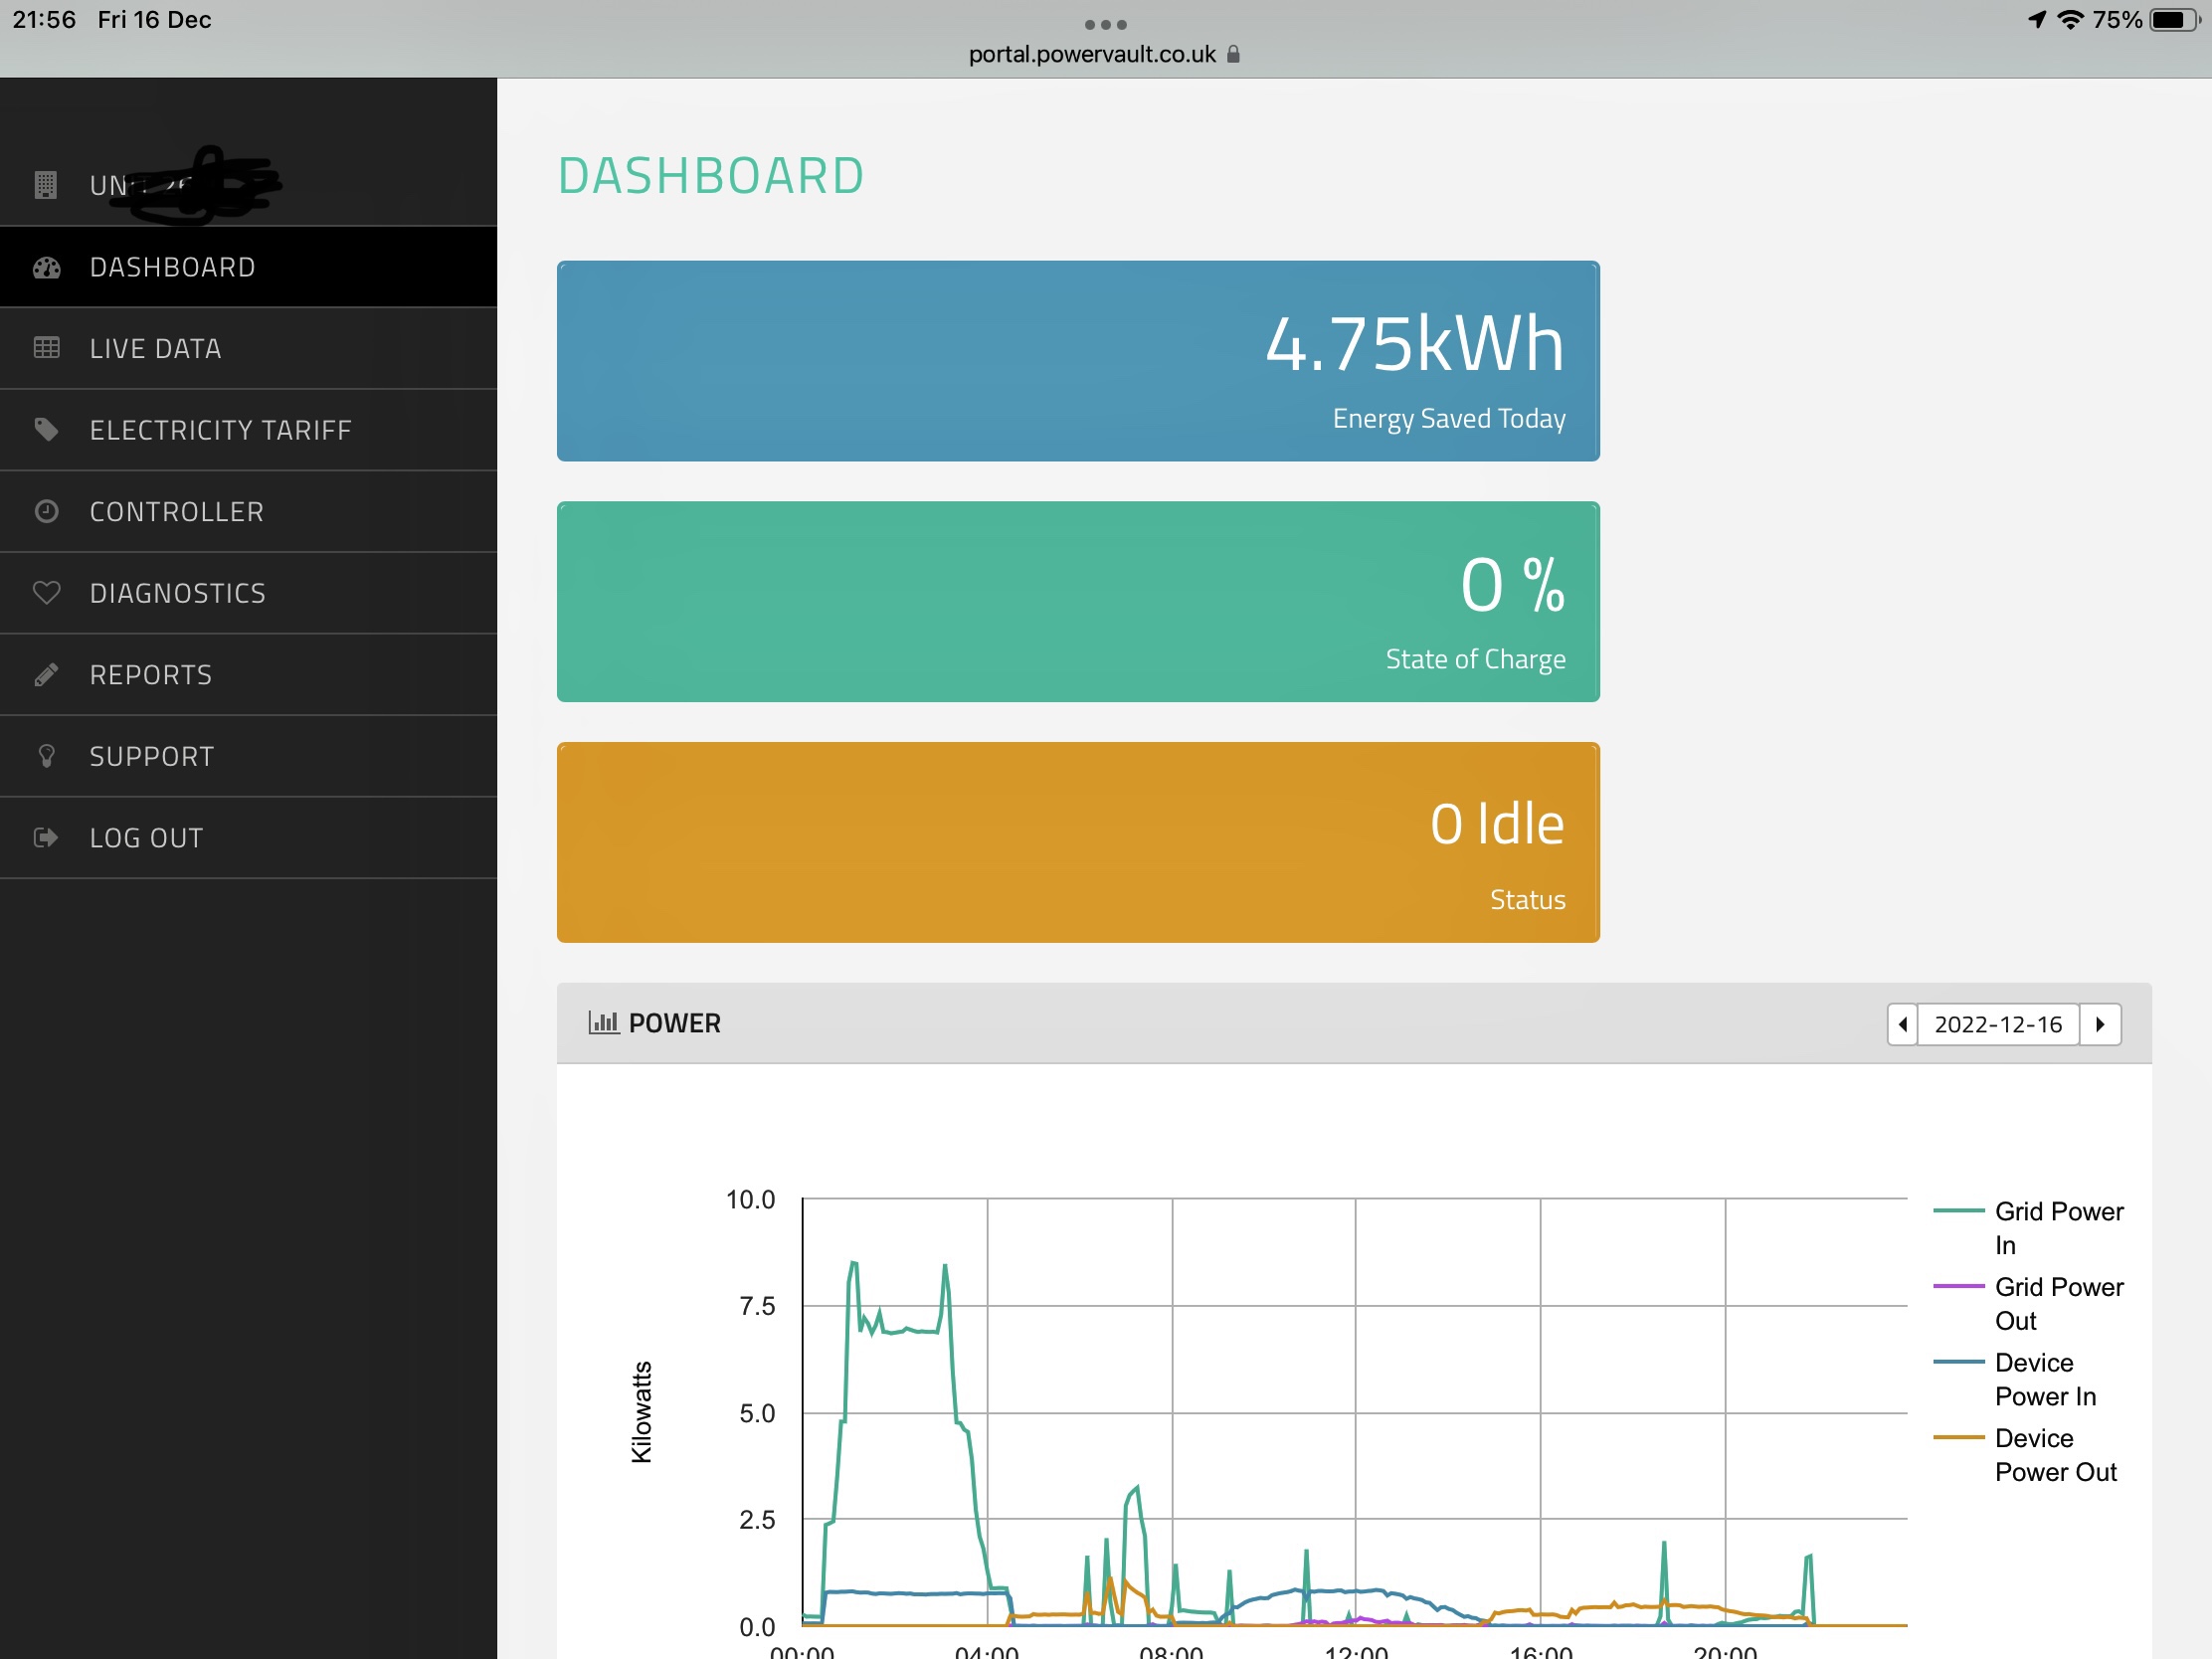
G200 User Portal
A day like that shown in the portal with 4.75 kWh in savings is a bonus in terms of annual savings although it may accelerate the deterioration of the battery as it’s been double-dipped during the day with both overnight and solar charging.
If I assume that half the time the system is filled by solar and half from the grid then my annual savings are 0.5 x (£1.40 + £0.656) x 365 = £375.22. Having spent £600 on the new batteries then my payback time is £600 / £375.22/year = 1.6 years. The previous batteries lasted for 6 years although the new batteries were relatively cheap and might not be expected to last for so long. However even if the new batteries only have half the life of the prior ones then that still seems like an attractive investment.
My total investment in the battery storage is now £2600 – £2000 to buy it six years ago plus the £600 just spent on new batteries. That’s a payback of about seven years with expectation that the new batteries will extend the life of the system to nine years.
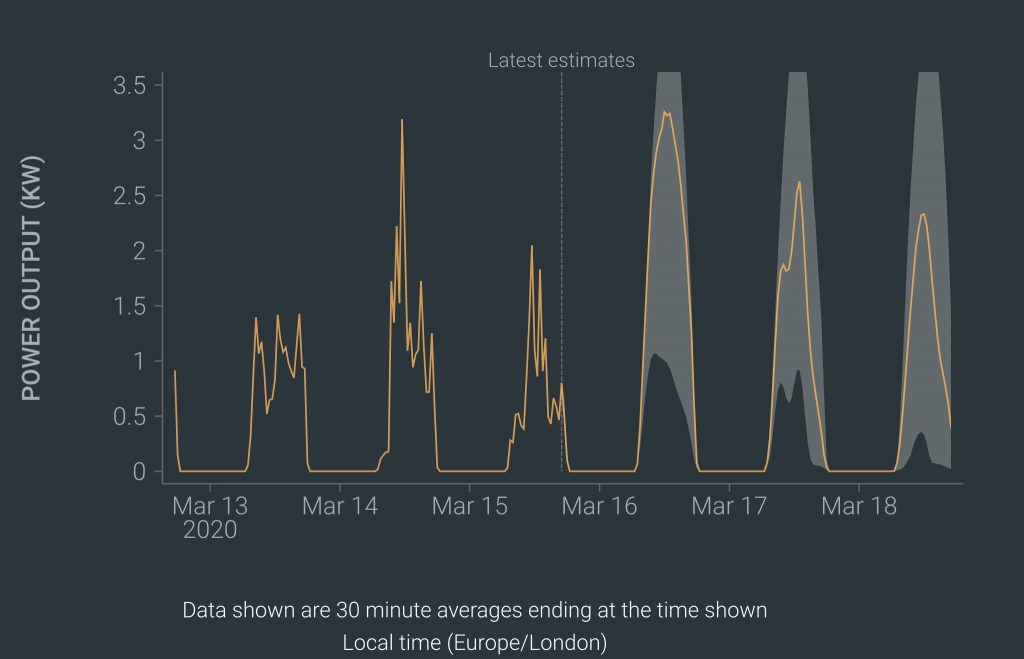
My Powervault battery is now six years old. Initially I used it only to store surplus electricity from my solar panels but more recently have also managed it from my HEMS to reduce my energy costs by charging it when electricity is cheapest to offset consumption when electricity is most expensive. However it’s become clear in recent weeks that the working capacity of the battery had significantly declined.
Powervault portal for G200 before battery replacement
My Powervault is designed to have a reasonable life – its 7.92 kWh internal batteries (6 batteries x 12 Volts x 110 Ah) are limited to 4 kWh to maximise the number of charging cycles. However after 6 years working capacity had dropped to less than half of that and I decided that the time had come for replacement. Declining battery capacity is illustrated above with the blue line showing battery charging between 00:30 and 04:30. If the battery had continued at constant power (about 750 Watts) then it would have charged 3 kWh (4 hours x 750 Watts / 1000 Watts/kW). However here the battery has ceased to draw 750 Watts from around 02:00 and thereafter power consumption has significantly declined – this may be about 1.75 kWh rather than 3 kWh.
These figures (1.75 and 3 kWh) are also energy into the battery – but you don’t get out everything that you put in. With a quoted round trip efficiency of 80% then 1.75 and 3 kWh in would deliver 1.4 and 2.4 kWh output versus the original capacity of 4 kWh.
I reached out to both my installer and Powervault themselves but neither got back to me with any proposal to investigate or replace the batteries so I resolved to do it myself.
Powervault G200 internals
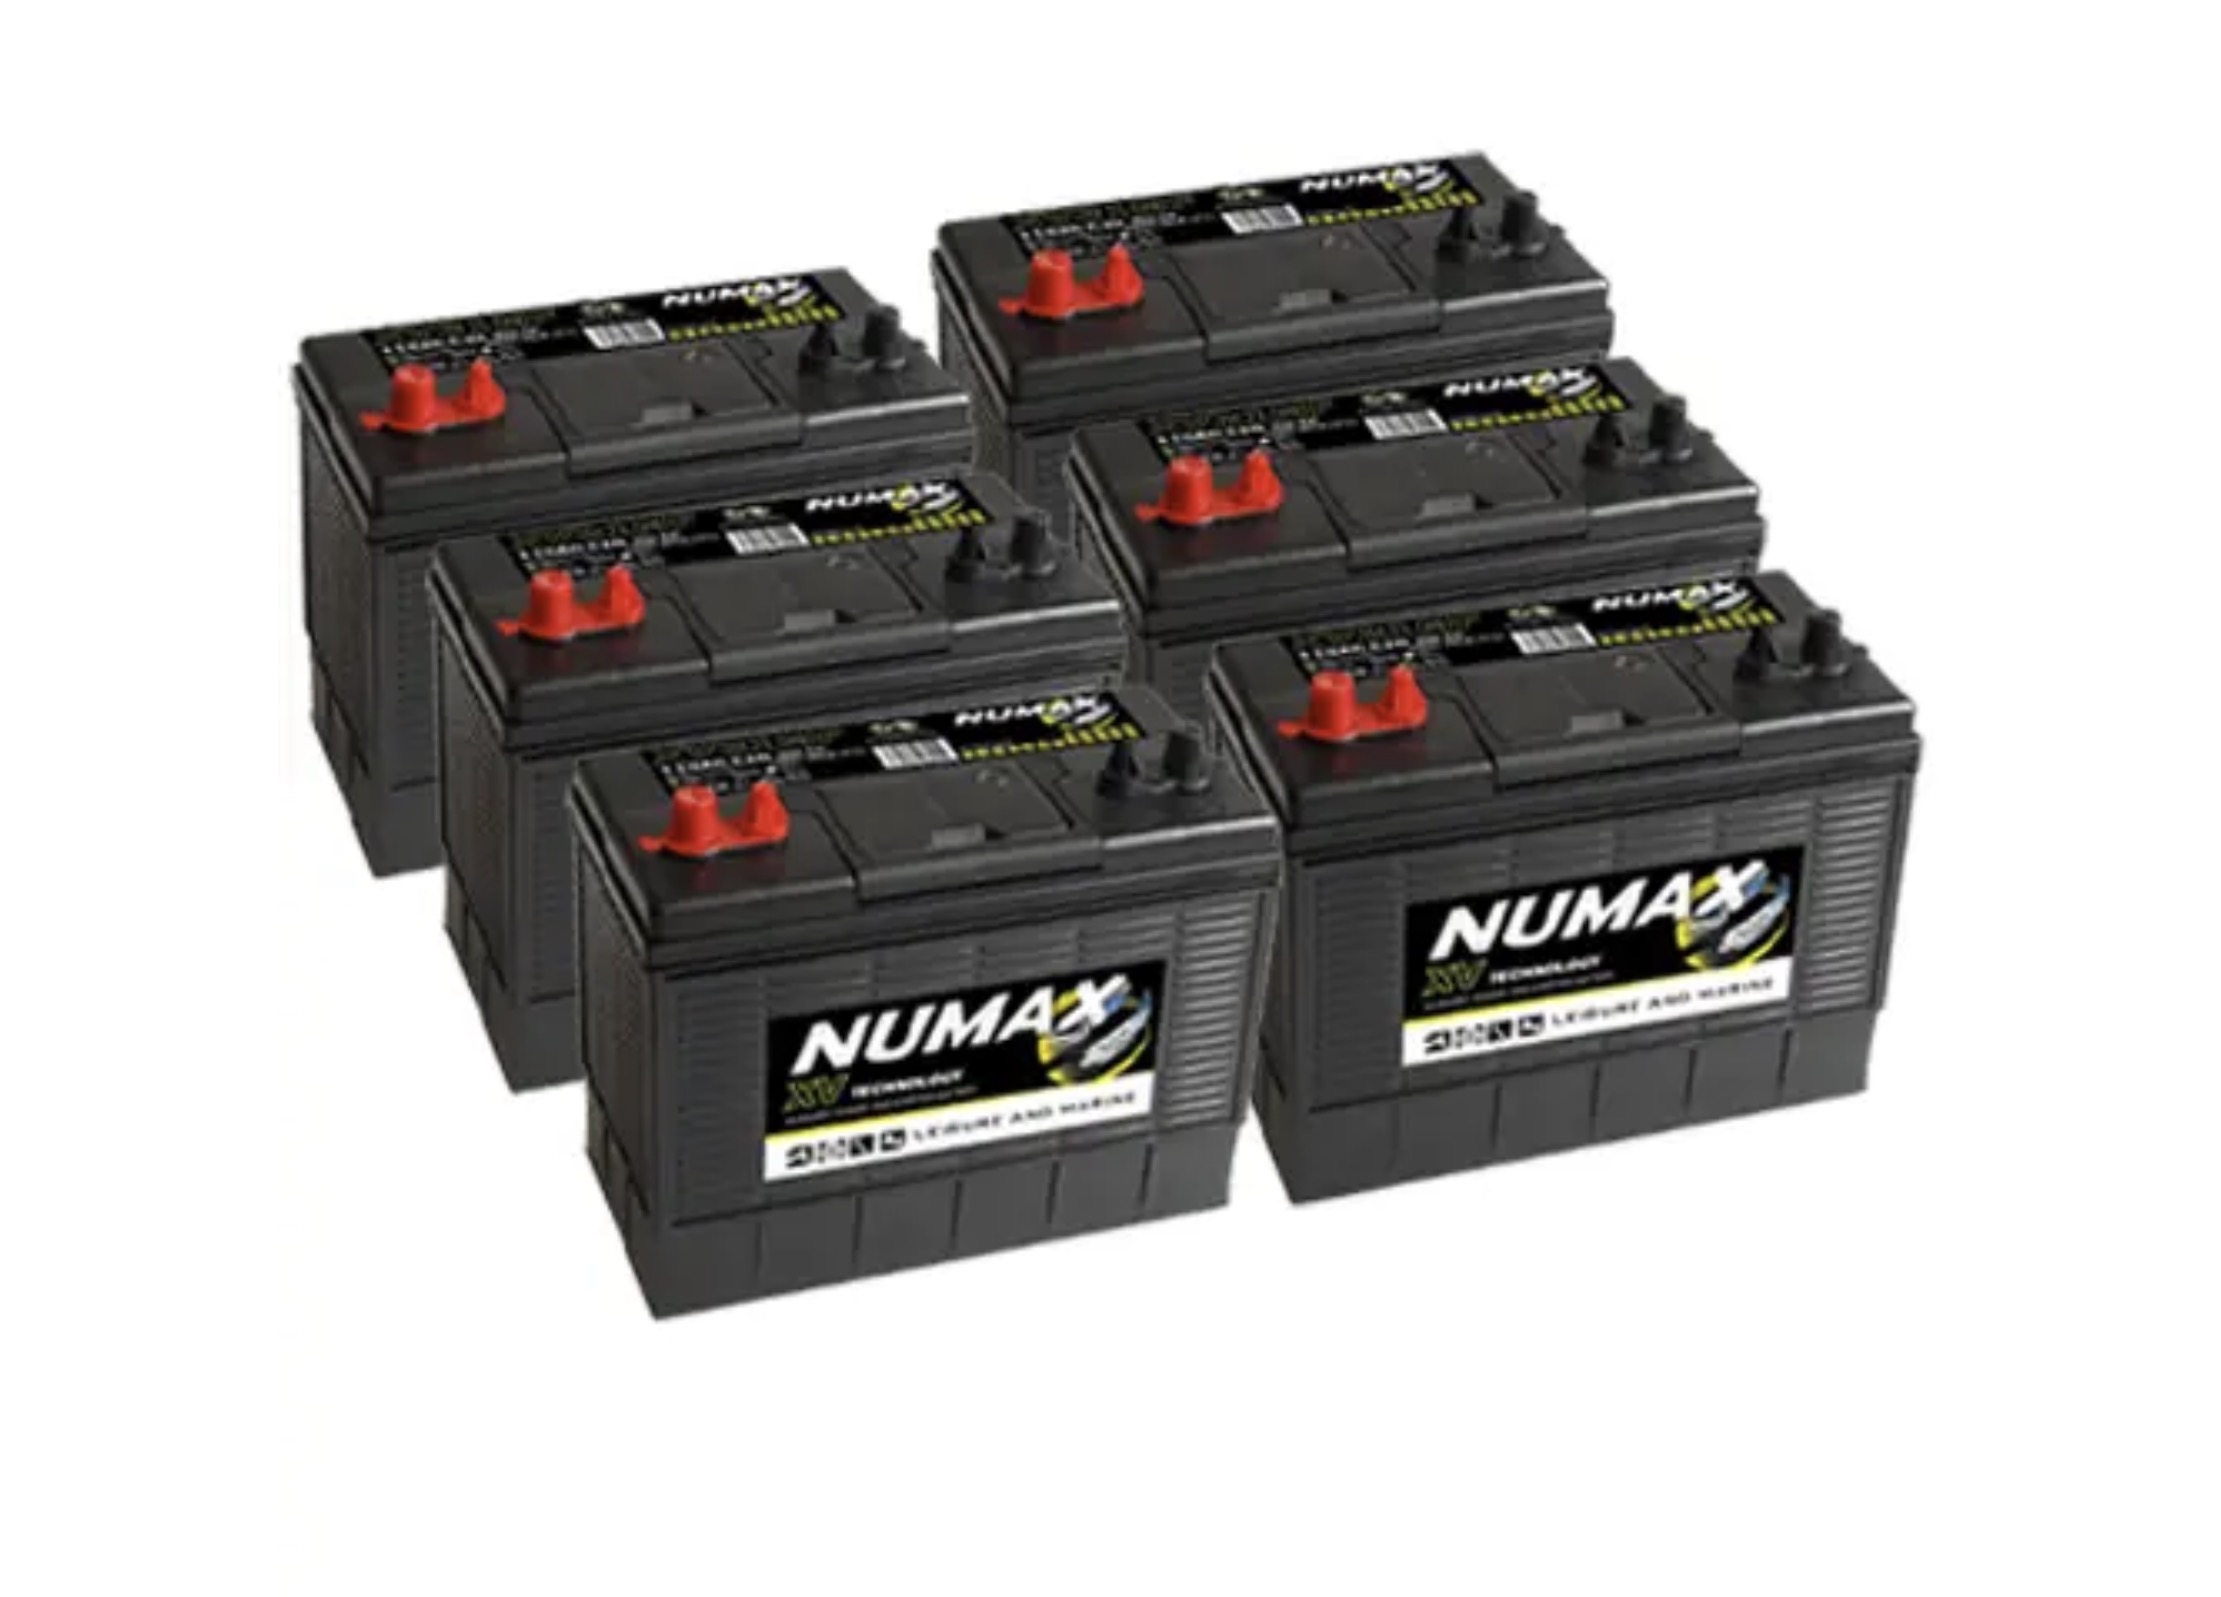
Initially I did a little investigation by removing the top and side panel of the Powervault (after turning off the power). Inside I found six twelve Volt one hundred and ten Amp hour batteries arranged over three shelves on plug and socket connections – so fairly straightforward to replace. A search of eBay for deep cycle batteries of similar capacity indicated prices range from around one hundred to around three hundred pounds per battery (six required). I eventually decided to go for the cheapest as I wasn’t entirely sure of success and I don’t know for how long my six year old system will be supported even if battery replacement was successful.
6 x Numax CXV31MF Batteries 105Ah
The Numax batteries are sold as deep cycle batteries ideally suited for solar installations.
Powervault G200 installation.
The process for installation of new batteries consists of unplugging and removing all the batteries from top to bottom, and then installing new batteries from bottom to top – two on each of the three shelves. I found it necessary to undo the fixing screws on the back of one of the shelves in order to flex it upwards to create enough clearance to get the batteries on the level below out.
Powervault portal for G200 after battery replacement
It’s only been just over a week now, and it’s fairly dull weather at the moment, but it does seem that the replacement has been successful. The dashboard above for example shows both that the system has charged at full power for 4 hours overnight (3 kWh in) and also that 4.75 kWh has been saved (versus 4 kWh working capacity) as to a degree there’s some double-dipping going on with the two partial charges of more than half capacity (one overnight on cheap mains power and one during the day on surplus solar power).
Time will tell what the longevity of these cheap batteries is.
It been over a year now since I last reviewed what return I was getting on my investment in energy smart technology – solar panels, battery storage etc – so I think an update is due. This time I’m going to take the input data from my immersun system – one year of data from start of June 2020 to end of May 2021.
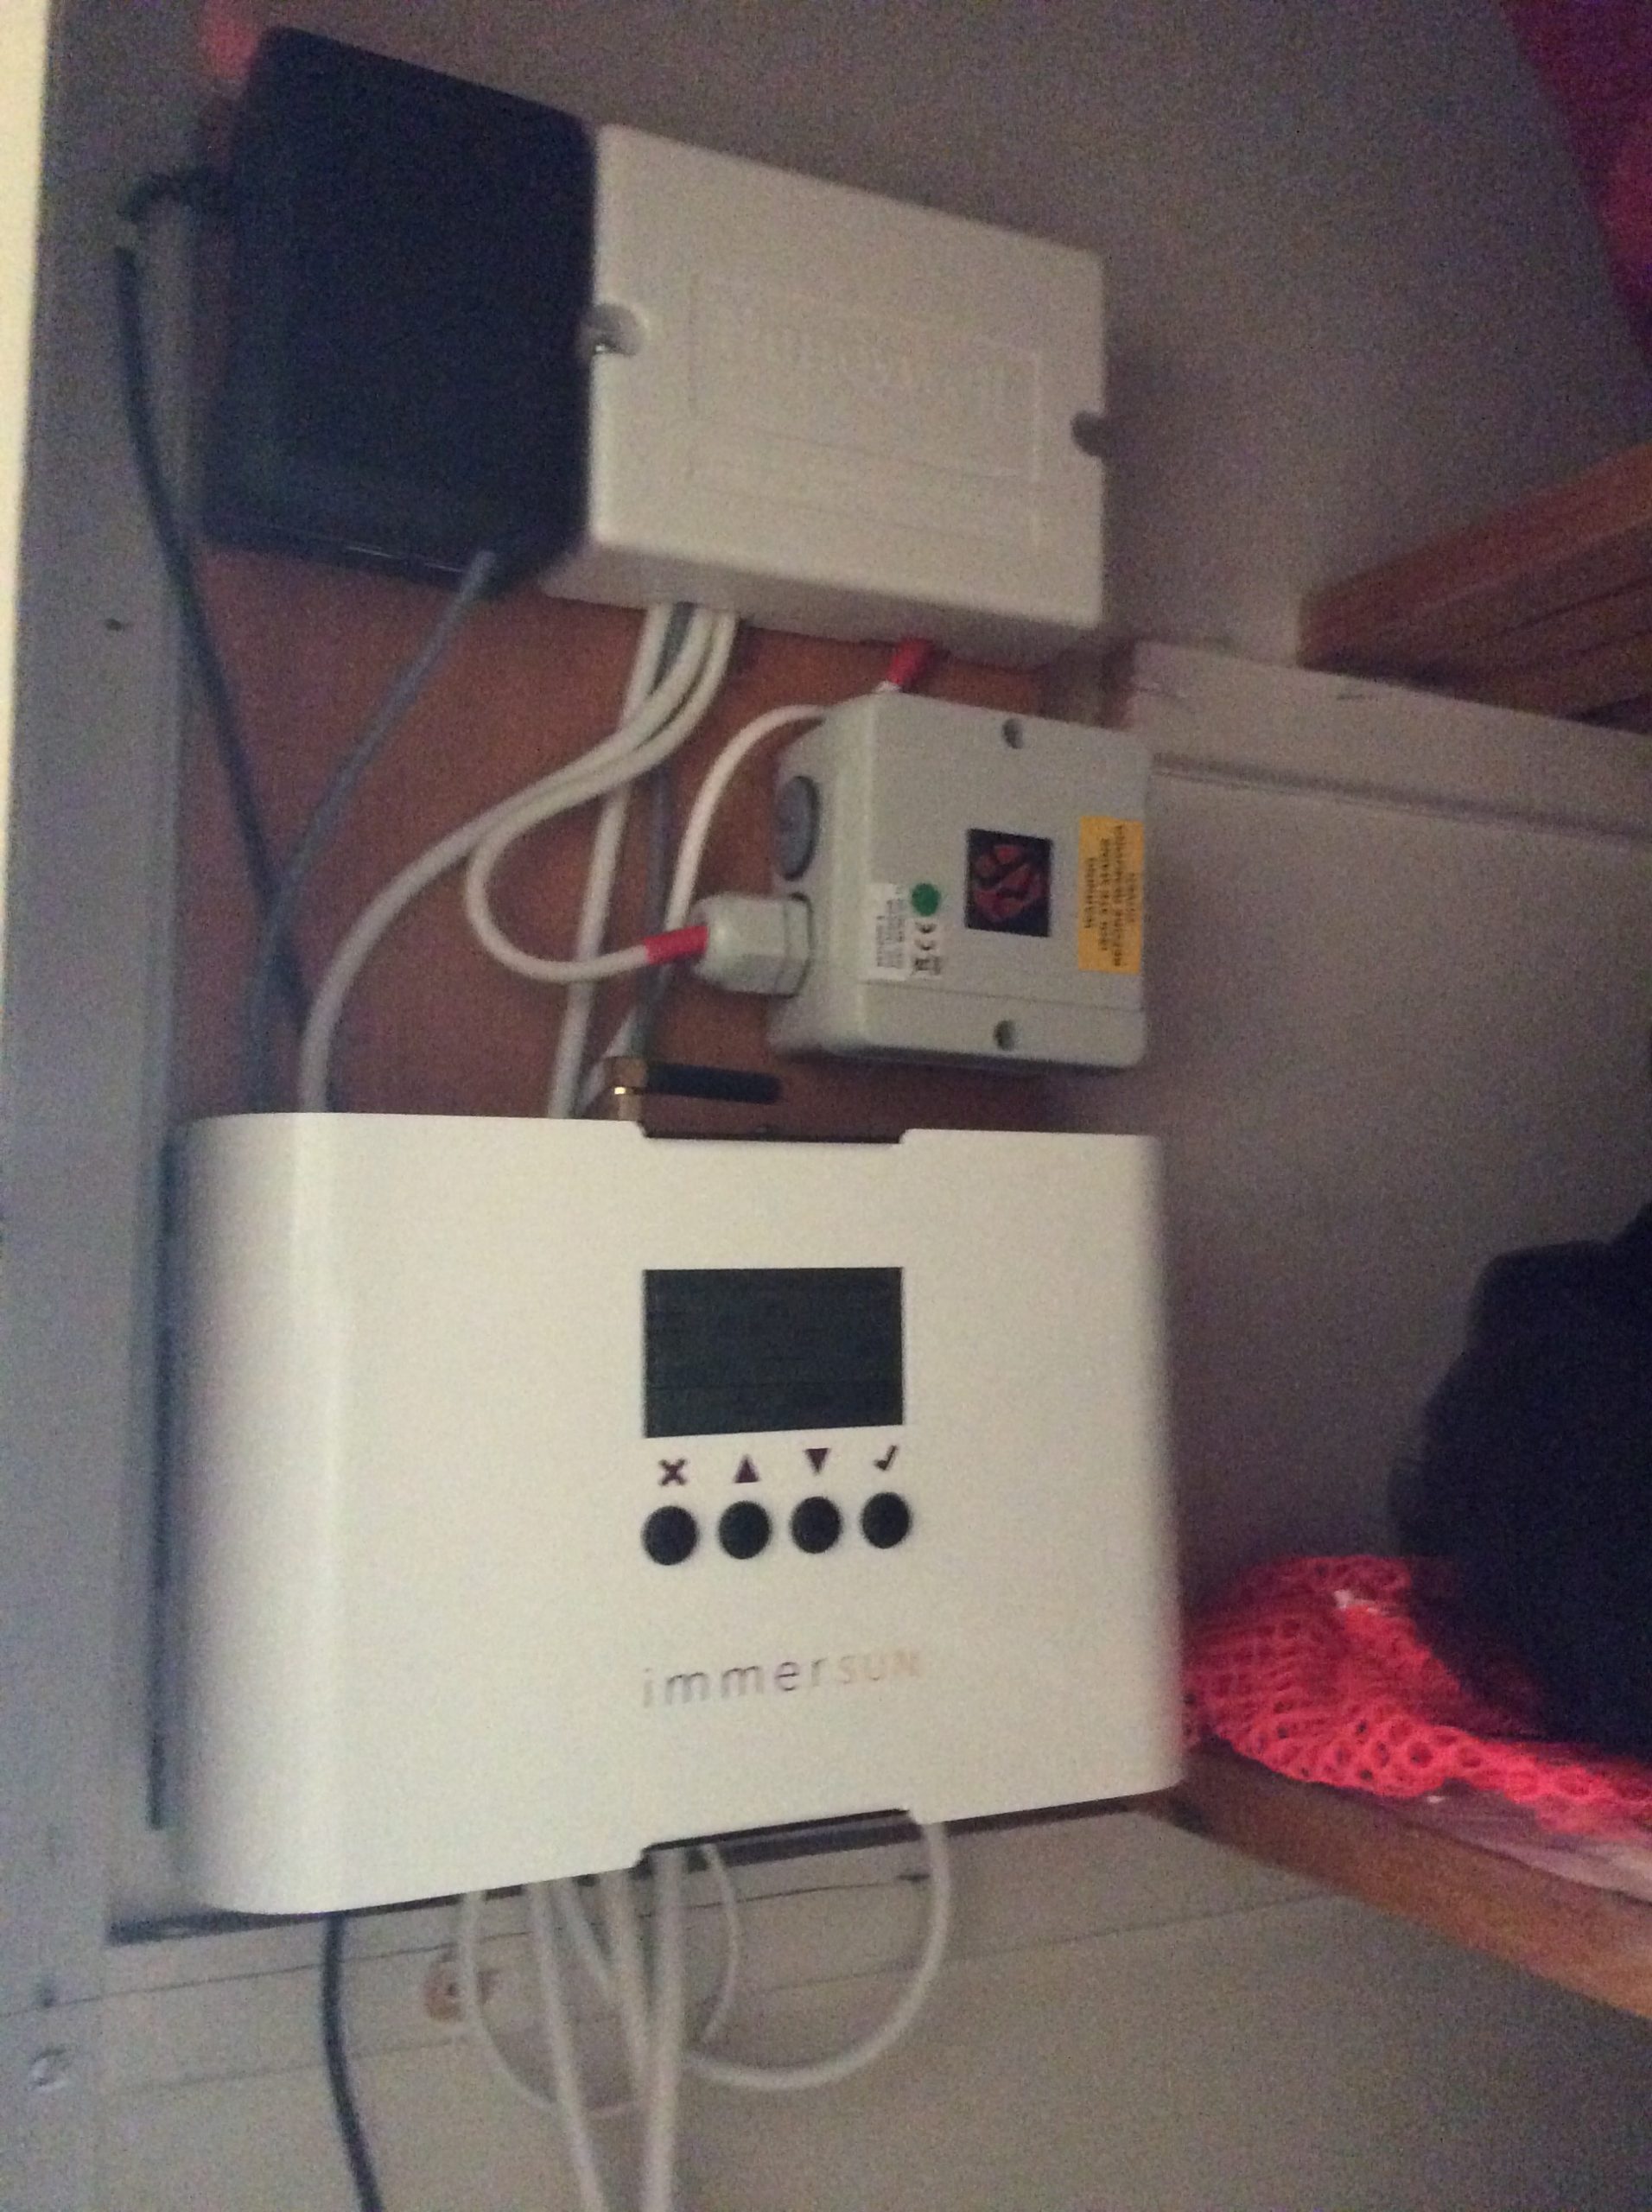
ImmerSUN diverter
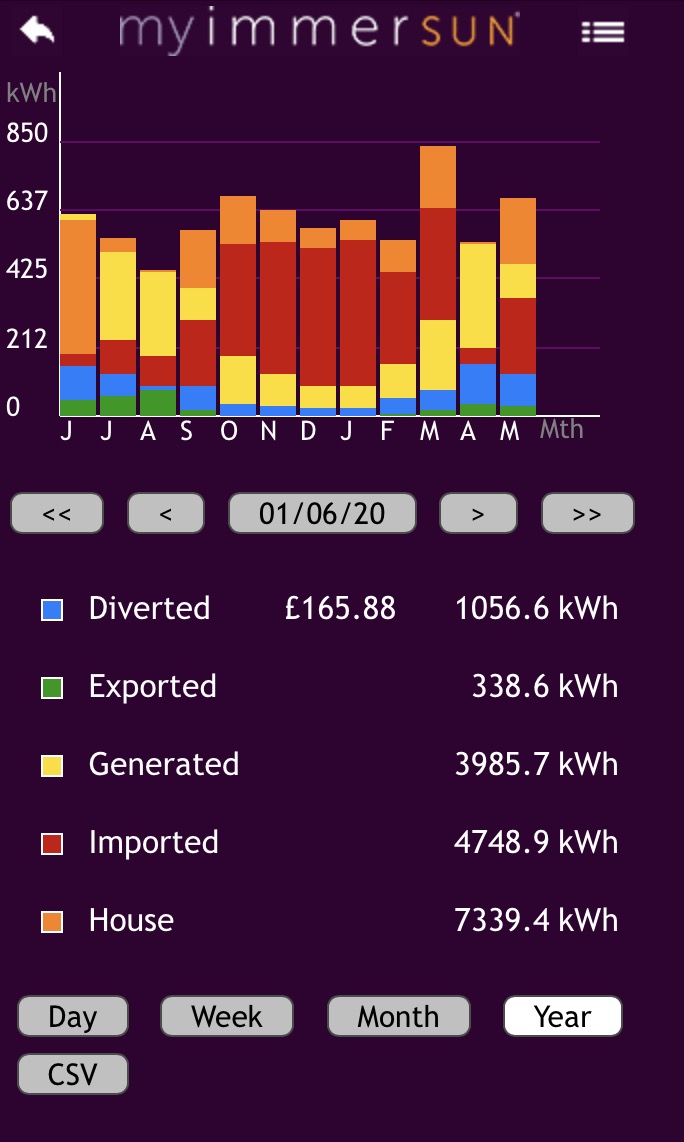
ImmerSUN monitoring – June 2020 to May 2021
Diverted – this is where the immersun sends any surplus solar electricity to my immersion heater to make hot water. In 2020/1 we diverted 1056.6 kWh to hot water saving gas at 2.82 p/kWh. However the gas boiler isn’t 100% efficient losing heat both via the flue to the outside world and also via the hot water pipes to the home rather than hot water. If we assume 80% efficiency at the tank then 2.82 p/kWh as gas at the boiler is 4 p/kWh as heat in the tank. 1056.6 kWh at 4 p/kWh saved £37.25.
Exported – this is where I’m unable to use the solar power that we generate and it overflows into the grid. I’m not paid for Export so this is worth nothing to me.
Generation – this is the energy that we generate in the solar panels. I’m on the UK’s legacy Feed-in Tariff (FiT) scheme which pays me to generate electricity. In 2020/1 I was paid 14.65 explicitly for every kWh that I generated. I also received deemed (rather than metered) Export which paid 5.5 p/kWh on 50% of the kWh that I generated (which is where the ‘deemed’ part comes from). 5.5 p/kWh on 50% is equivalent to 2.75 p/kWh on 100% of the Generation making my revenue 17.4 p/kWh per kWh generated or £693.51 on the 3985.7 kWh that I actually generated.
Imported and House – these are respectively the electricity that I buy from the grid and that which I used within the home including appliances and car charging, some of which will comes from my own solar panels. The difference between House and Imported is the electricity that I used from my solar panels which would otherwise have been bought from the grid. If I assume that each kWh that I use from my solar panels avoids buying a kWh of electricity from the grid at 16.36 p/kWh (current Energy Saving Trust value for the average UK electricity price) then I avoided buying £423.81 of electricity by using the output of my solar panels.
Diverted
1056.5 kWh
*
£0.04
=
£37.25
Exported
338.6 kWh
*
£0.00
=
£0.00
Generated
3985.6 kWh
*
£0.17
=
£693.51
Imported
4748.9 kWh
*
-£0.16
=
-£776.92
House
7339.4 kWh
*
£0.16
=
£1,200.73
Total
£1,154.56
Return on smart energy investment @ 16.36 p/kWh grid price
With an investment of £8,670, £1,154 represents 7.5 years to pay back the capital invested.
I’m actually on a smart tariff so my electricity cost in this period at 8.05 p/kWh was significantly less than the UK’s average 16.36 p/kWh. This lower price will arguably reduce the value of the energy generated by the solar panels for self-consumption, but equally the ability to maximize the value of a smart tariff is itself a saving.
Diverted
1056.5 kWh
*
£0.04
=
£37.25
Exported
338.6 kWh
*
£0.00
=
£0.00
Generated
3985.6 kWh
*
£0.17
=
£693.51
Imported
4748.9 kWh
*
-£0.08
=
-£382.29
House
7339.4 kWh
*
£0.08
=
£590.82
Total
£939.29
Return on smart energy investment @ 8.05 p/kWh grid price (excluding the tariff benefit itself)
Using my actual average energy price rather than the higher UK average grid price pushes down the return by over £200 (£929.29 versus £1,154.56). However the costs of buying the imported 4,748.9 kWh falls by £394.63 through the tariff benefit, increasing the annual return to £1,333.93, and reducing the payback period from 7.5 to 6.5 years.
Thus, had I invested in this technology at one time back five and a half years ago and shortly after we moved to this house, then we’d have been in sight of payback with 1 or 2 years left. In practice of course I’ve made the investments at different times (solar first five and half years ago, battery around a year later, smart tariff later still), so my payback will be achieved a little later.
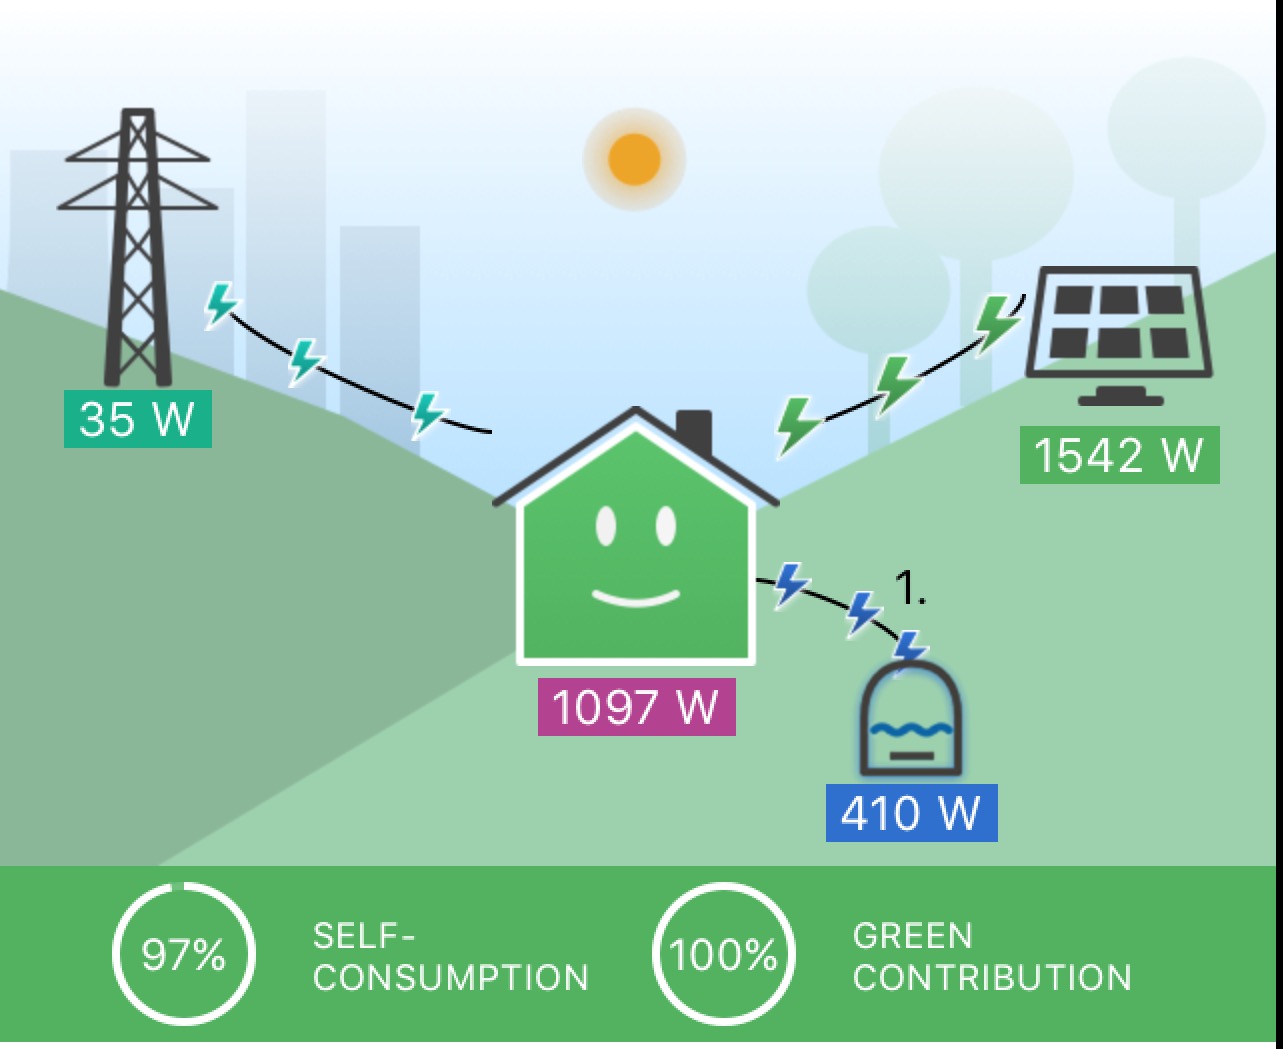
A snapshot of the ImmerSUN diverting to hot water
Some other statistics:
Of solar panel output:
91.5% replaced bought energy (self-consumption)
65.0% replaced bought electricity
26.5% replaced bought gas for water heating
8.5% was exported to the grid
Of incoming electricity:
54.4% was from the grid
45.6% was from the solar panels (“green contribution” in ImmerSUN’s terminology)
It’s now around four and half years since I bought my Powervault G200 storage battery and two years since I started managing it from my Home Energy Management System (HEMS).
Powervault storage
Smart controls – HEMS and immersun.
Originally the Powervault set up simply to store surplus electricity from my solar panels for later use but, following my change to Octopus’ Agile tariff, I started to use the Powervault to optimize electricity costs when there wasn’t going to be enough solar, charging when electricity was relatively cheap and discharging when electricity was relatively expensive. Initially I configured the Powervault manually to achieve this but later moved to the HEMS doing it automatically.
Configuring the Powervault manually
Configuring the Powervault via the HEMS
The fundamental principle has remained the same through both manual and automated periods, with the battery being set into one of three modes depending on price:
Force charge – where the battery charges at full power (usually from the grid) for the required number of hours – when grid electricity price is cheapest.
Only charge – when the battery charges proportionally to the solar surplus (but will not discharge) – when grid electricity is mid-price (i.e. too close to the price at which the battery was being force charged to be economically advantageous to discharge)
Normal – when the battery charges or discharges proportionately to the solar surplus/shortfall – when grid electricity is comparatively expensive compared to the force charge price.
Battery operating mode for different conditions
The current logic now reflects electricity price, time of day and state of charge. The fundamental relationship is with grid electricity price as previously described, but with two further refinements:
During the day, even when the electricity price is relatively high, the battery is held in charge only until 80% state of charge is obtained. This helps ensure that a high state of charge is obtained before the early evening peak in Agile prices from 4 to 7 PM by not allowing the battery to discharge while the expectation is that it is being charged from solar. In the depths of winter, when the battery is more likely to be charged overnight and thus start the day with a high state of charge, the same logic allows the battery to discharge to 80% if electricity is costly during the day but still preserves charge for the early evening peak.
Similarly if the battery is full, but the grid price is medium, then the battery is also allowed to discharge to 95% during the day. This allows the battery to discharge slightly to cover small peaks of demand on the assumption that a small amount of solar recharge may well be possible even if the solar forecast wasn’t high enough for recharging at full power.
To consider the two bookends of behaviour:
On a really sunny day like tomorrow, the HEMS doesn’t anticipate any need to buy electricity from the grid for battery charging so all electricity is relatively expensive. The HEMS will allow the battery to discharge overnight (completely if necessary) . From 8:00 AM the battery will only be allowed to charge until 80% state of charge or 4:00 PM is reached after which the battery will be put back in Normal operation when it has the freedom to either charge or discharge.
On a winters day, the HEMS potentially fully charges the battery overnight. Between 8:00 AM and 4:00 PM the battery is allowed to discharge to 95% if grid electricity is mid-price (with some hope that the 5% may be recovered from solar), or to 80% if grid electricity is high price. After 4:00 PM the battery reverts to Normal operation for the evening peak period.
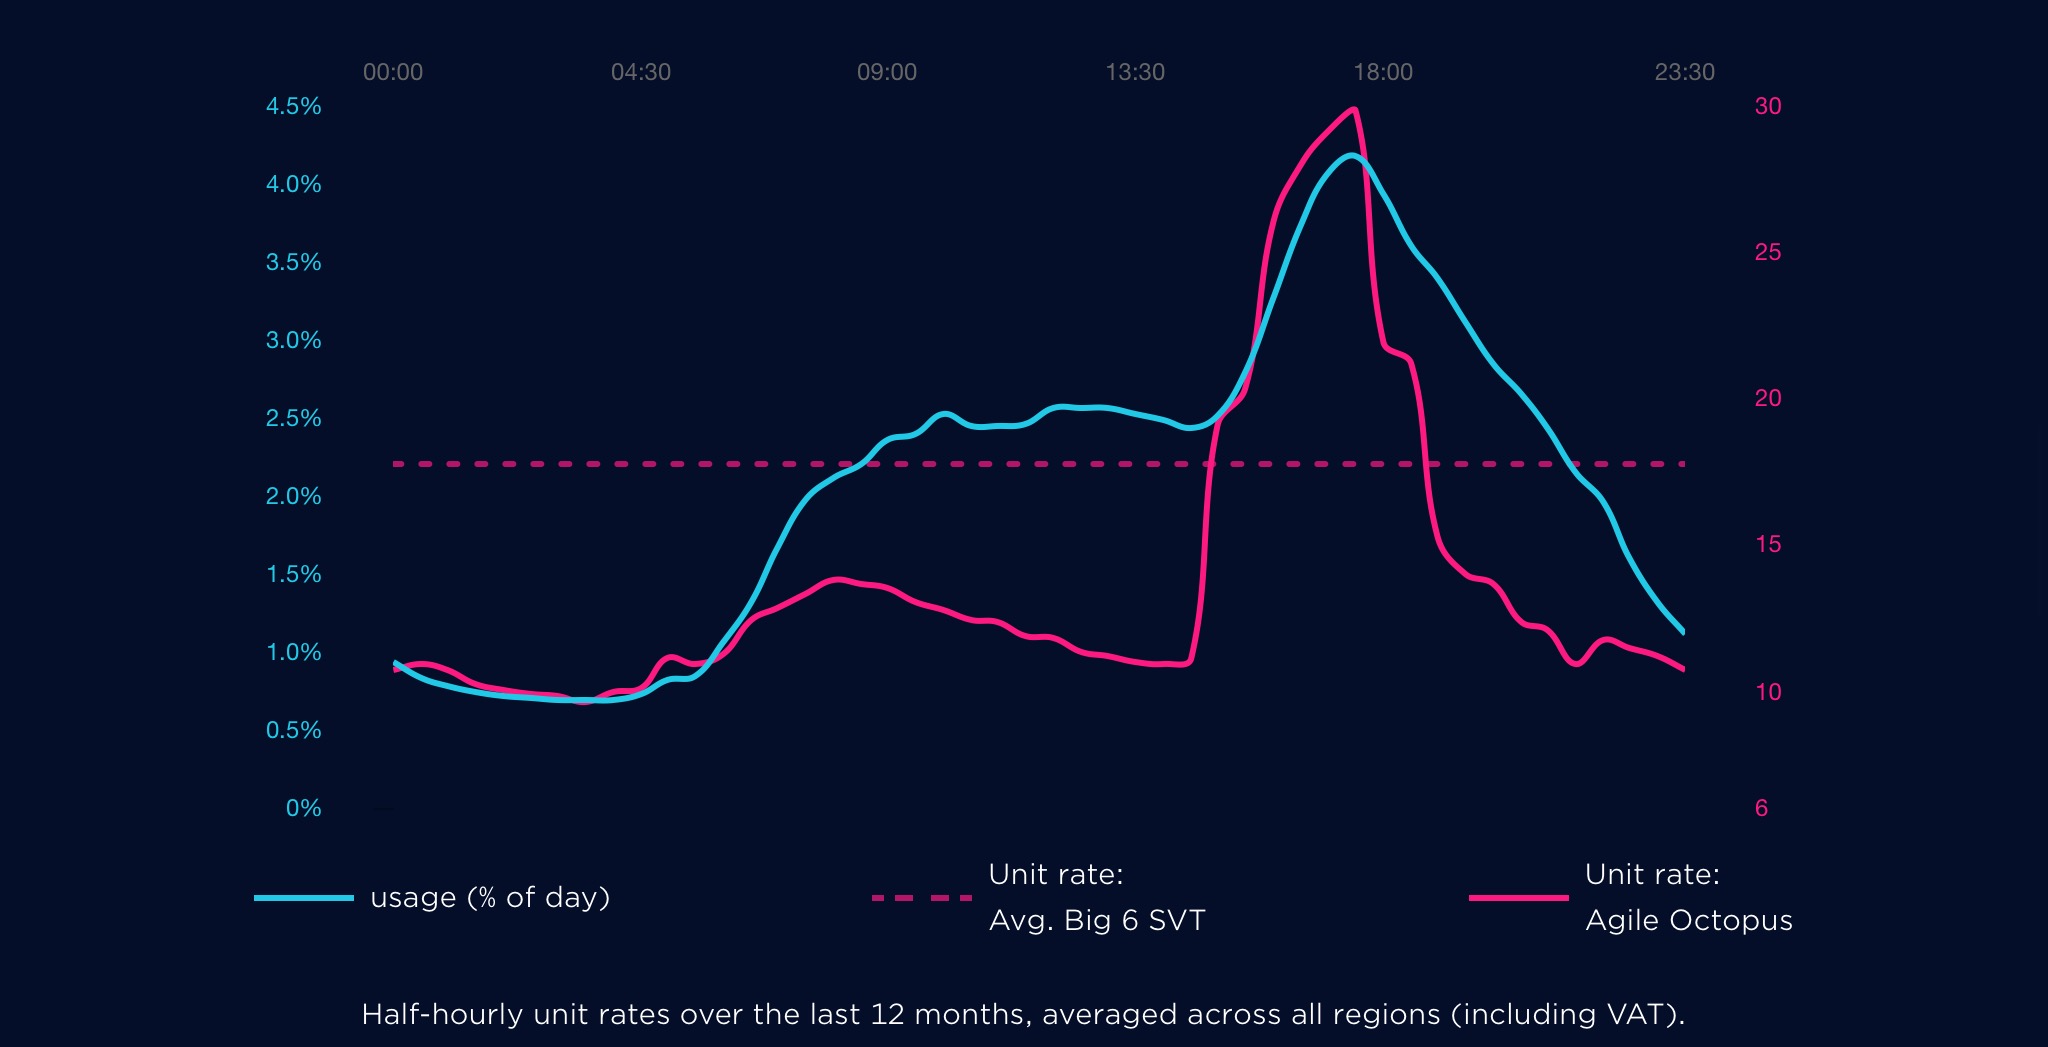
Example Agile prices with typical UK domestic consumption.
I’m very pleased with how robustly my battery integration operates. It is however reliant on the continuing availability of the Powervault G200 cloud which may not be around forever as the G200 model has now been superseded. My own example is currently four and a half years old.
Main electricity supply cutout with current clamp above
As previously noted, I recently had the main supply cut-out to my house uprated from 60 to 100 Amps in preparation for installation of an additional electric vehicle charger. That involved my Distribution Network Operator (DNO) replacing the fuse within the black fuse holder with the torn red label above and replacing the brown live and blue neutral cables between the cutout and the electricity meter to the top right of the picture. In my case the technicians involved automatically moved the black current clamp that sits above the cutout from the old live cable to the new one without even mentioning it, but it did occur to me that it would be worth documenting what current clamps I have, what they do and where they are for the benefit of any future trades who may not replace like-for-like.
I have two devices that currently use three current clamps between them:
Immersun. Has two current clamps, one for control and one for solar generation data only.
Immersun control clamp is around the main live feed between cutout and meter as pictured above and illustrated below. It measures any flow of electricity to the grid and prompts the Immersun to divert this to water heating or car charging.
Immersun generation clamp is around the main live feed between the inverter for the solar panels and consumer unit and specifically inside the rotary isolator on this cable (being a good location where the live alone can be encircled without the neutral).
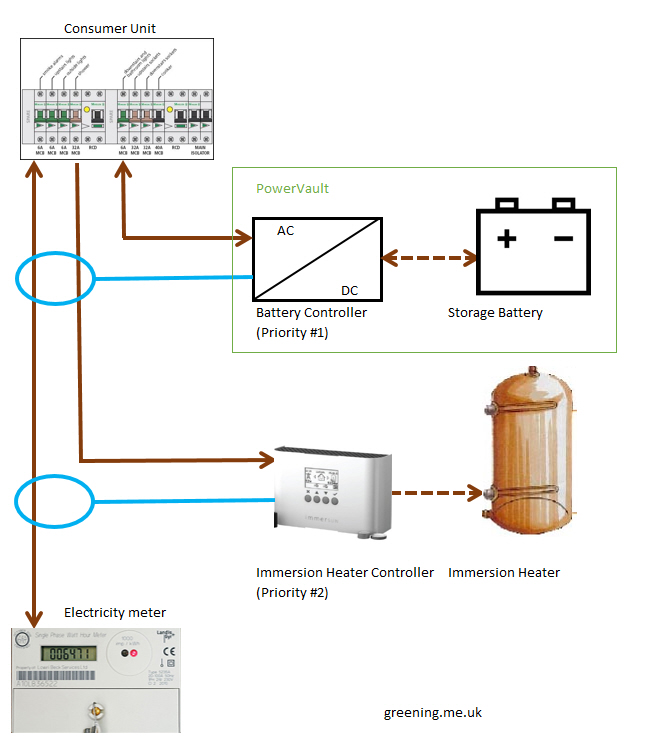
Powervault battery. Has 1 current clamp inside the consumer unit which encircles both the incoming live and the live feed to the immersion heater. These two cables are orientated such that flow from the solar panels to the grid or to the immersion heater passes in the same direction through the clamp as illustrated below. (This is unorthodox and not what the installation manual describes, but is done to force the priority of the battery over the immersun when a solar surplus is available)
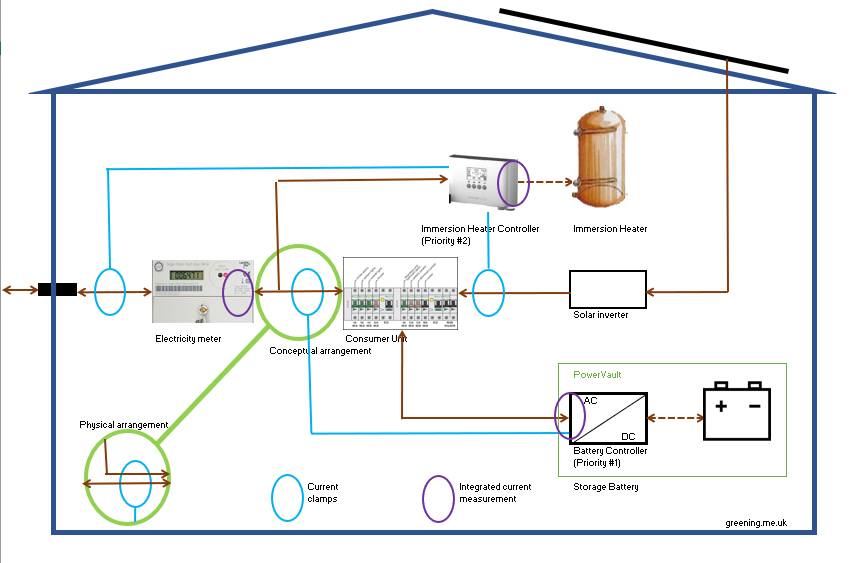
Positions of 2 of 3 current clamps.
There were previously three additional current clamps which were used by UK Power Networks (UKPN) my local DNO who part-funded my battery storage four years ago as part of a trial. Some of these clamps may still be present as I can still see some of the associated cables, but are no longer actively used as the associated data loggers are long gone. These clamps monitored: grid in/out (duplicates 1.1 above), battery in/out (duplicates battery’s own internal measurements), and solar panel in/out (duplicates 1.2 above).
DNOs tend to be concerned about excessive exports to local electricity grids which can cause voltage quality issues. Any export from a battery could add to any export from solar panels and could cause the DNOs preferred export limit to be exceeded. Given that the battery, as installed to the manufacturer’s advice, would measure the total export then it would be possible software within a battery to limit battery export such that the sum of battery plus solar export never exceeded the DNO’s recommended value. In practice the gross output of a 4 kWp solar array rarely exceeds the 16 Amp export limit even before the load of the home is subtracted to achieve the export from the home, so in many battery + solar installations there’s little prospect of the limit ever being exceeded even without such software limits.
The question that recently occurred to me is whether if a battery had such a software limit would that limit be defeated by my unorthodox installation of the battery’s current clamp?
Conceptual arrangement of clamps
My physical arrangement on the battery clamp encircling both the feed to the consumer unit and the cable to the immersion heater is equivalent to feeding the immersion heater from a connection between the meter and the consumer unit and having the clamp between that connection and the consumer unit. As such the battery clamp may read higher than the actual export since some of the power from the solar panels that is measured by the clamp may be diverted to the immersion heater without actually being exported. Thus, if the battery has a software function to limit to export, an arrangement like mine will cause the export limit to operate more aggressively than design intent and the DNO’s export recommendation will not be exceeded. Once the water is hot, and no further diversion occurs, then a battery clamp positioned like mine will record the same current as the meter and the Immersun’s clamp. Since I regard export as an error state then such a more aggressive limit on export is of no consequence to me.
Regular readers will know that my Energy Smart home includes a storage battery. That battery is either charged from my solar panels (effectively free electricity), or low cost electricity bought from the grid, or some combination of the two depending on the solar forecast for the day ahead.
Powervault storage
Solar forecast
The logic of how much battery charging is required has until now been driven by a set value for the number of charging hours required. The number of hours of solar charging predicted is deducted from the the number of charging hours required to calculate the number of bought charging hours required outside the solar production window.
Bought charging hours required :=
Total hours required – Solar hours predicted
However with experience this appears to be a sub-optimal arrangement. At one extreme on a very sunny day the battery will fully charge and then be allowed to discharge continuously through all other hours, there is no middle ground in which the battery is not permitted to discharge through the night. However at the other extreme if the battery is replenished entirely from the grid then there will be hours when discharge is not permitted since, after accounting for cycle efficiency, the value of the electricity in the battery is higher than the cost of that from the grid and thus it’s better value to use grid electricity than stored electricity. As there are fewer discharging hours then fewer hours of charging will be required to refill. Thus the depth of discharge is greater when charged from solar than from the grid requiring more charging hours to refill. Leaving the longer charge time for a full charge in use then creates a risk of charging the battery when the grid price is higher than necessary leaving the battery possibly full by the time the lowest cost grid energy is available. Having a more accurate target for the charge time would enable the lowest cost charging periods to be selected more precisely.
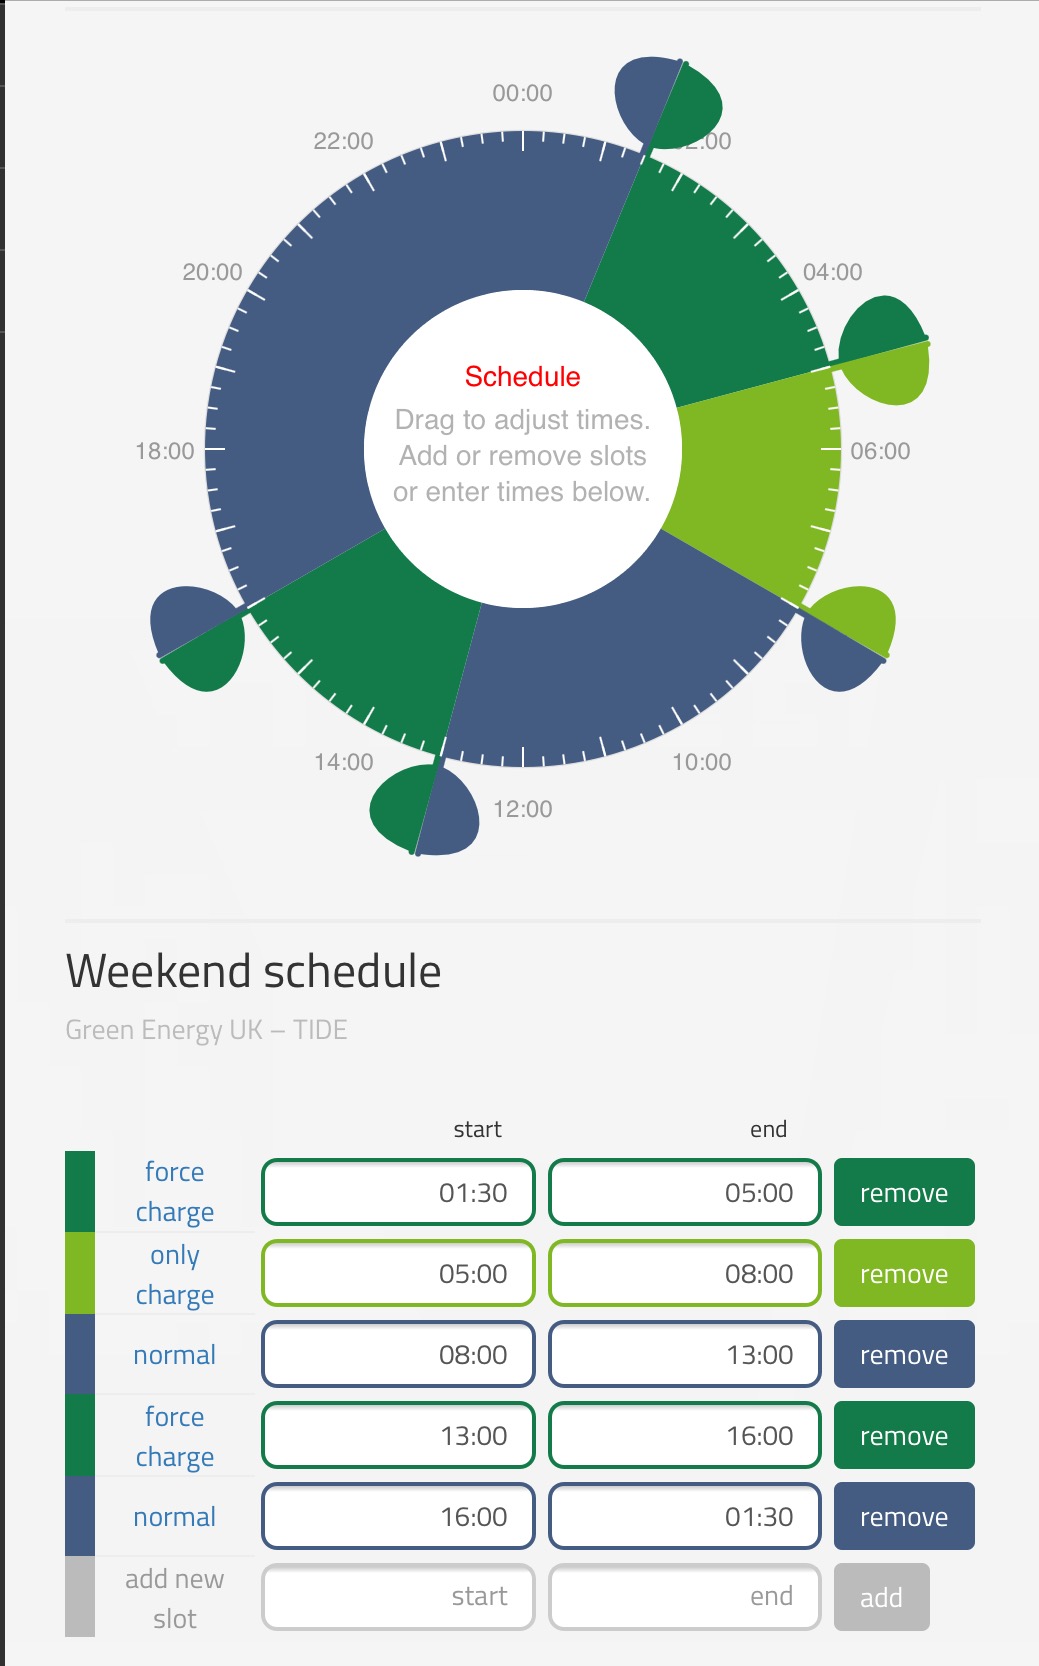
Schedule with some solar
The new refinement is to automatically adjust the bought charging hours between two existing user-defined values: the existing target hours and the maximum charging hours currently used just to cap charging hours during plunge pricing events (i.e those with negative cost events). The new algorithm can adjust to any value between the two limits in half hour intervals. As currently configured that’s anything between five and seven hours. The new algorithm is:
Total hours required := minimum (Maximum hours from plunge, maximum (Target hours, Solar hours predicted + 1))
Most of us are used to a simple world of electricity where we pay for what we consume. For most folks like myself based in the UK that’s typically a fixed price per kWh/unit consumed regardless of time of day, even through dual-rate tariffs have been around for decades – the best known being “Economy 7” tariffs. However as the grid gets smarter then there are increasing opportunities to save on, or make money from, electricity.
Electricity opportunities for import / export and positive /negative cost.
Conventional – pay for power.
This is the area with which most of us are most familiar. We all get the idea of paying for the power we consume. Most UK households pay a fixed price per kWh/unit regardless of the time of day. We have a competitive electricity market, so there are the choice of 70 to 80 different providers who will make different offers regarding standing charge (sometimes marketed as a subscription) and unit cost.
There’s also the opportunity to choose between a flat rate tariff or Economy 7 even on conventional meters that provide a discounted night rate for 7 hours.. These typically provide a discounted night rate, but may charge a little more during the day. They used to advertise these as ‘less than half-price electricity’ but that’s often not the case now.
Stepping up in complexity (and opportunity) smart meters provide the opportunity for a more diverse range of tariffs including different cheap night time periods, more than two rates at different times of day (in extreme 48 half-hourly rates), and a free day at the weekend (i.e. a zero rate of a weekend day) etc.
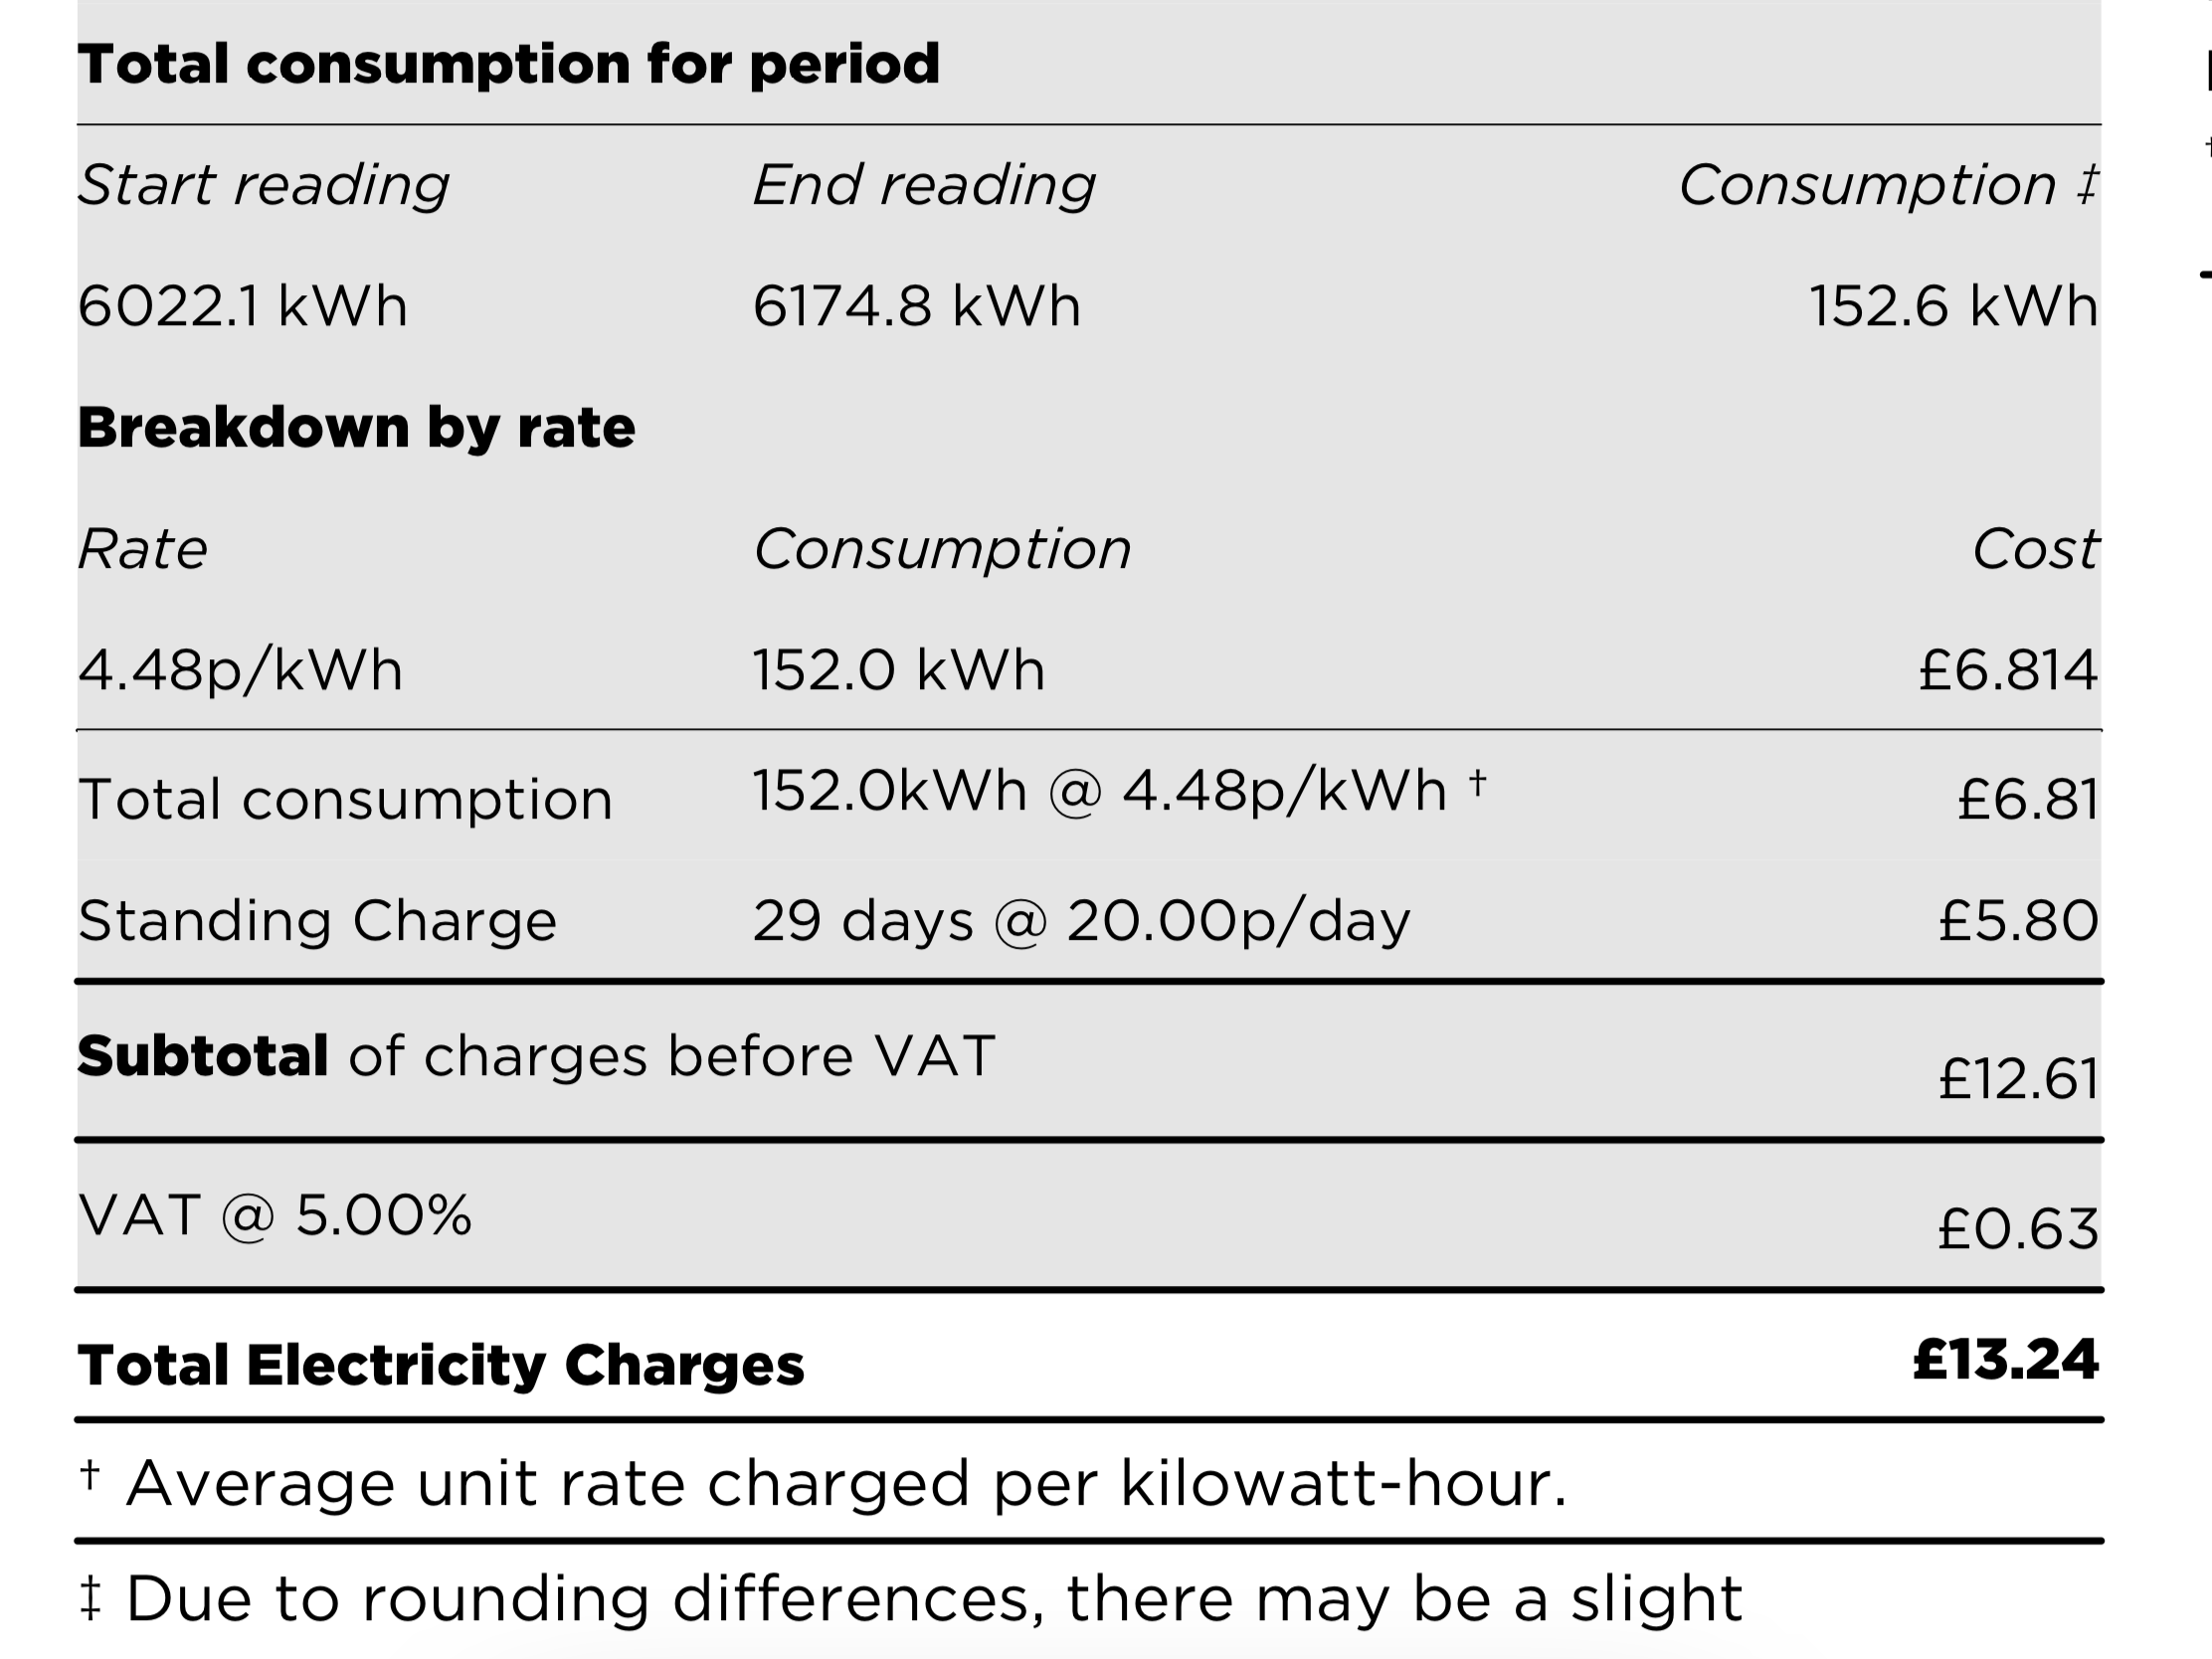
Beyond that my own tariff (Octopus Agile) not only has up to 48 different half-hourly prices/day that change daily based on that day’s market prices. That might sounds a bit scary but it can yield very cheap electricity prices – 4.48 p/kWh for me in April/May 2020 (for example) which is a third of what most people pay.
My electricity costs April/May 2020
(The original version of this post wrongly had the table from my gas bill above and mistakenly claimed that I had paid “a quarter of what most people pay” rather than a third. Total consumption is untypically low at the present time due to limited miles driven.)
Agile – paid to consume
Top left on my initial diagram is Agile – paid to consume.
One of the features of the wholesale electricity market is that at times the market price for electricity goes negative. At such times the a significant excess of supply (typically because of high output from wind turbines) over demand (often but not always at night) yields a negative price so electricity companies looking to buy electricity are being paid to take it. Most electricity companies will continue to charge their customers the standard price in these circumstances but, with the octopus Agile tariff, the negative pricing is passed to the consumer so that you are paid to consume electricity. This is one of the reasons that my electricity costs are so low.
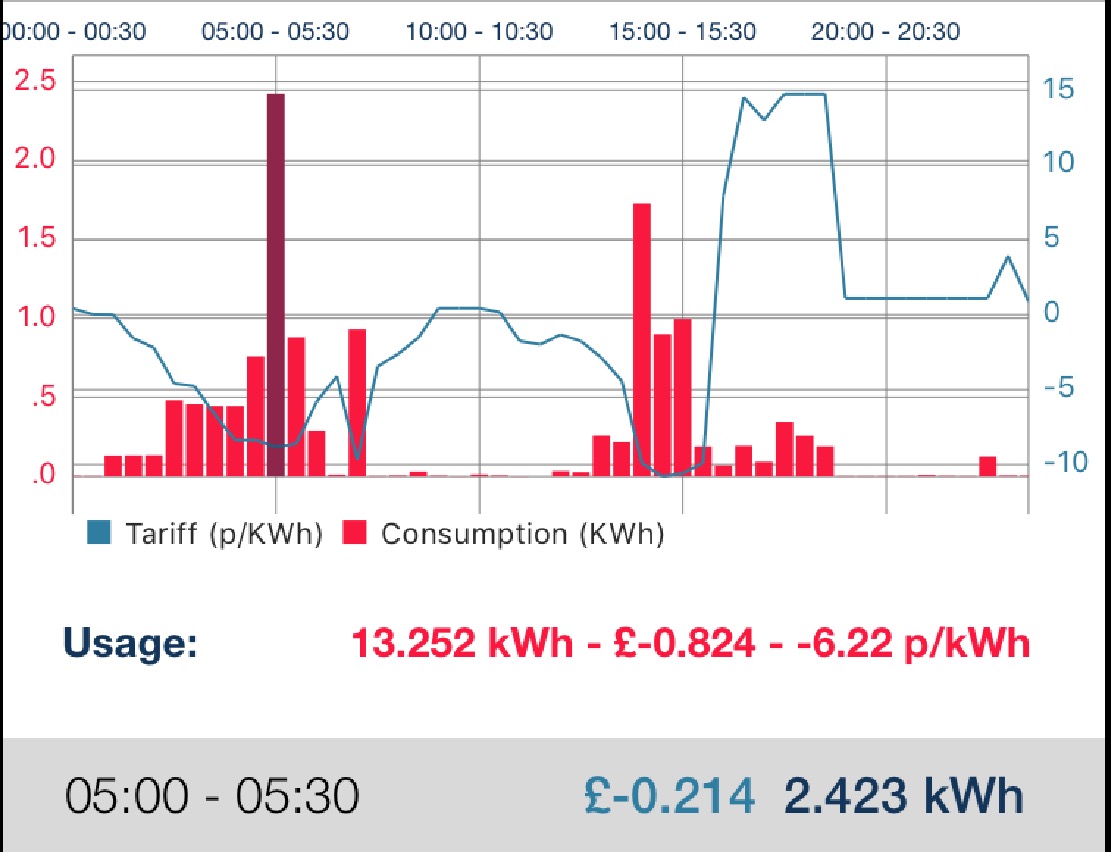
My electricity costs – Saturday 23rd May 2020
The above chart shows my electricity costs for Saturday 23rd May 2020. The blue line shows the half-hourly electricity price varying between minus 10 p/kWh and plus 15 p/kWh. The red bars show my electricity consumption in each half hour. You can see how consumption tends to be highest when the price is lowest leading to an average price paid of minus 6.22 p.kWh (i.e. they paid me to use electricity) – indeed they paid me 82.4 p to buy electricity that day.
Conventional export – paid to export
The next opportunity to make money from electricity is to sell it to the grid. Obviously that depends on having a source for the electricity typically a generating asset like solar panels or a wind turbine, possibly coupled with a storage device like a battery. It’s also possible with a battery alone, but I know no-one who does that as the economics are more challenging.
The UK currently has a scheme called Smart Export Guarantee (SEG) where you can sell your export to an electricity company. Prices vary enormously so it’s worth shopping around and not just assuming that your electricity company will give you a good offer.
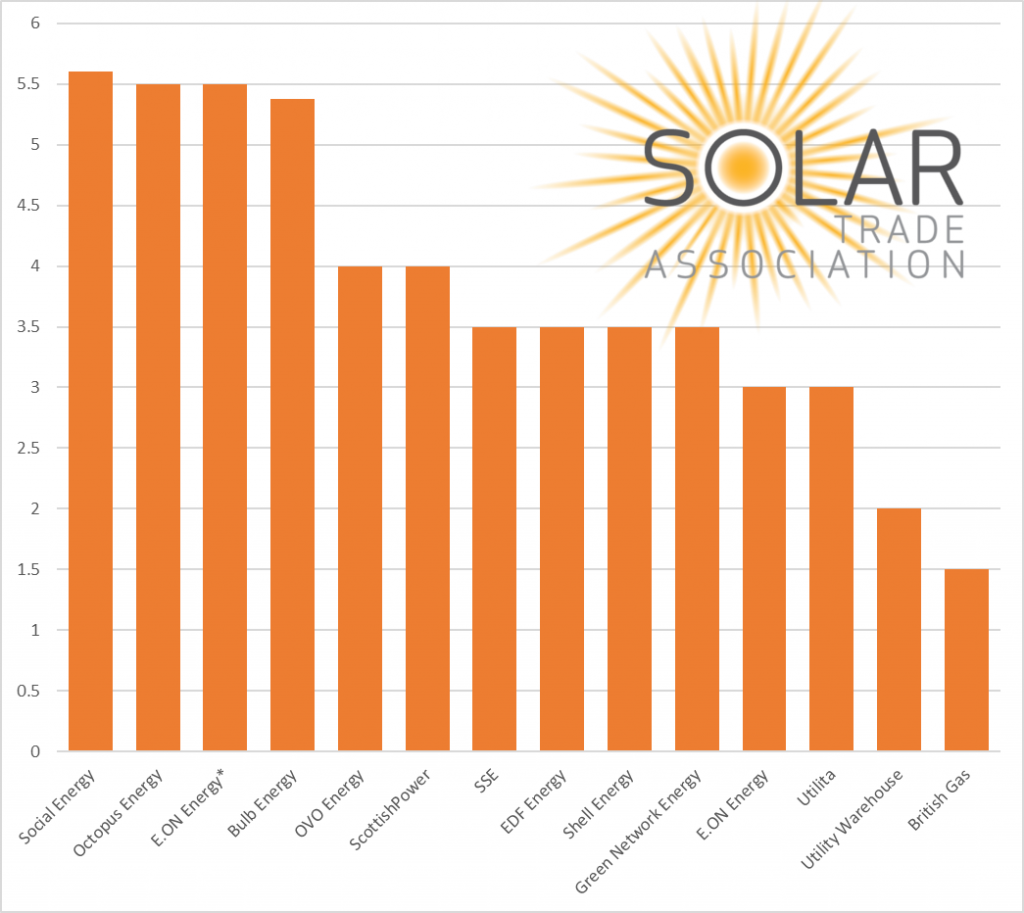
SEG rates from the Solar Trade Association
There is also a smarter SEG option where Octopus offer a dynamic SEG based on market rates (Octopus Agile Export) which may at times offer a high rate, but also offers a lower rate at times, and is thus perhaps better suited to those with storage.
I myself am NOT on such a tariff as I’m on an older legacy Feed-in Tariff (FiT). Despite its name FiT is a generation incentive, not an export incentive. As a generation incentive FiT encourages self-consumption since each kWh that I consume myself does not reduce my income, whereas on SEG each kWh that I use myself (such as making hot water) would reduce export income. So, for example, if I use a kWh of electricity to make hot water that’s saved a kWh (or thereabouts) of gas at around 3 p/kWh, but if I was on SEG then I might have lost 5.5 p/kWh of export revenue to save 3 p/kWh on gas which is clearly an on-cost not a saving. There are other benefits of course because I’ve reduced my carbon footprint by using my own low CO2 electricity to replace a fossil fuel, but it’s not (in this case) improving my financial position.
A further area of research by others is V2X (V2H and V2G) – taking electricity stored in an electric vehicle and using that within the home (V2H) or exporting it to the grid (V2G).
Export penalty – penalised for export
A logical consequence of this smart grid that I’ve outlined is being penalised for export. If there are times when the market price for electricity is negative then if I were part of that market then I might expect to be penalised for export. This doesn’t actually exist in the UK, as the only model that links SEG payments to the market price, Octopus Agile Export, protects its customers from negative pricing.
Should consumers be exposed to this risk then a logical behaviours would be:
To manage self-consumption into the negative export periods, and potentially thus increase export in the positive export periods. For example disable diversion to an immersion heater or car when export price is positive, and then maximise self-consumption when the export price (and presumably the import price also) is negative.
To disable the generating asset to avoid the export penalty.
Conclusions
Some people like myself will find developments in the smart energy sector a fascinating and engaging topic with opportunities both the save money and engage in creating a cleaner and greener electricity system.
However given that many choose not to even participate in the competitive market for electricity supply created when the regional electricity companies were privatised in late 1990 (i.e. 30 years ago) then there will be a significant number who are not so motivated.
This then creates opportunity for a wider variety of smart offers. Some products, at the Agile Octopus end of the spectrum, giving the consumer the opportunity to benefit from their own decision making, while others look more like a traditional dumb tariff with a very simple price structure but potentially making the energy company a more active manager of the home appliances so that the consumer hopefully plays a lower unit rate while the energy company takes responsibility for managing the assets within the home.
CO2 production is increasingly of interest as the world struggles to limit man-made climate change. As we use different energy sources each represents a certainly amount of CO2 reflecting a combination of the energy invested to create that power source (e.g. the wind turbine may generate wholly renewable power, but its construction created some CO2) and the CO2 created as it generates energy once constructed (nothing for renewables but relatively high for fossil-fuelled generation).
I’ve previously shared this table showing the IPCC’s view of the embedded CO2 in different sources of electricity generation.
IPCC’s view of embedded CO2 in different sources of electricity generation
A recent question and resulting discussion in an on-line forum prompted me to think more about the area of embedded CO2.
My first observation would be that my rooftop solar panels do quite well on this scale with a CO2 figure of 41 gCO2/kWh.
The second observation would be regarding energy storage. My view would be that any energy storage device from a small scale domestic battery like my own to a large pump storage scheme can never deliver better embedded CO2 that the source of its energy. So, for example, if I charge my battery from my own solar at 41 gCO2/kWh with a cycle efficiency of 80% (the maker’s claim) then the embedded CO2 in the energy coming out of the battery cannot be better than 41 gCO2/kWh / 80% = 51 gCO2/kWh. Indeed it would be worse than that as this doesn’t account for the CO2 generated in creating the battery nor its operational life, but I don’t have figures for those.
Example of UK grid CO2 intensity
Thirdly, as my own embedded CO2 is relatively low whether exported directly from my panels or indirectly via the storage battery, then the CO2 intensity of the grid always benefits from my export. The 116 gCO2/kWh illustrated above is pretty low for the UK grid which varies widely but is still more than my solar PV directly or stored solar PV. Indeed had I exported onto the grid at the time illustrated above then my 41 gCO2/kWh versus the grid’s 116 gCO2/kWh would have saved 75 gCO2 for each kWh that I exported.
However if, for example, I export electricity but need to then buy more gas to make hot water then that too has a CO2 impact.
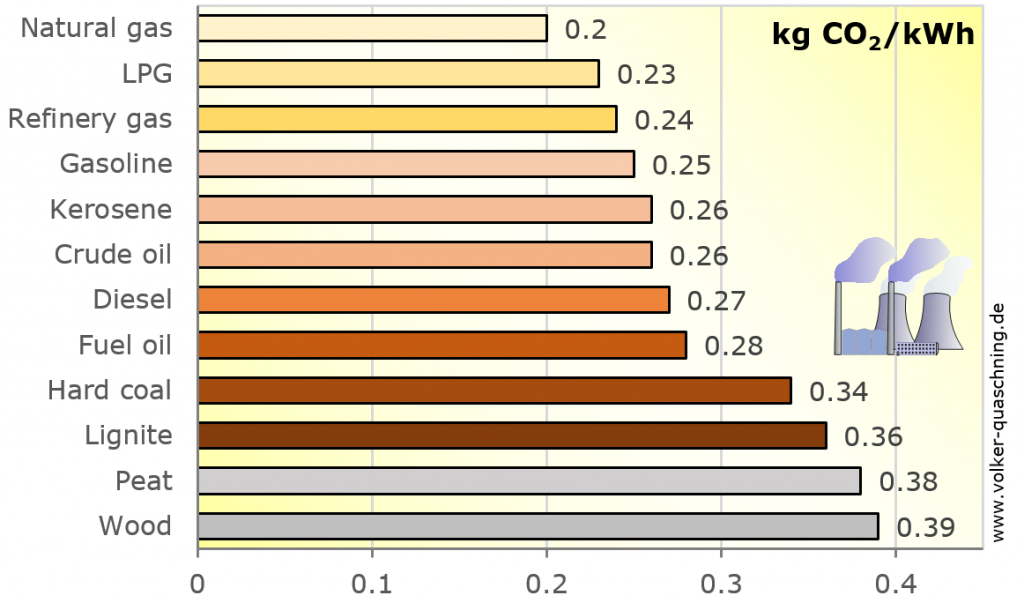
If I need to buy a kWh of gas to make hot water that’s 0.2 kgCO2/kWh or 200 gCO2/kWh even before I’ve accounted for the relative inefficiency of the gas boiler versus my electric immersion heater. If I assume that the gas boiler is 90% efficient then I will be responsible for 200 gCO2/kWh / 90% = 222 gCO2/kWh for a kWh used to make hot water. Thus, while exporting 1 kWh of solar PV may save the electricity grid 75 gCO2/kWh, it’s added 222 gCO2/kWh to gas consumption – a net deterioration of 147 gCO2/kWh.
Natural gas of course is the lowest CO2 of the fossil fuels listed above – if your home is heated by oil, coal or wood then the analysis is further skewed towards using your own self-generated power rather than exporting electricity and importing another fuel for heating.
The electricity grid’s carbon intensity also varies. In 2019 the UK average was 256 gCO2/kWh (a little higher than my estimate for gas) however this varies considerably through the year with the highest embedded CO2 in early winter evenings when I have little if any solar PV to contribute to the grid, and may well be lowest when I and others have surplus solar PV. My understanding is that the lowest grid CO2 occurs with a combination of high renewables (such as particularly windy weather) coupled with low demand (such as summer nights).
Thus my own strategy is to:
Maximise self-consumption of my own solar PV as my energy source with the lowest embedded CO2 (except in the event of an extreme plunge pricing event when the grid is under highest stress)
Make best use of storage to minimise consumption from the grid in the evening peaks when embedded CO2 is likely to be highest.
When a solar-shortfall is anticipated then buy electricity selectively from the grid at lowest CO2 (using Agile electricity price as a surrogate for CO2).