Category Archives: Smart meter and tariffs

Home networks

A recent move to full fibre broadband prompted a reconfiguration of my home network as the incoming cable moved to the opposite side of the house from where the incoming telephone line had been. That’s not a normal situation but it turns out that my home had previously had two telephone lines in different places, but the cable that got upgraded to fibre was not the cable that had been in use in recent time. I’ve also had further additions which prompted the idea to create a diagram of how all the devices are connected.

Home networks

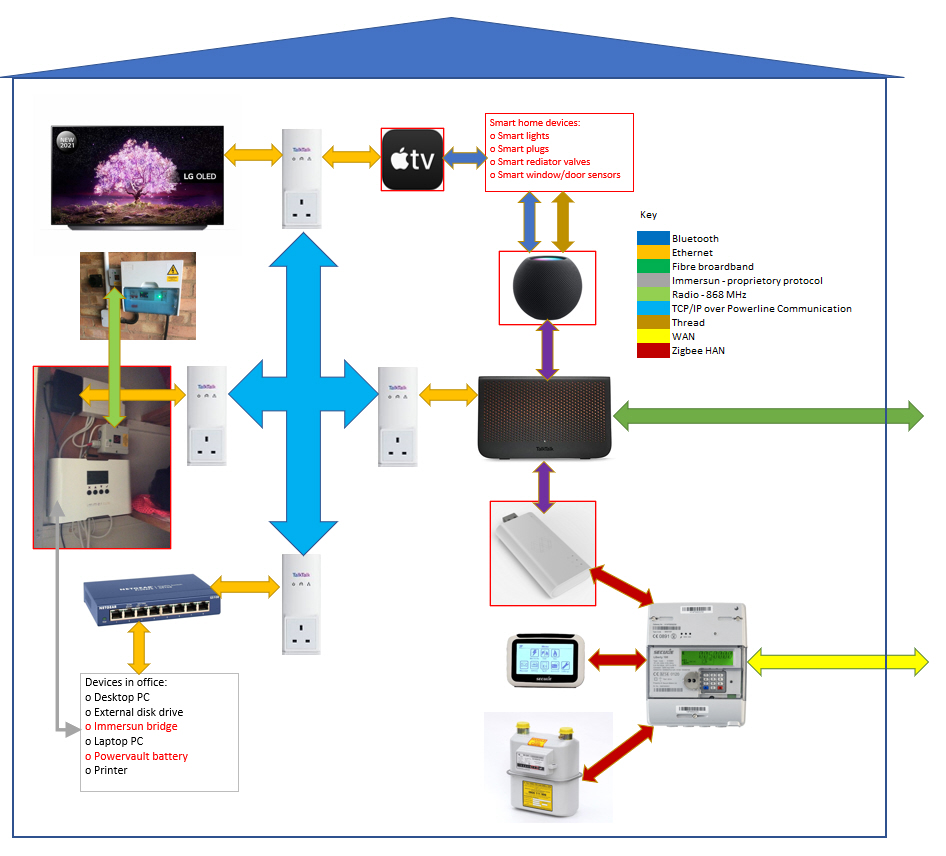
I was somewhat surprised to count as many as nine protocols/networks in use between different devices.

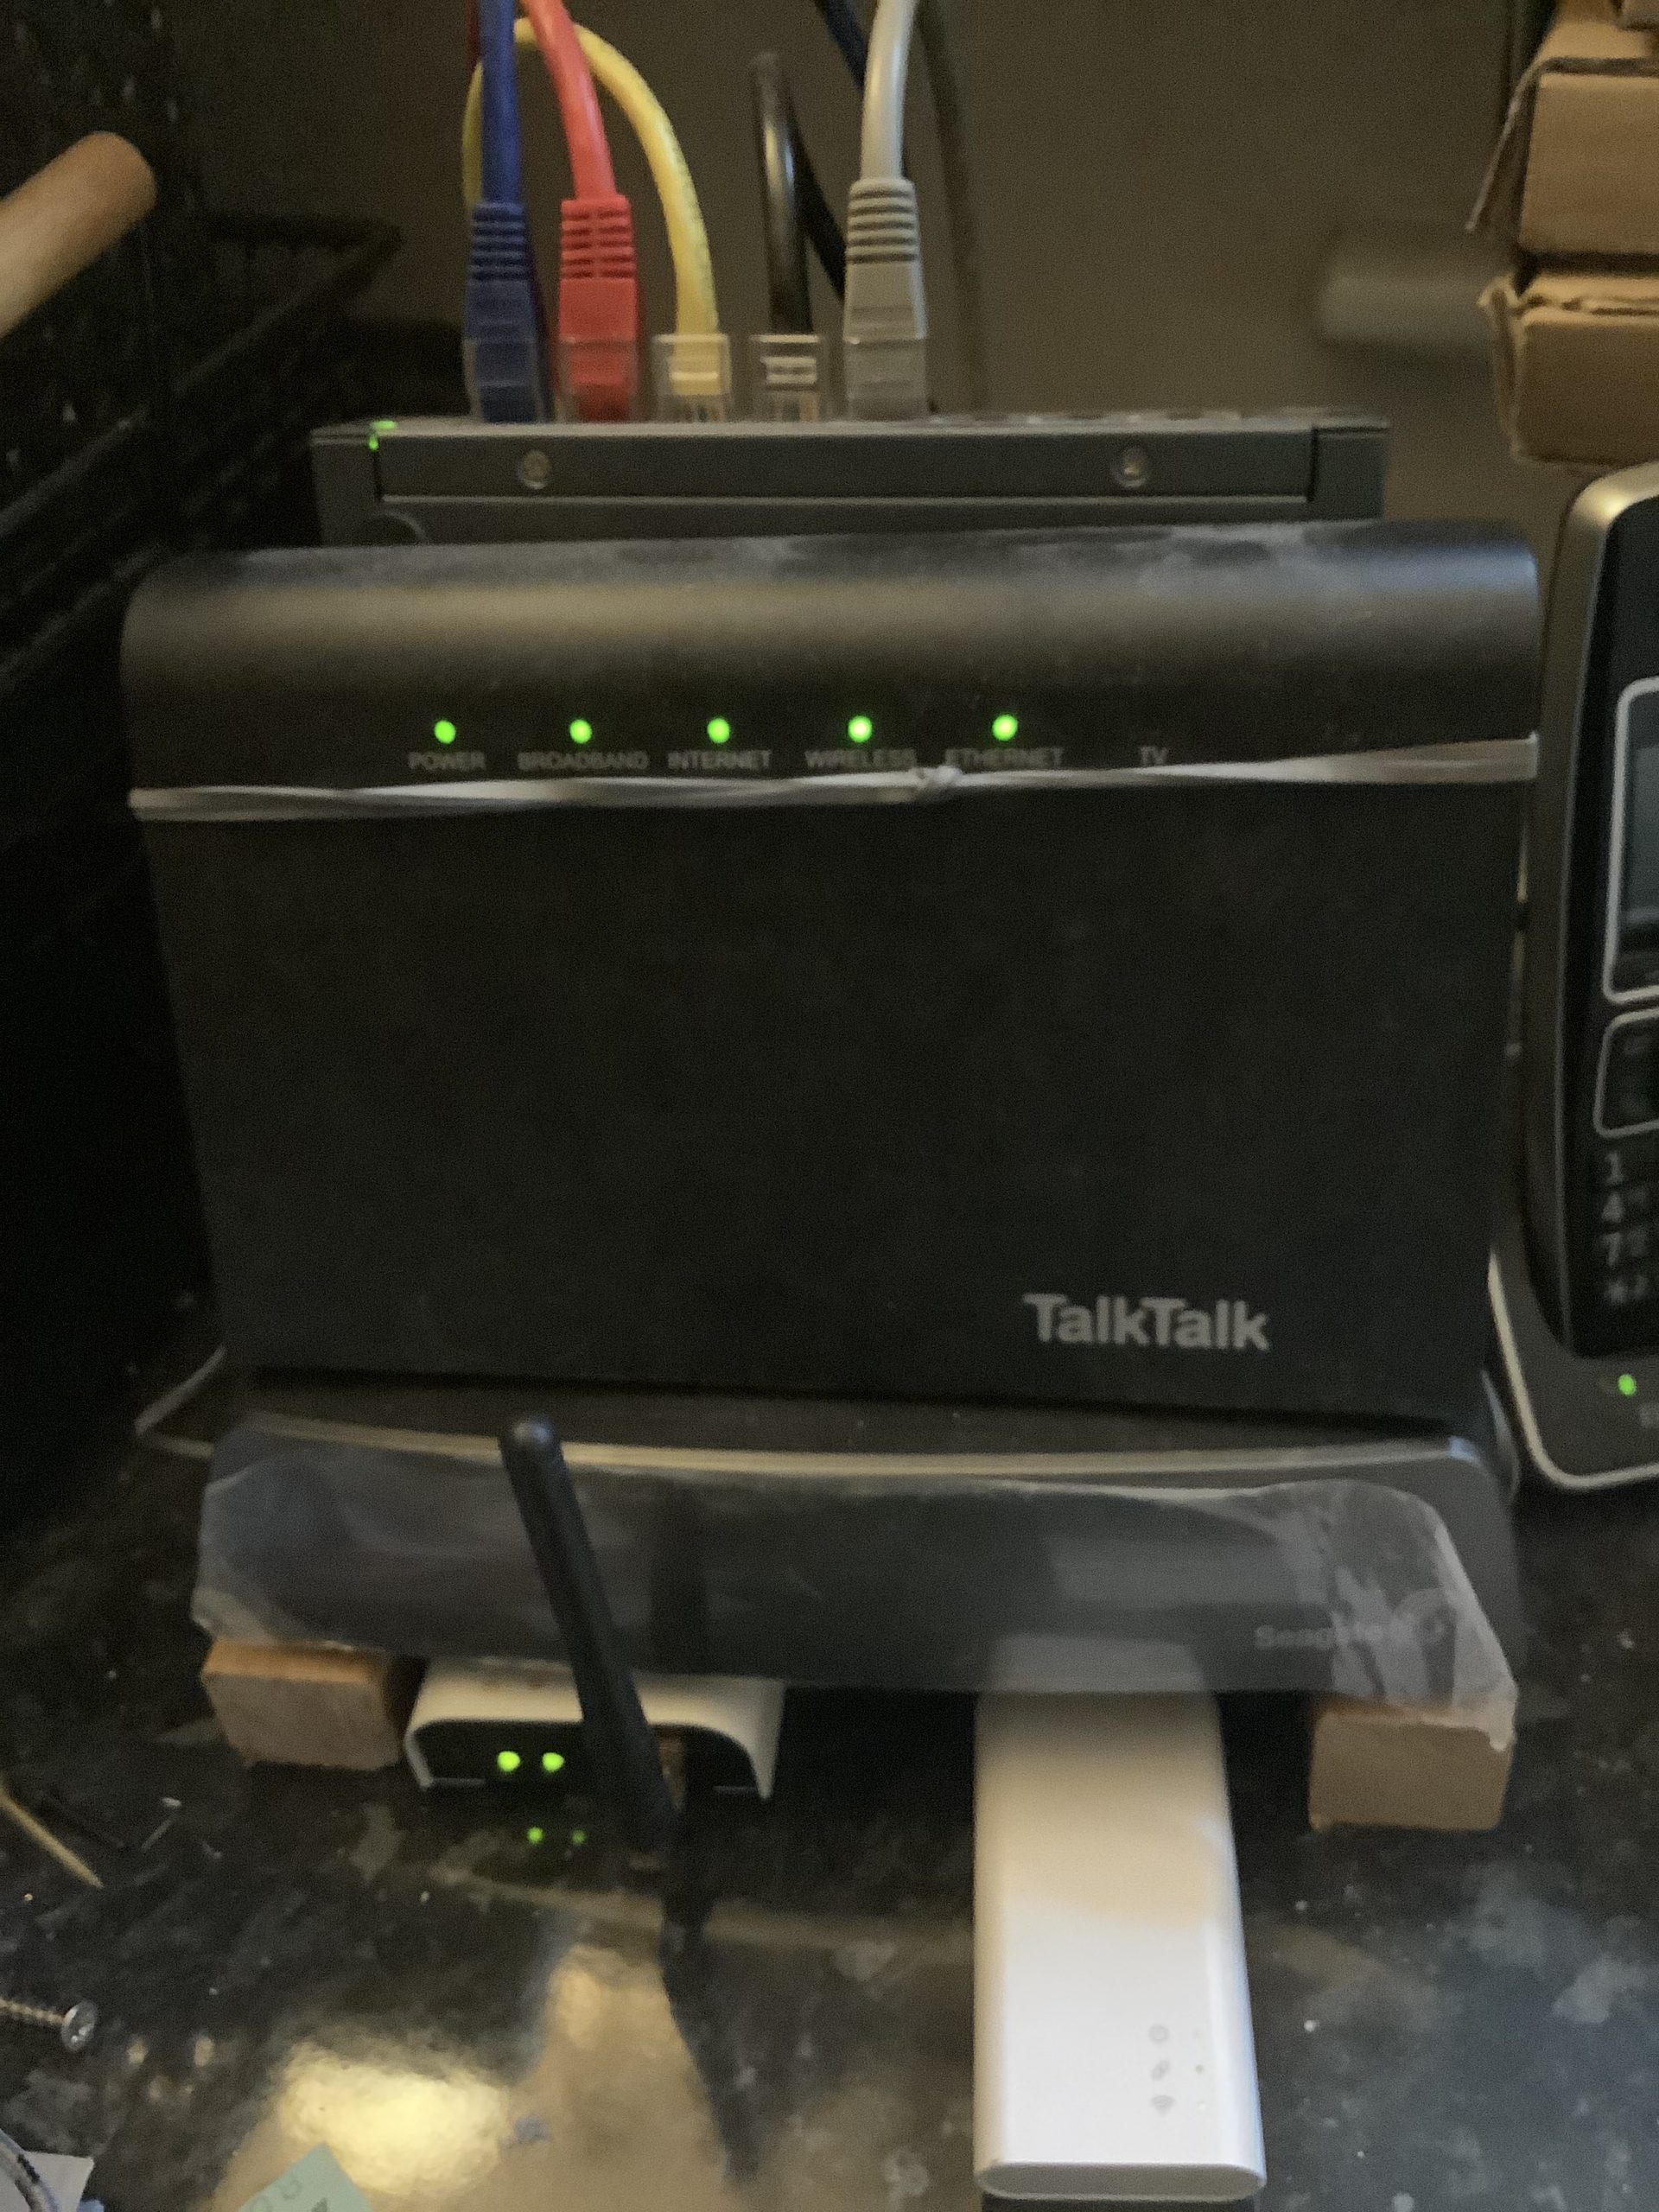
Like many homes we have a WiFi router where the fibre or telephone line enters the home. However over time I’ve been moving some devices from WiFi to Powerline adapters which carry the internet over the house wiring. This helps reduce issues where devices on different WiFi networks can’t communicate with each other and provides more bandwidth so more data can be carried more quickly.

I have four Powerline adapters which communicate with each other over the house wiring and then have different internet-enabled devices plugged into them. One such Powerline adapter is in the lounge with the WiFi router plugged into it.

Smart metering and external networks to home

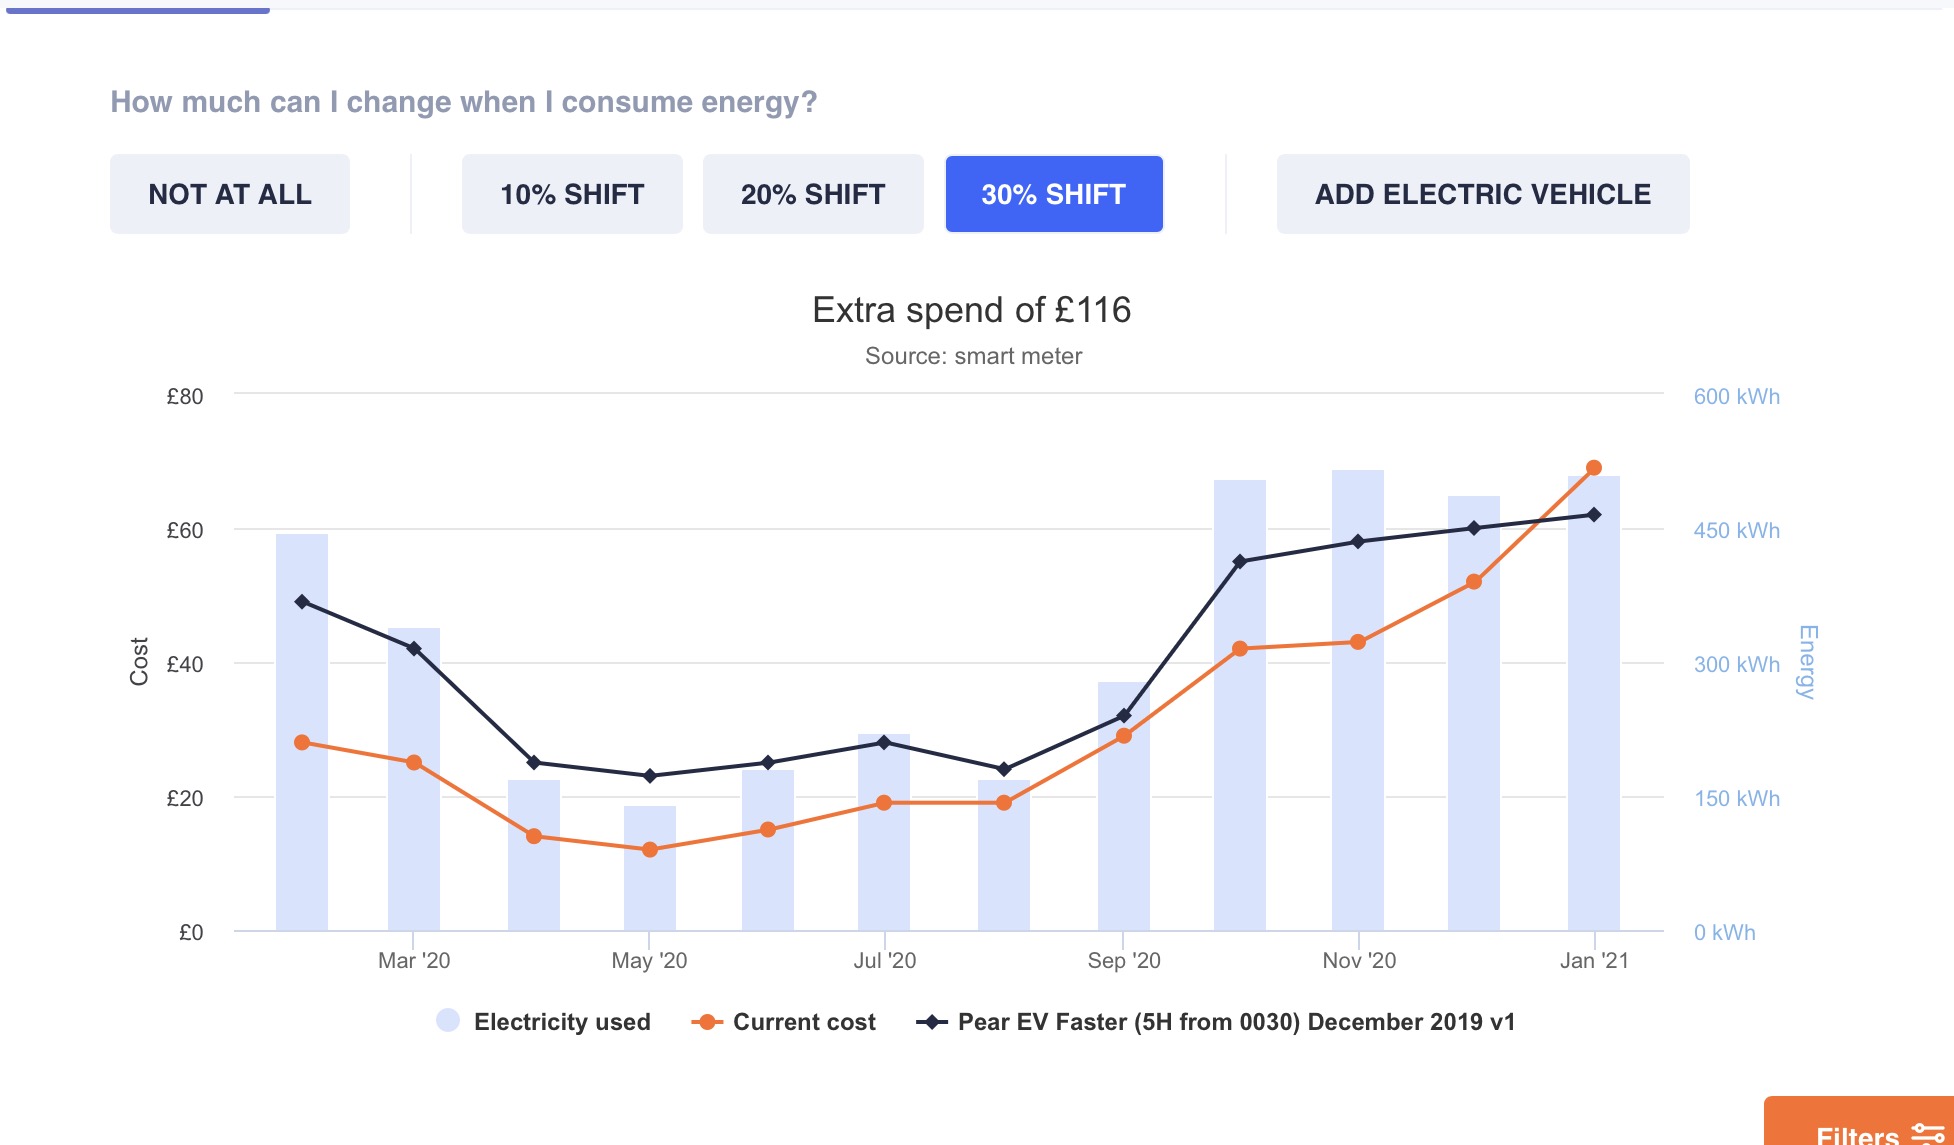
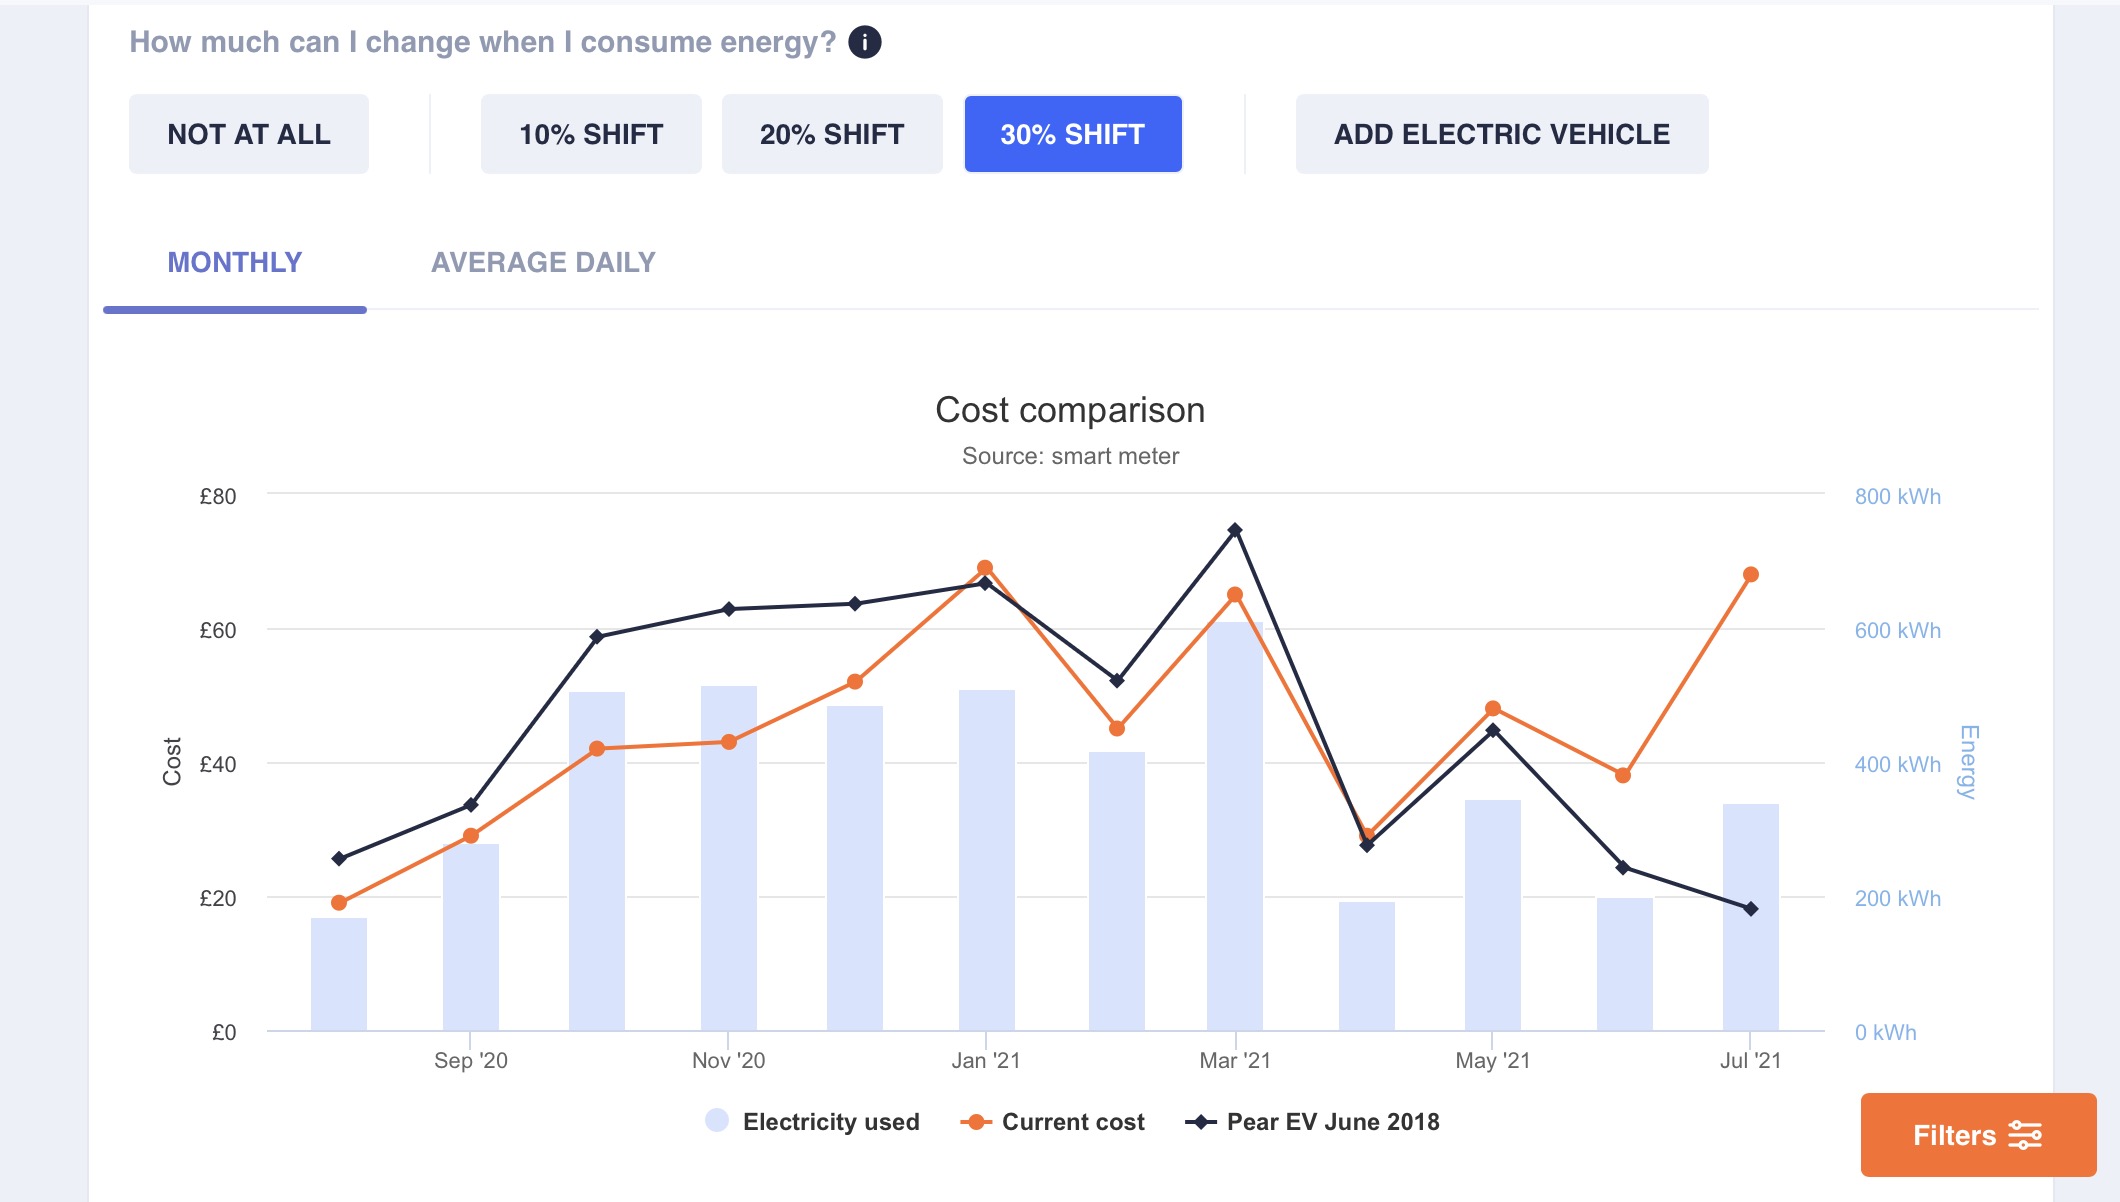
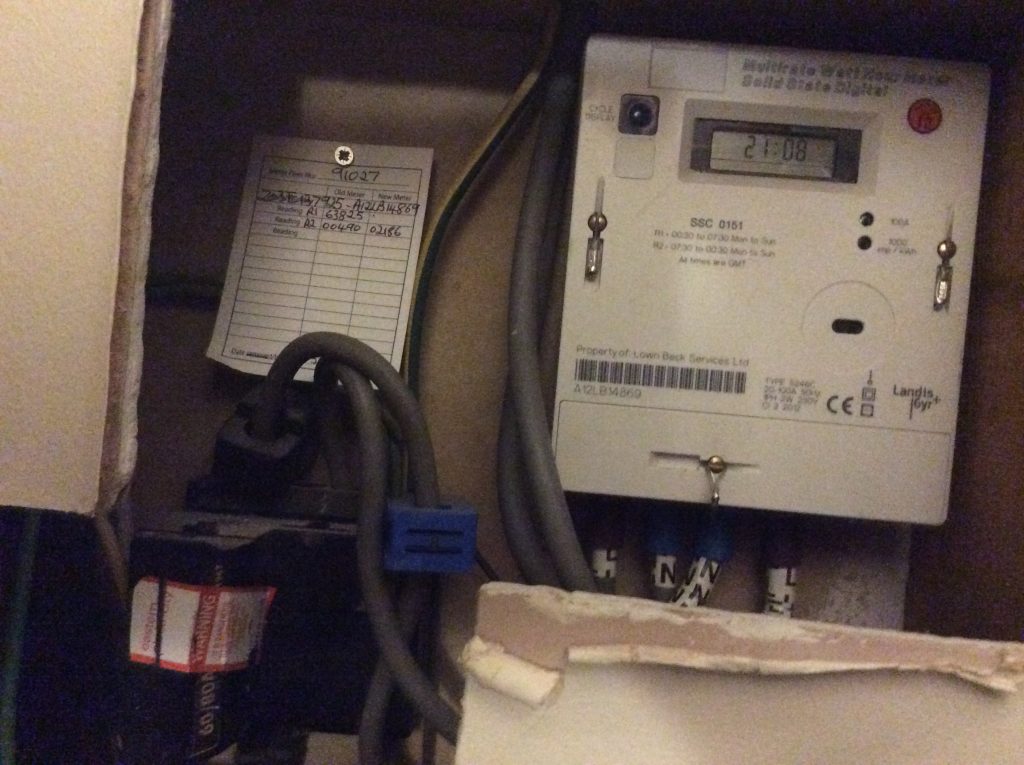
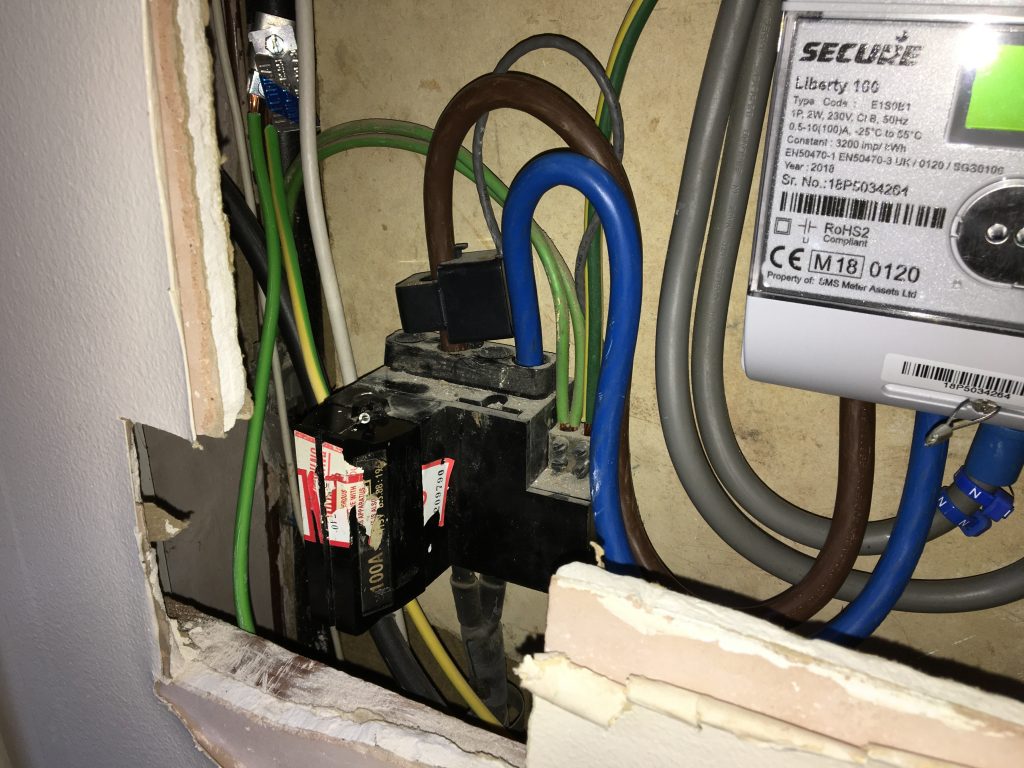
The second external connection to the home is to the smart meters. There are two networks associated with smart meters: the Wide Area Network (WAN) and the Home Area Network (HAN). The HAN (which uses a protocol called ZigBee) interconnects the meters (both electric and gas) and the in-home display IHD. The WAN communicates outside the home to send consumption data to one’s supplier via a national database called the DCC. The WAN can send data as frequently as half-hourly.

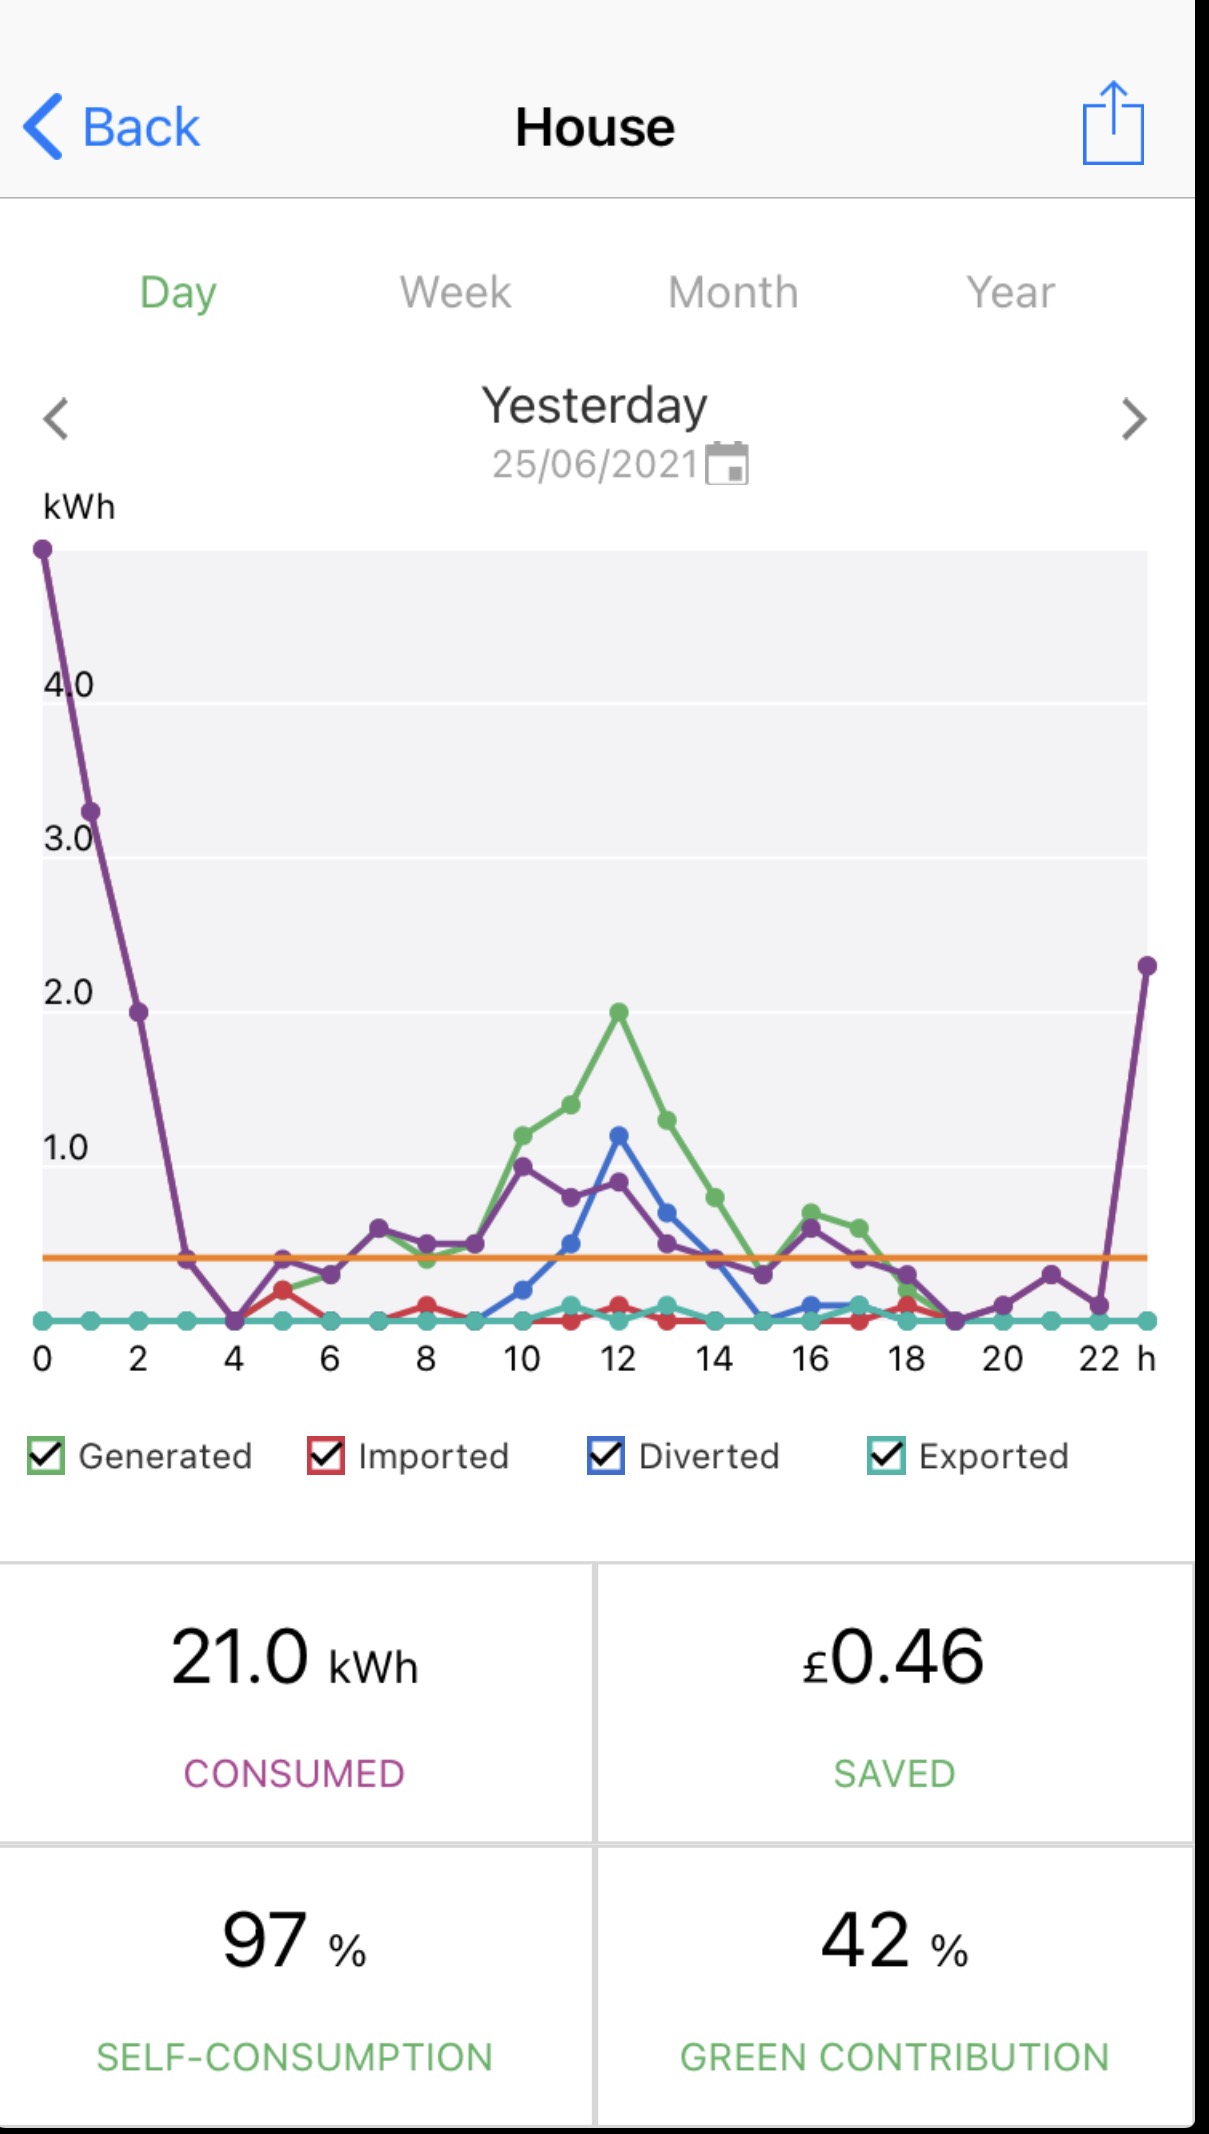
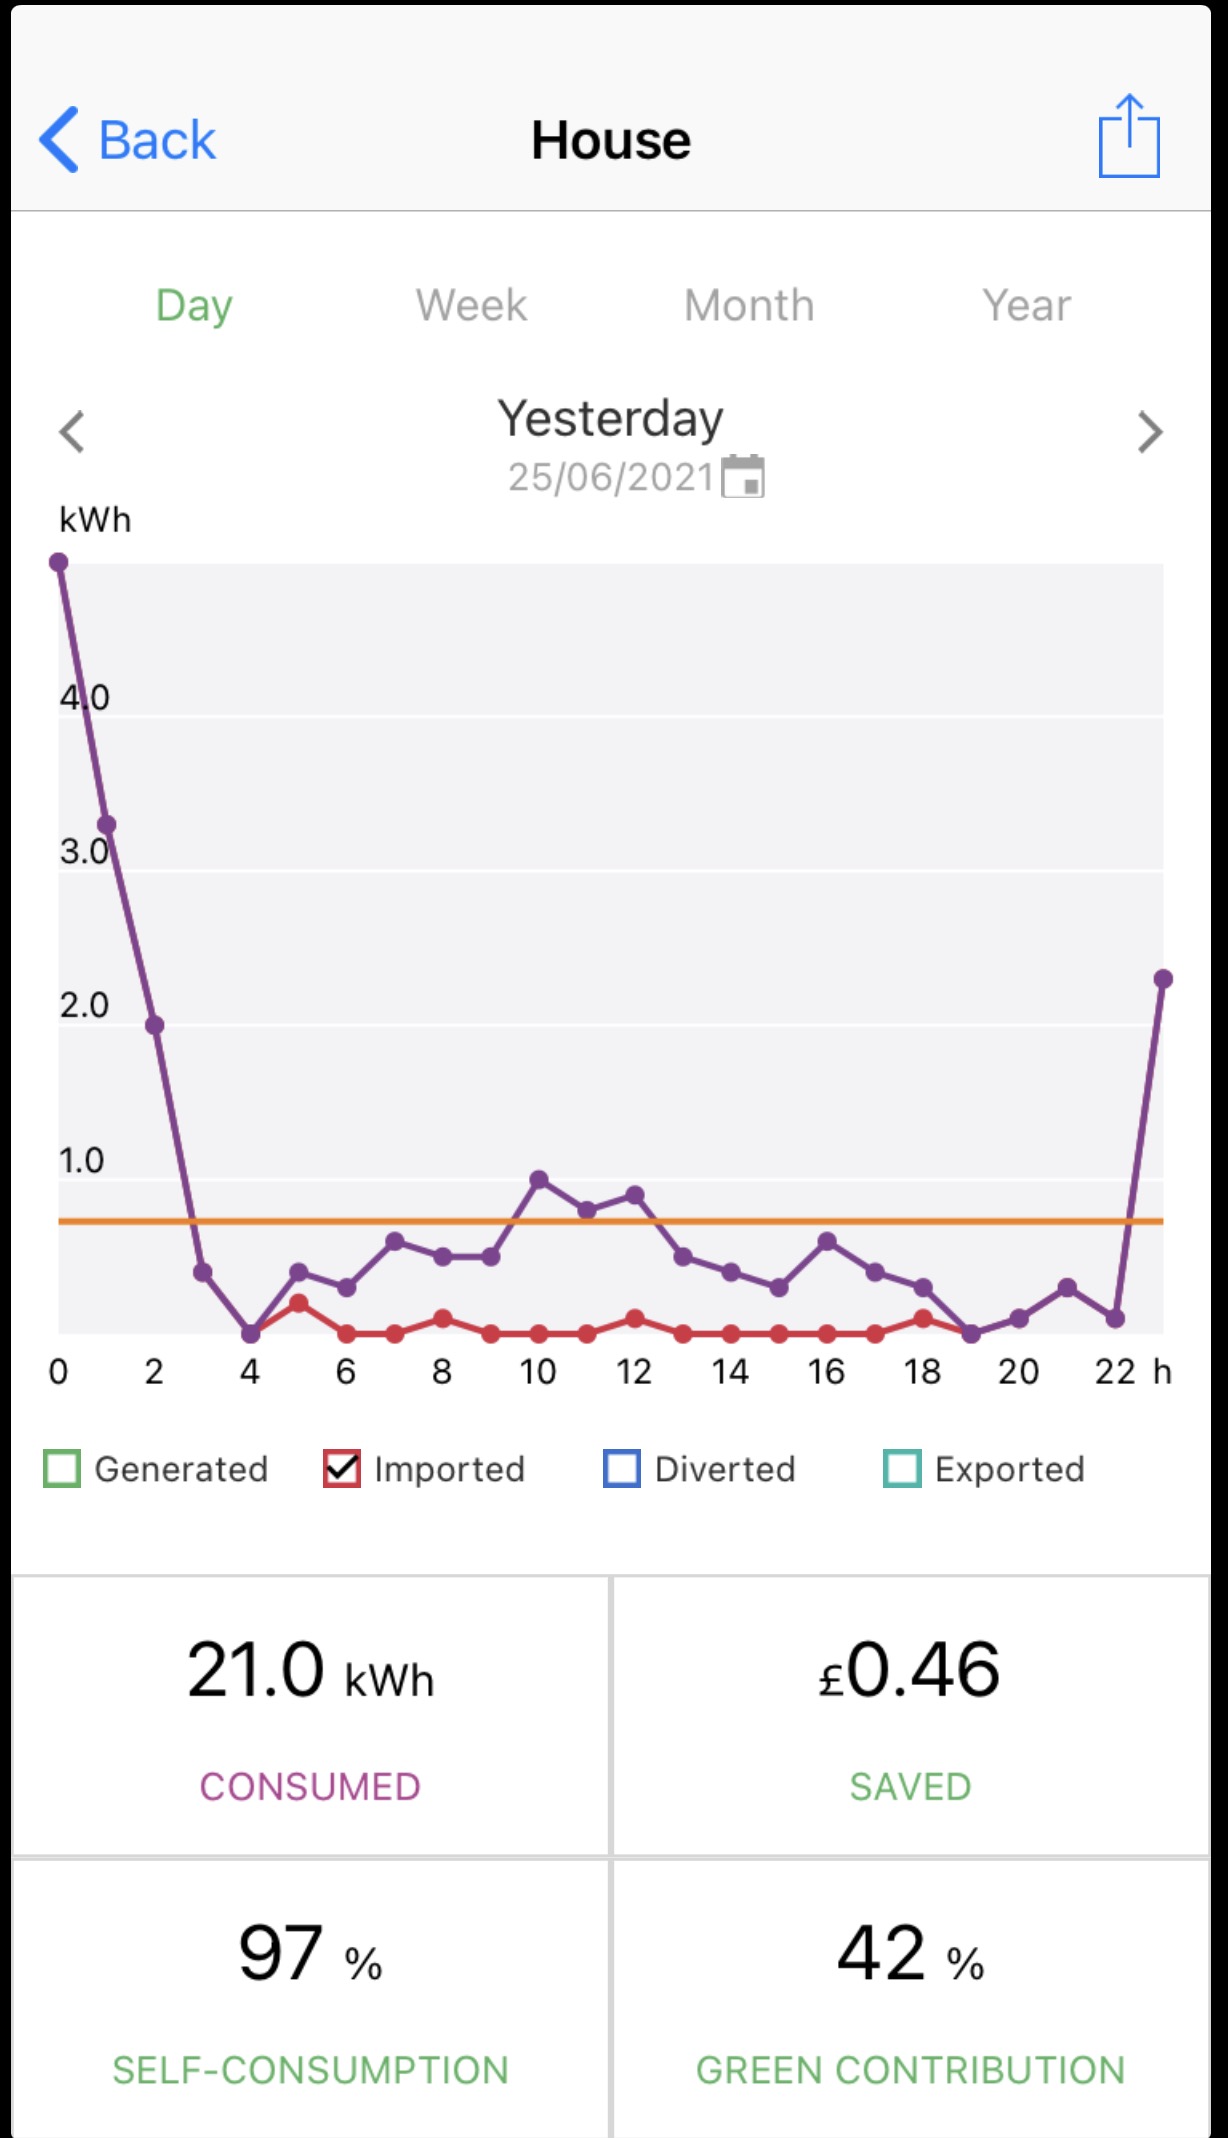
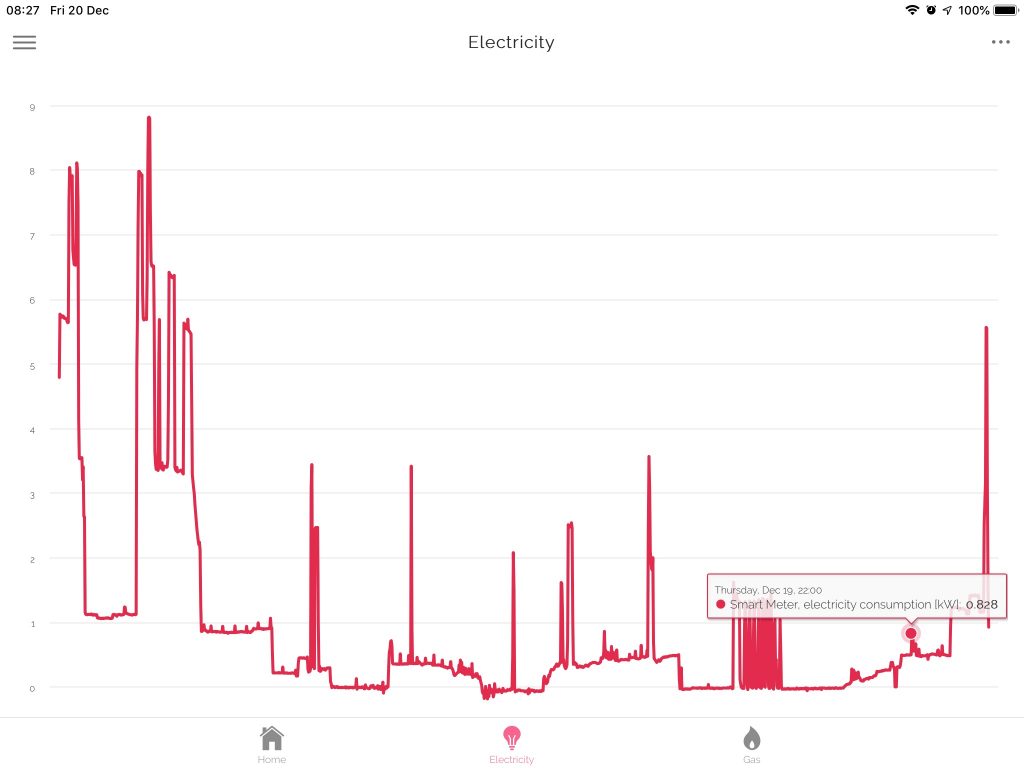
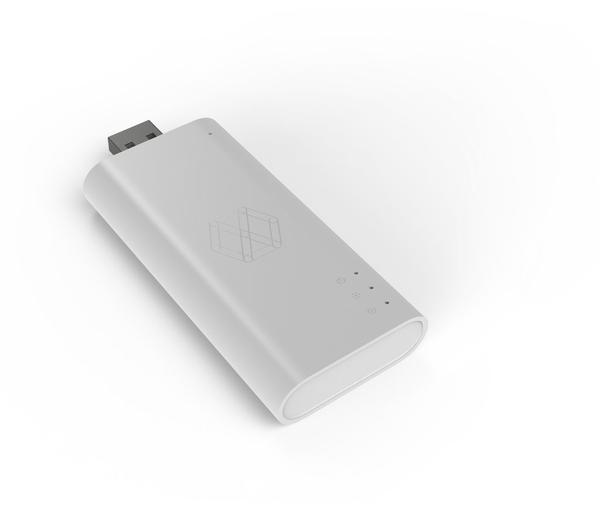
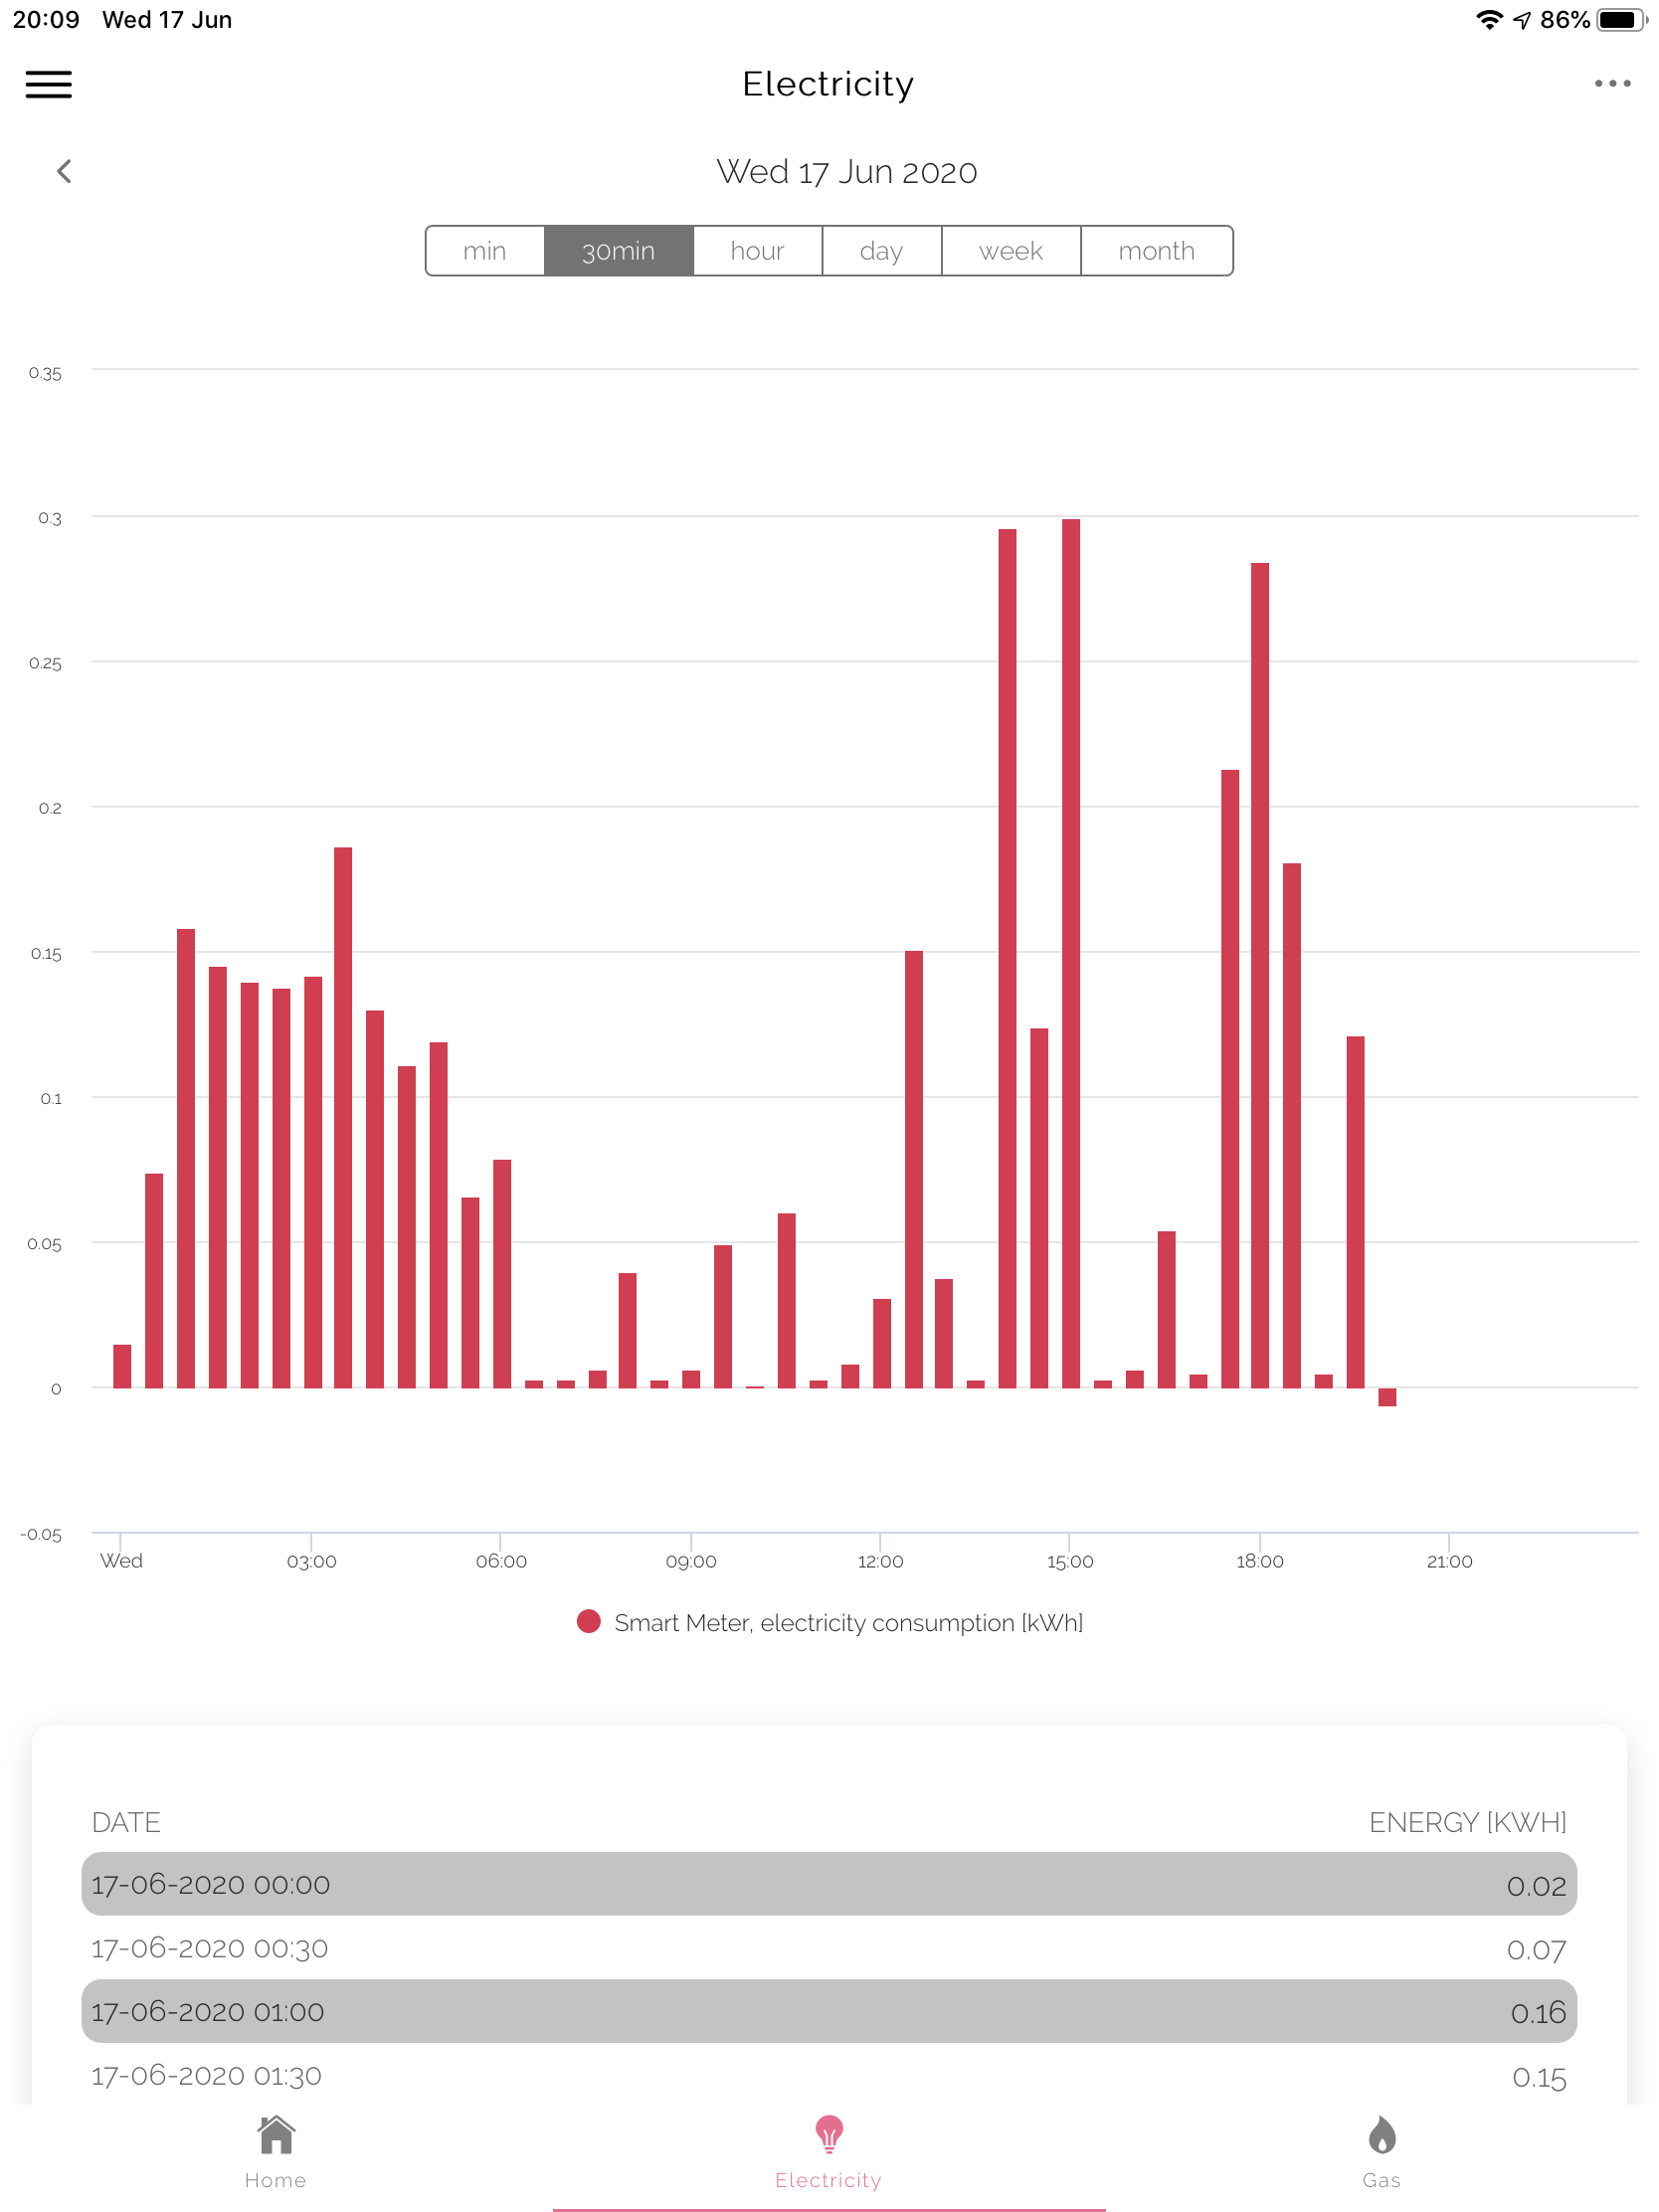
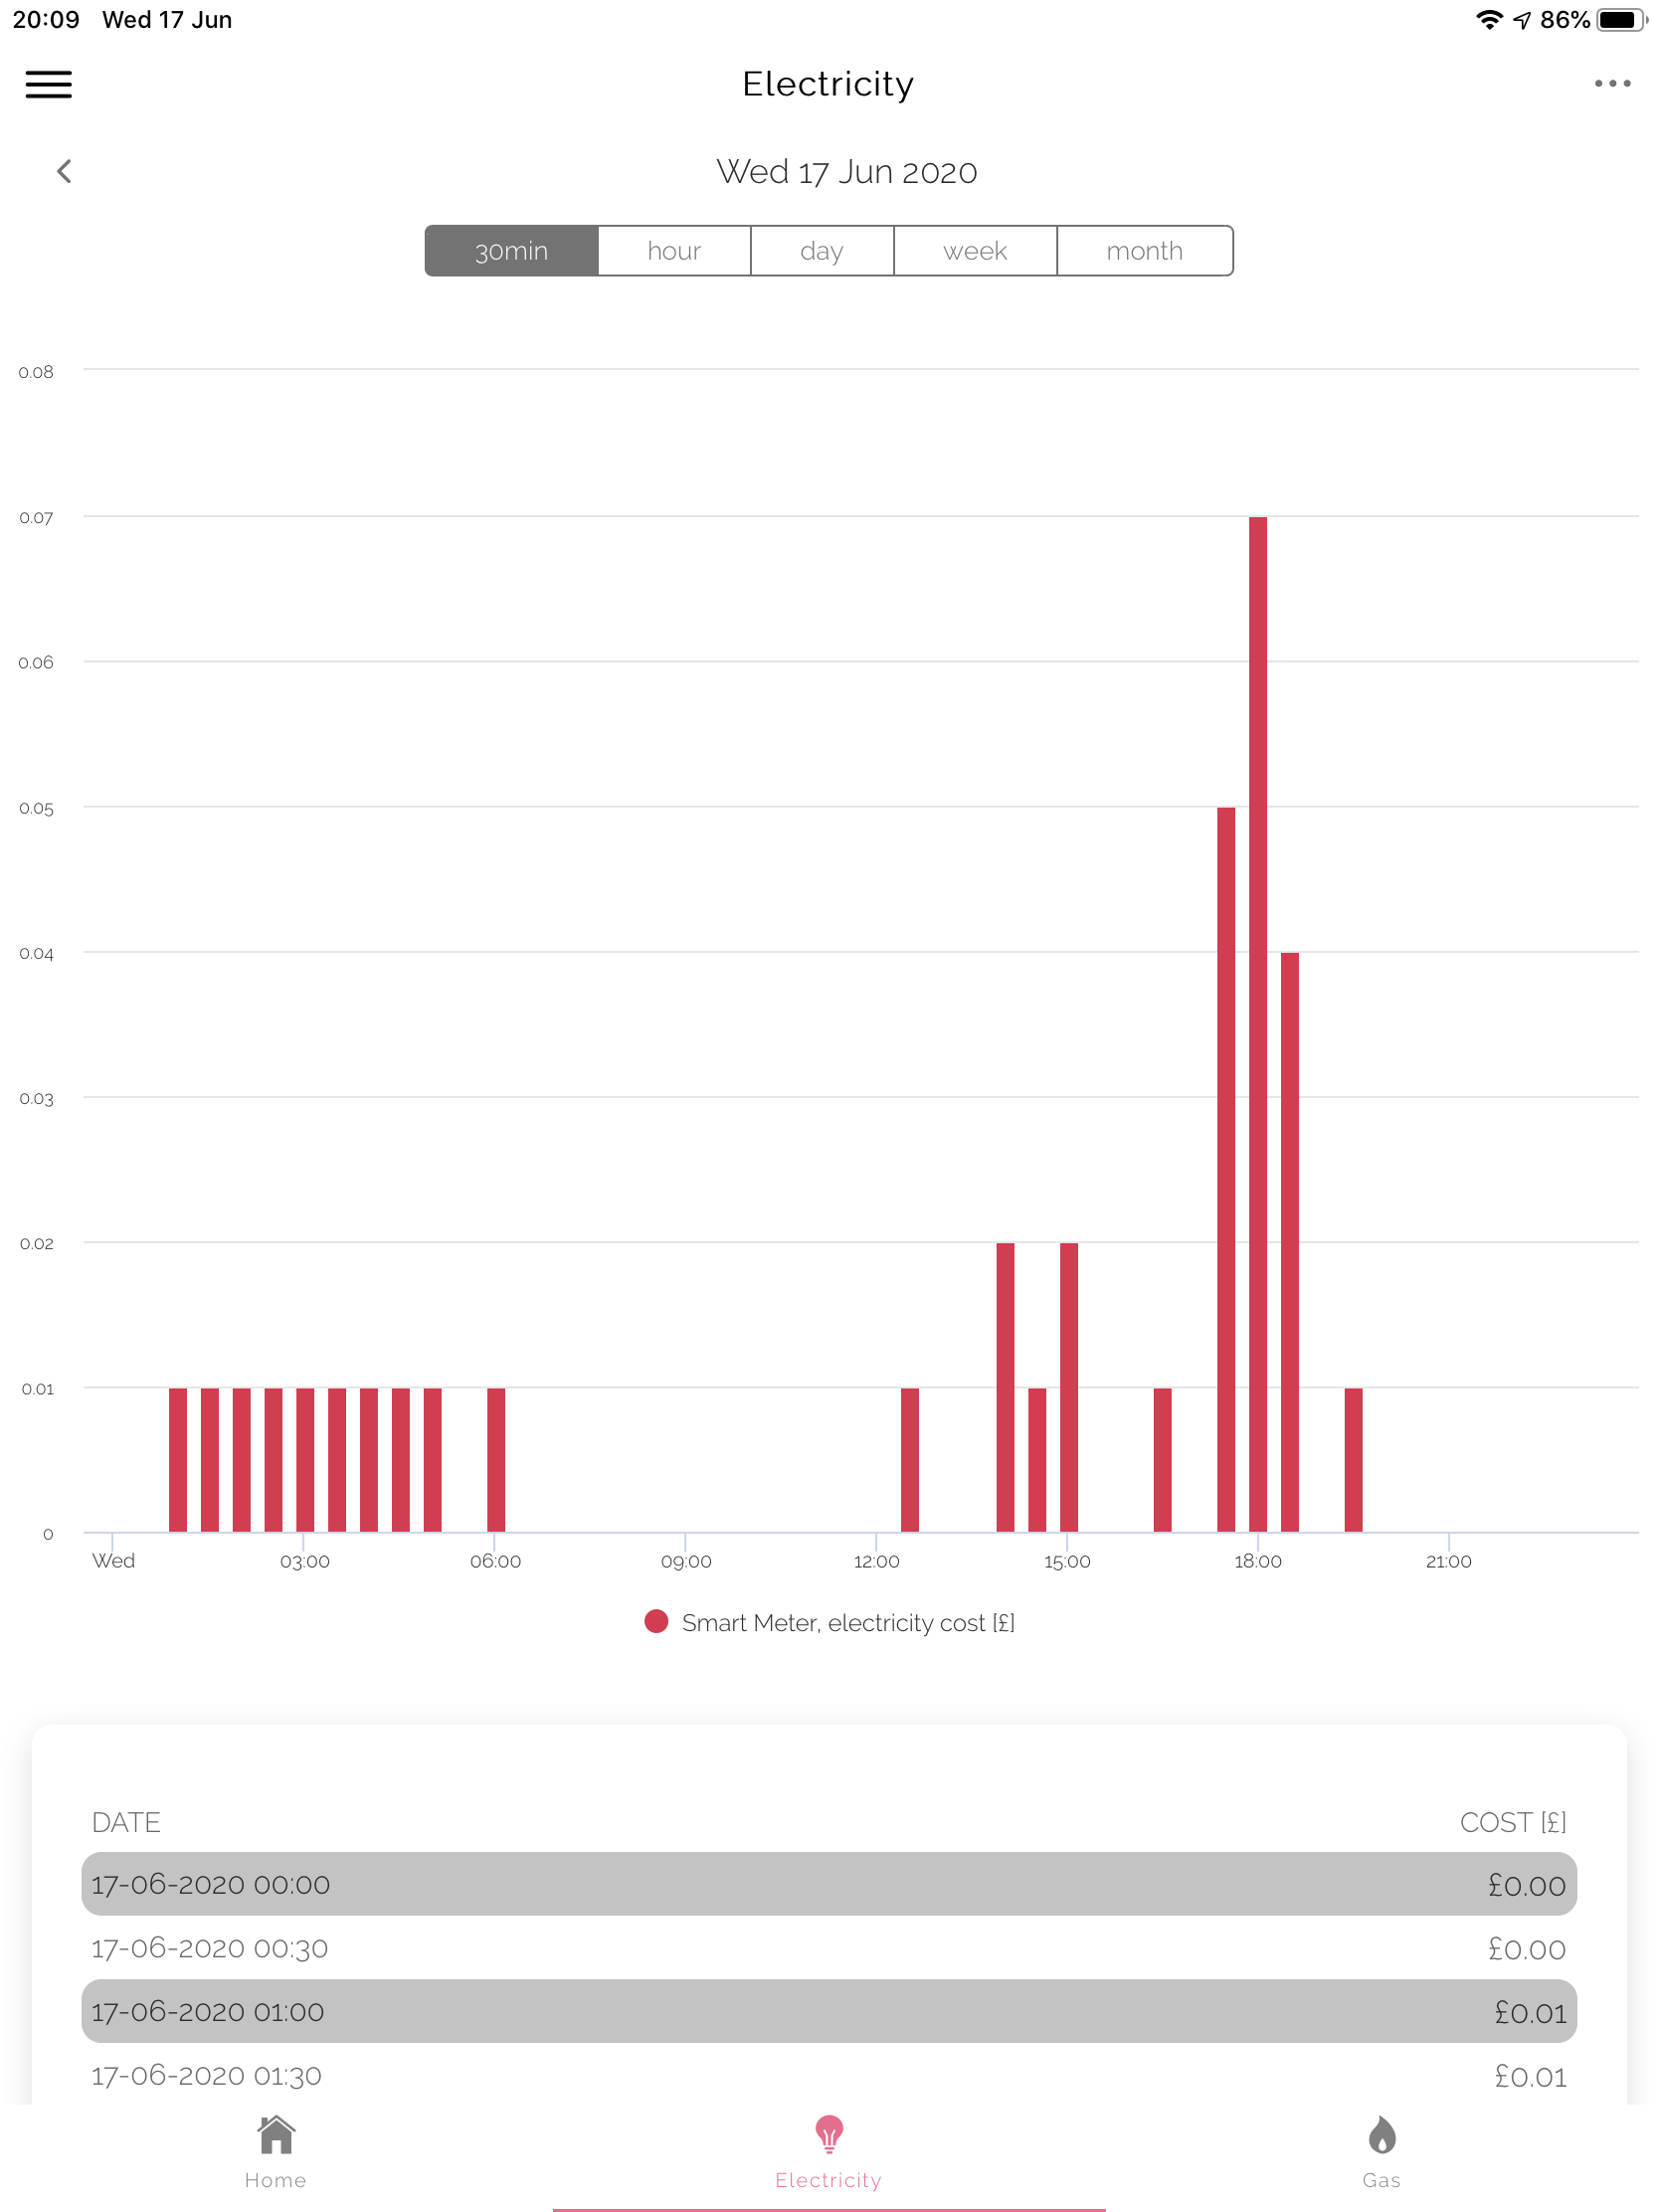
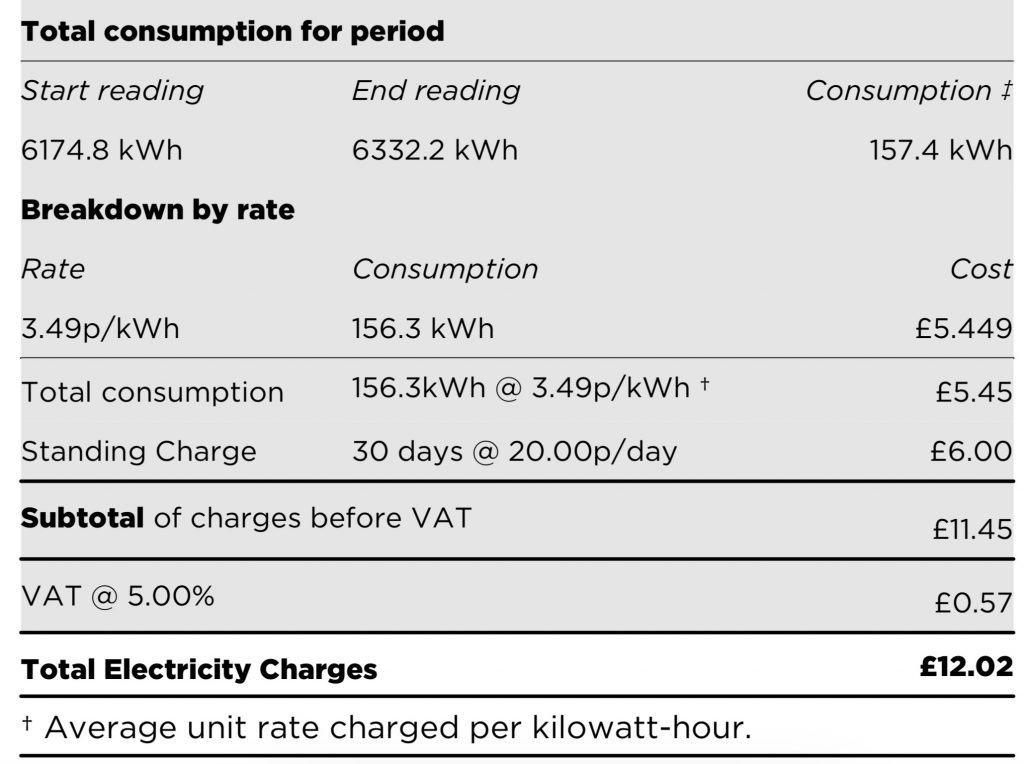
I also have an additional device known as a Consumer Access Device (CAD). The CAD connects the HAN side of the smart meter to an independent database. This offers me two two things: (i) a third party app to review my electricity and gas use and (ii) data on a minute-by-minute basis rather than at most half-hourly. The CAD acts as a bridge between the ZigBee and WiFi.

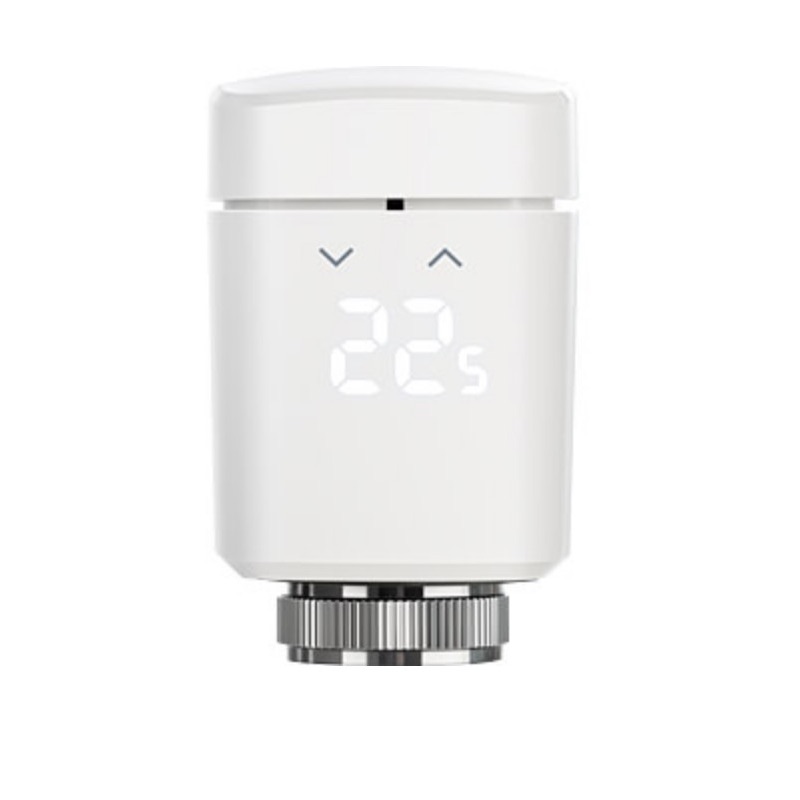
Much of my home automation, particularly home heating, uses Apple HomeKit. HomeKit runs on home hubs, rather than an external cloud server. The hubs commonly connect to the individual smart devices (such as radiators valves, smart plugs, door and window sensors etc) by Bluetooth Low Energy (BLE). The low power demand of BLE allows battery powered devices to operate for months between battery replacements. My original hub was an Apple TV.

Apple HomeKit smart devices

Subsequently I’ve added an Apple smart speaker which can also act as a hub. HomeKit decides which of the available hubs to put in charge, but may relay signals to and from the devices via other hubs. The smart speaker also supports a protocol called thread which allows communications to and from smart devices like door sensors via other smart devices on their way to and from a hub. Thread thus helps to extend the area that can be covered by a hub by allowing signals to and from distant sensors and actuators to travel via nearer devices rather than directly to or from hubs.

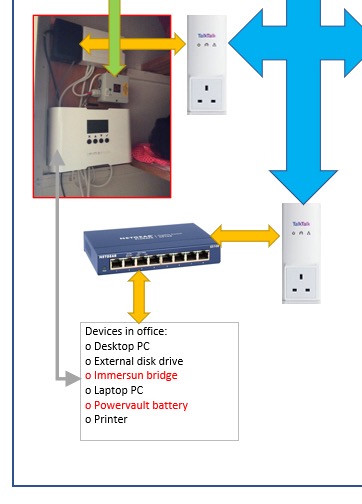
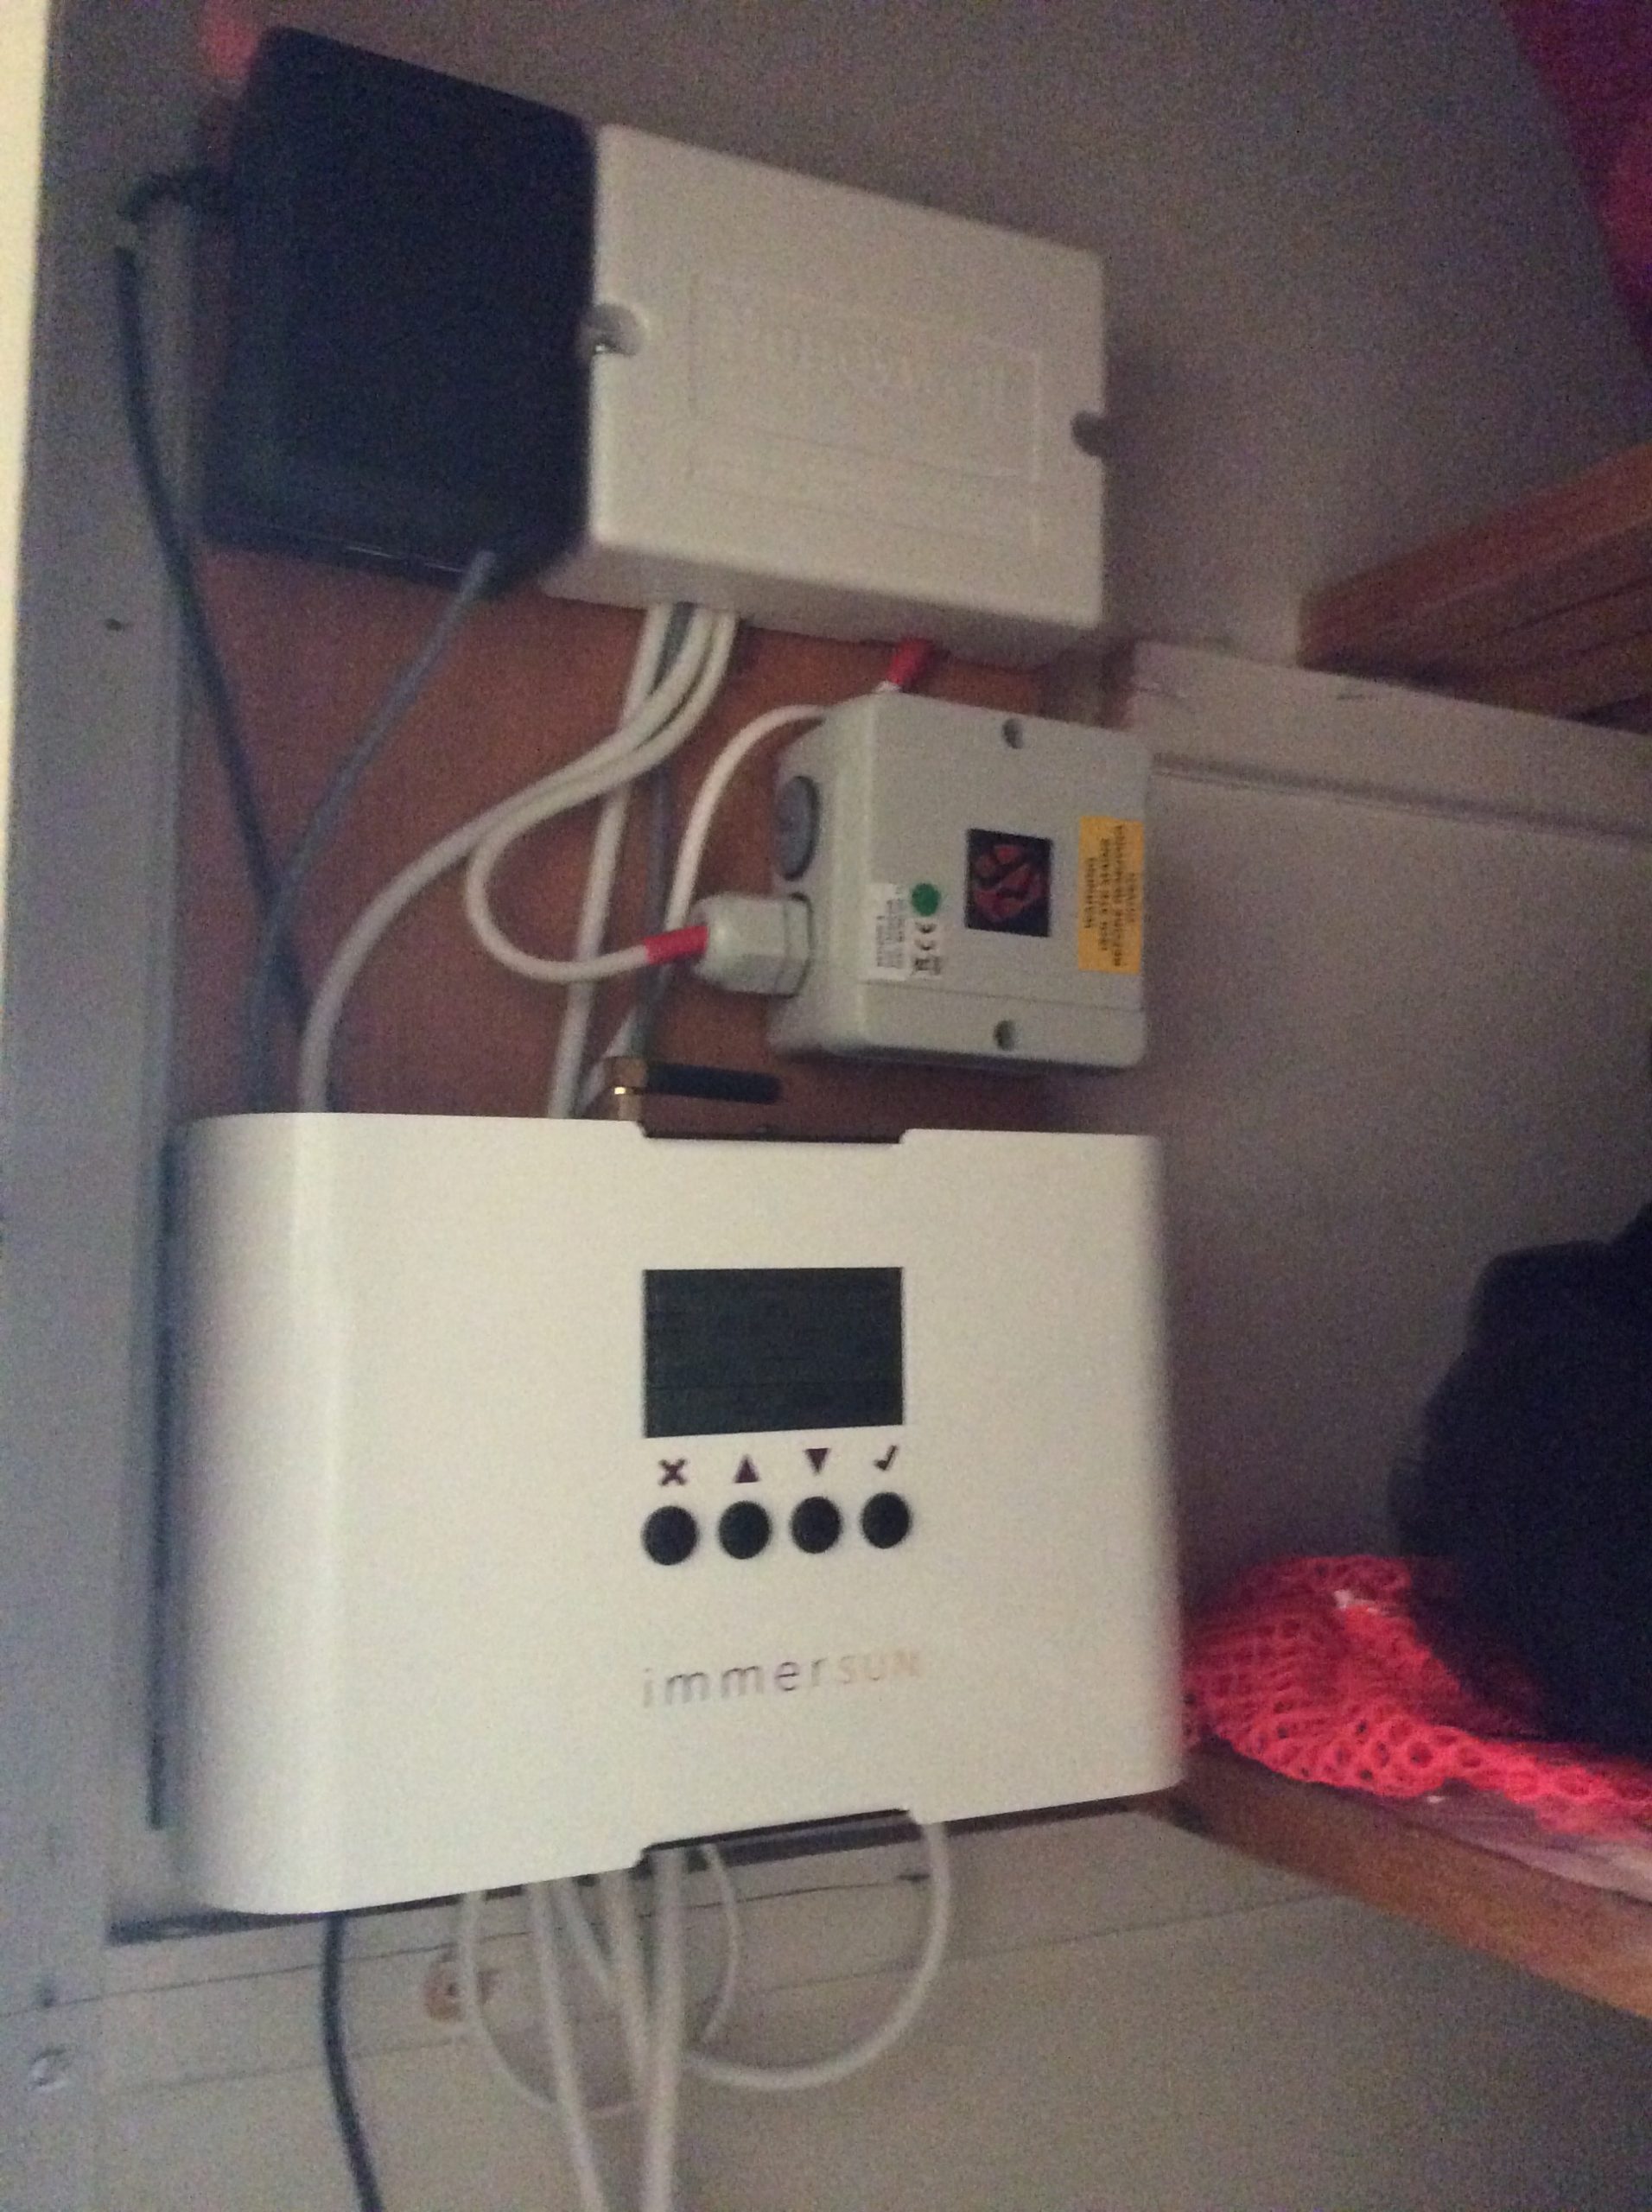
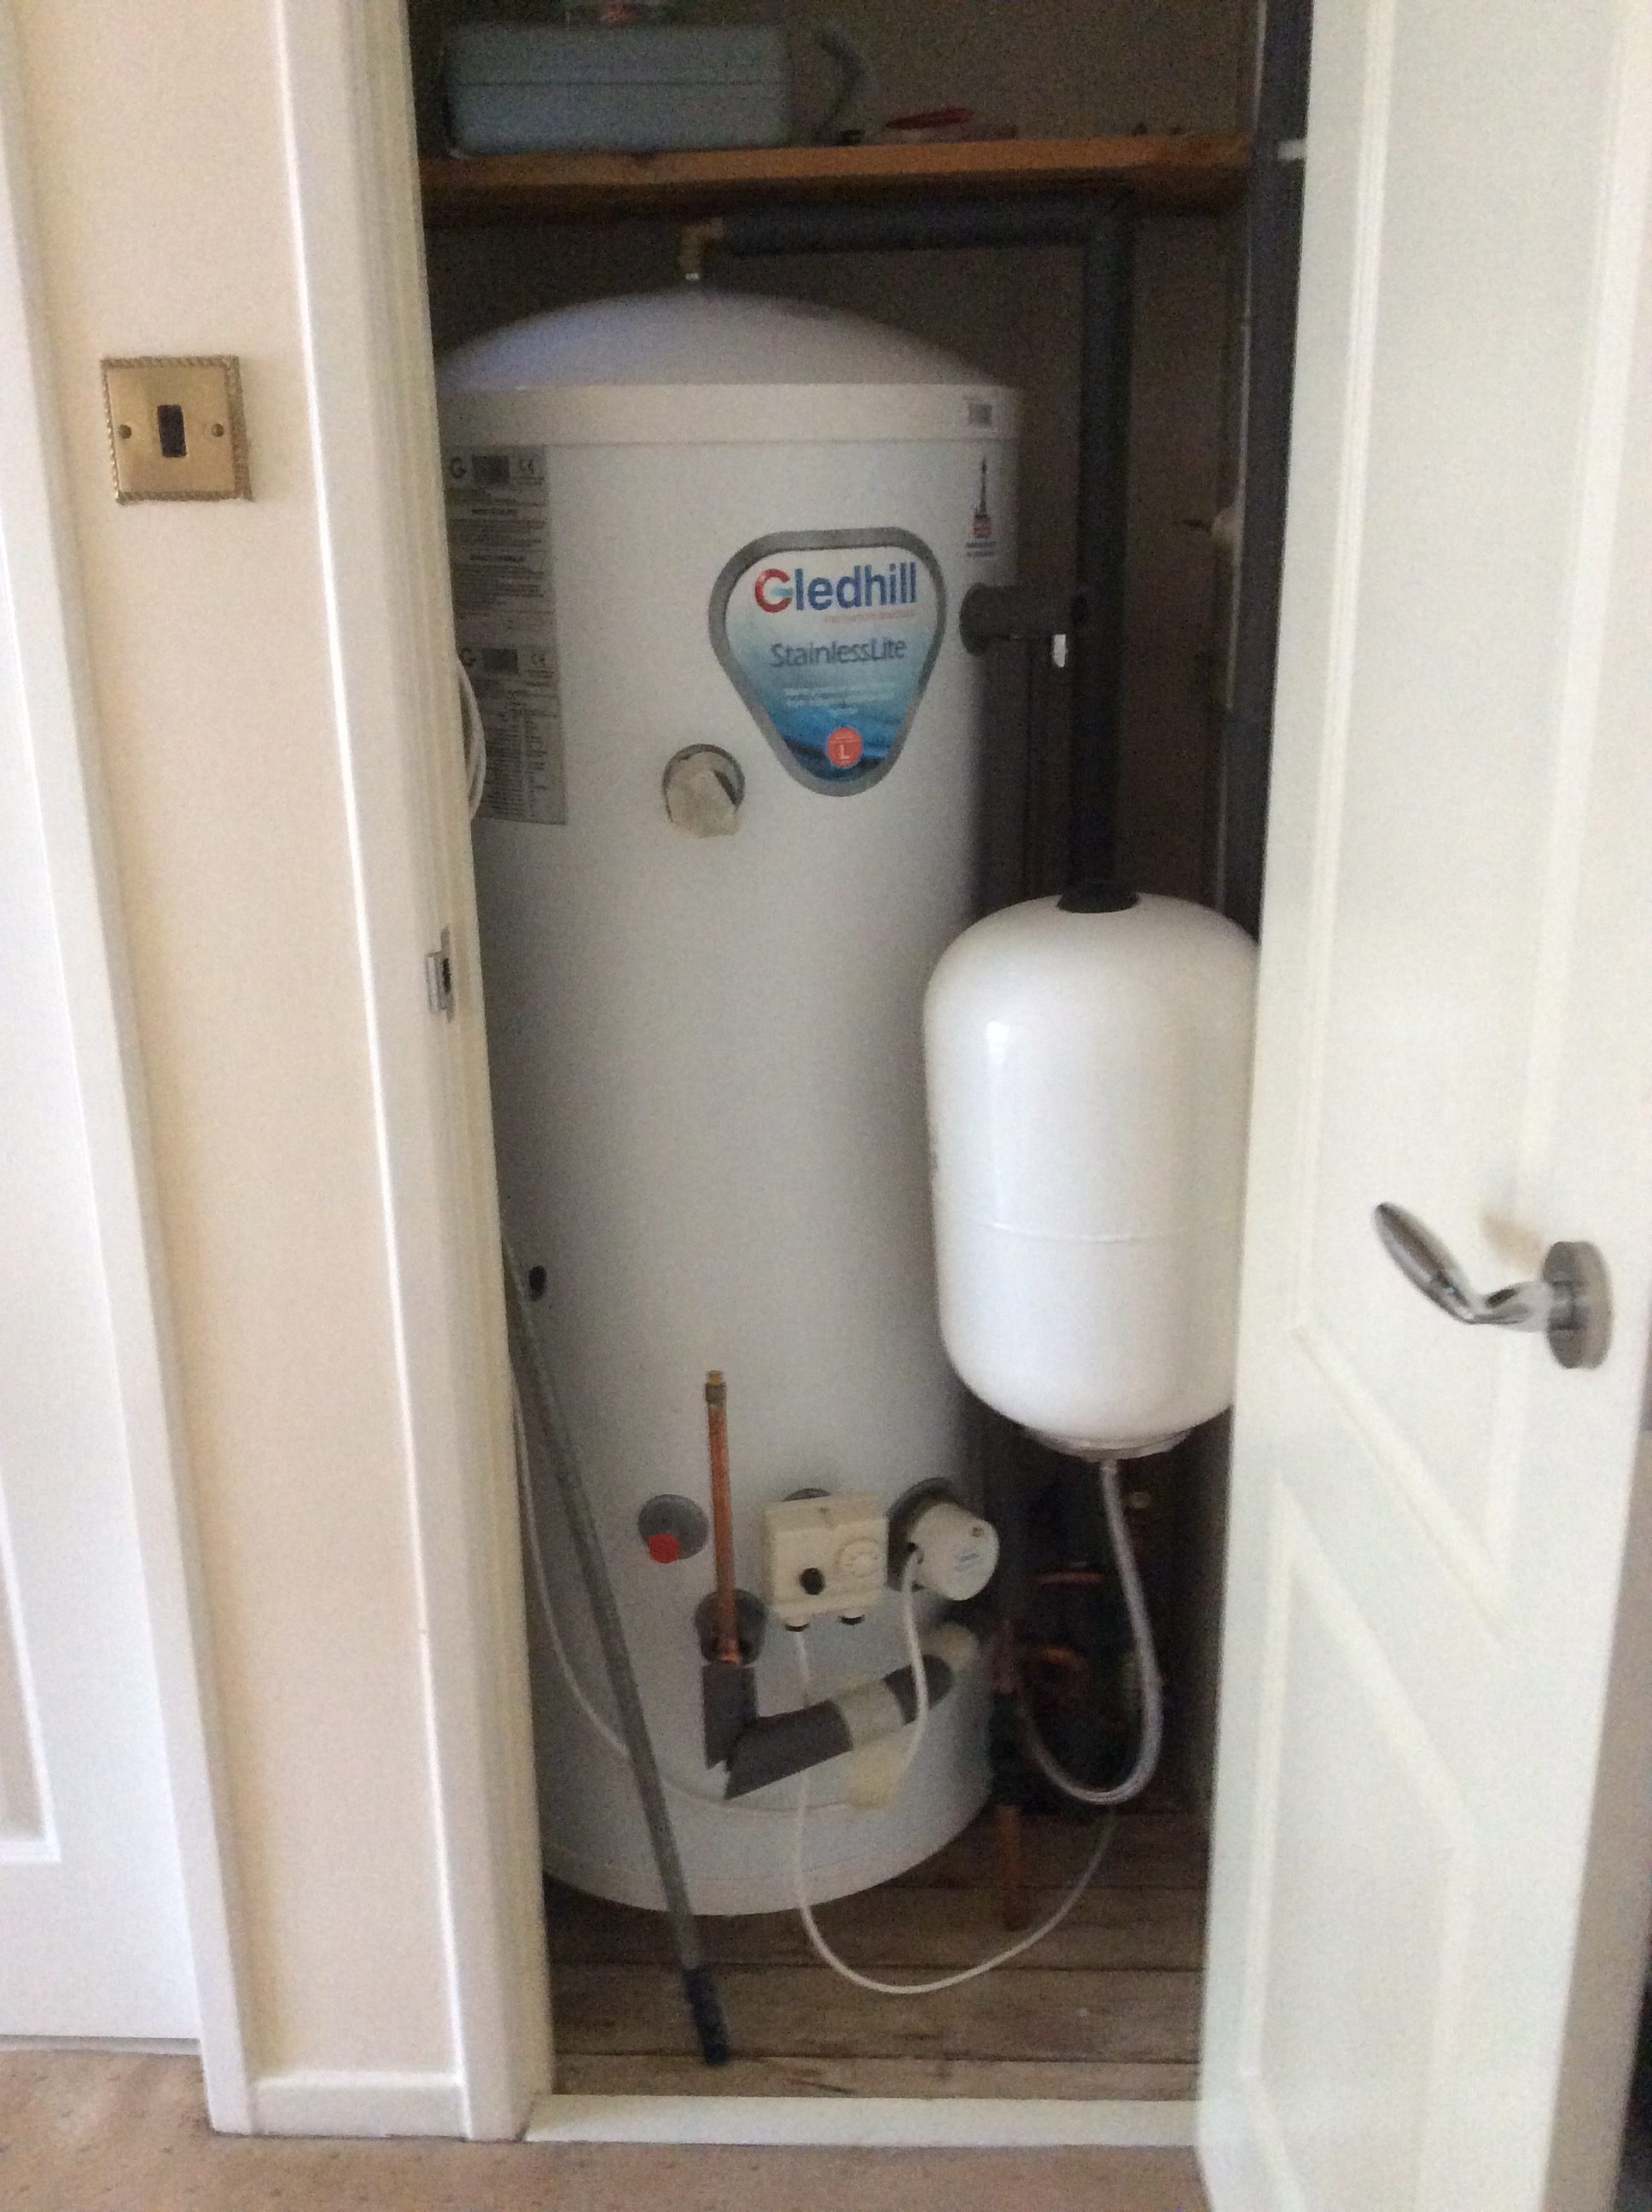
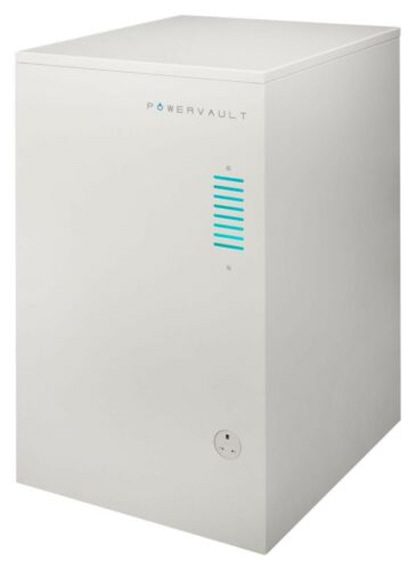
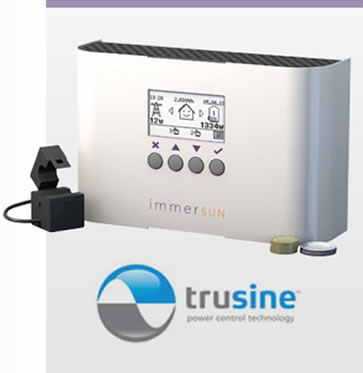
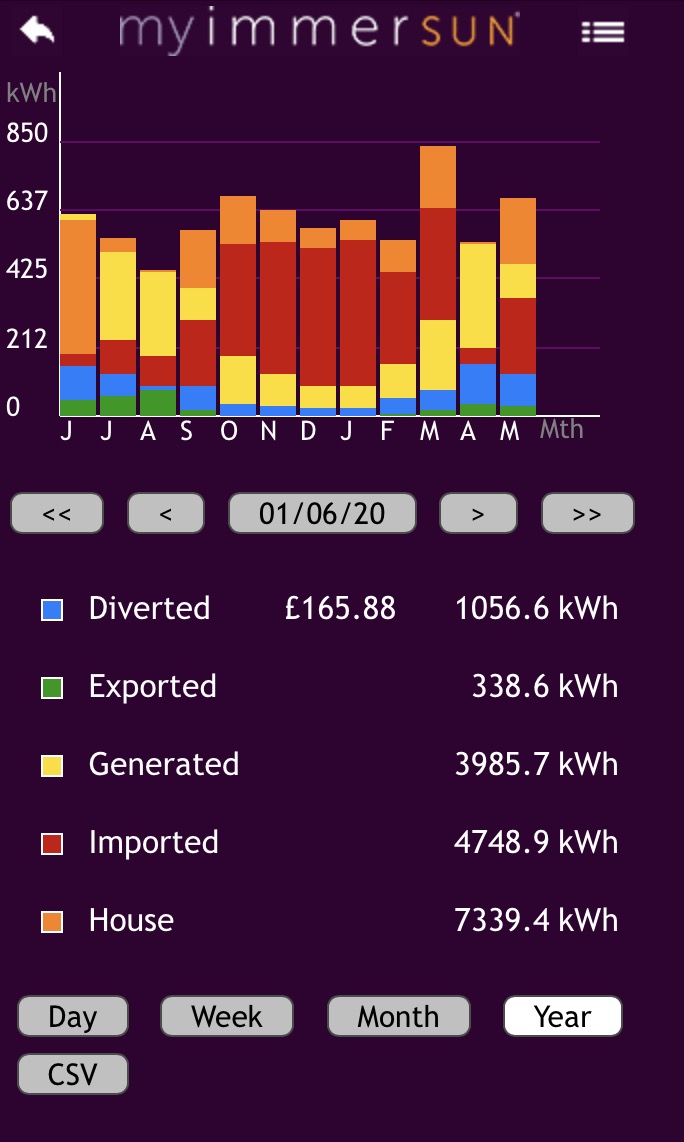
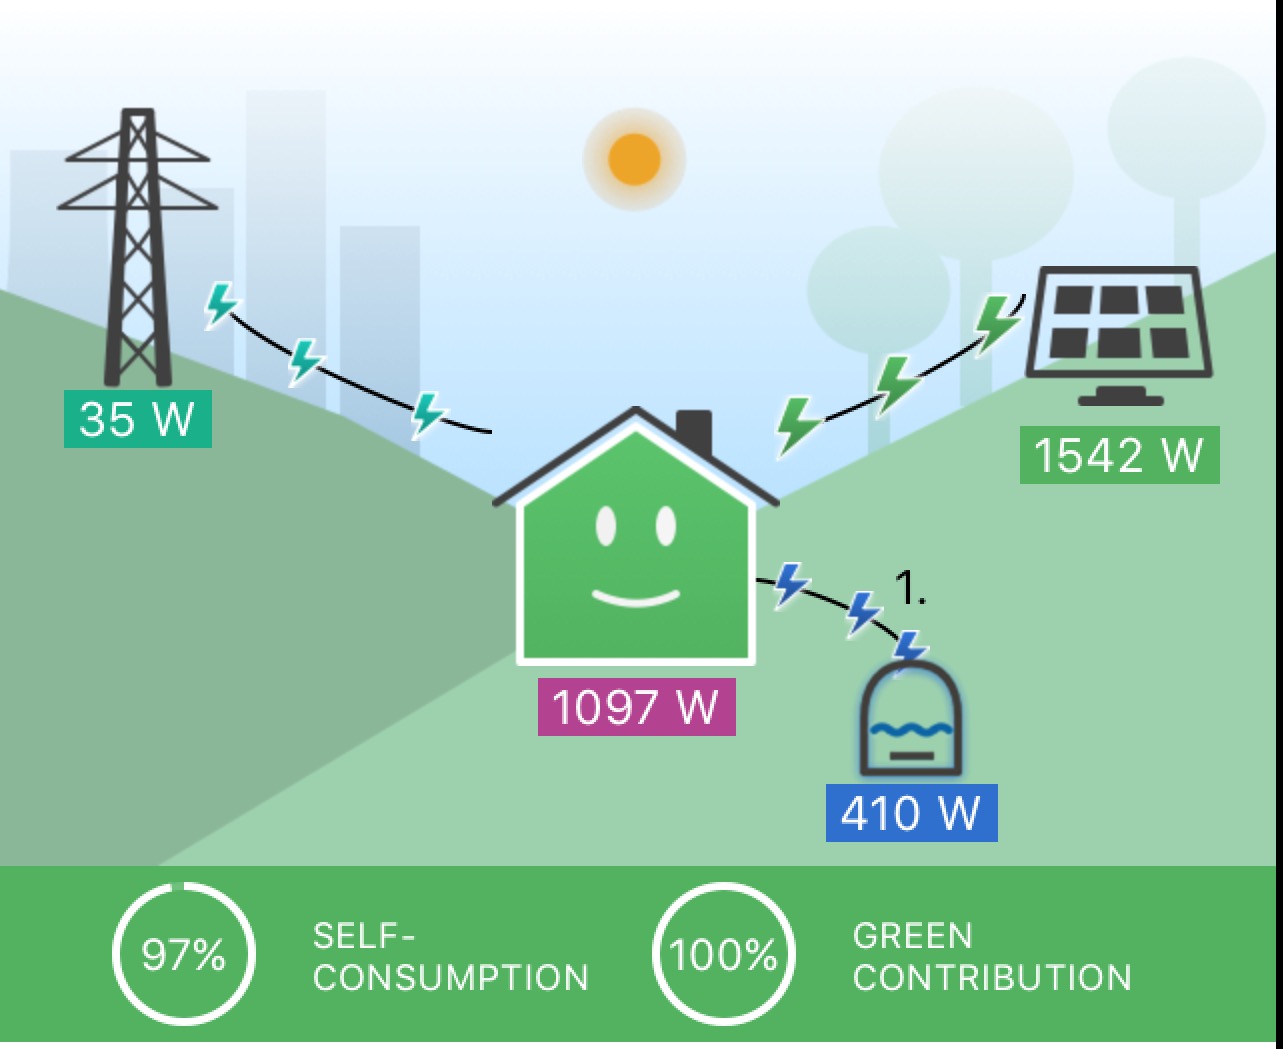
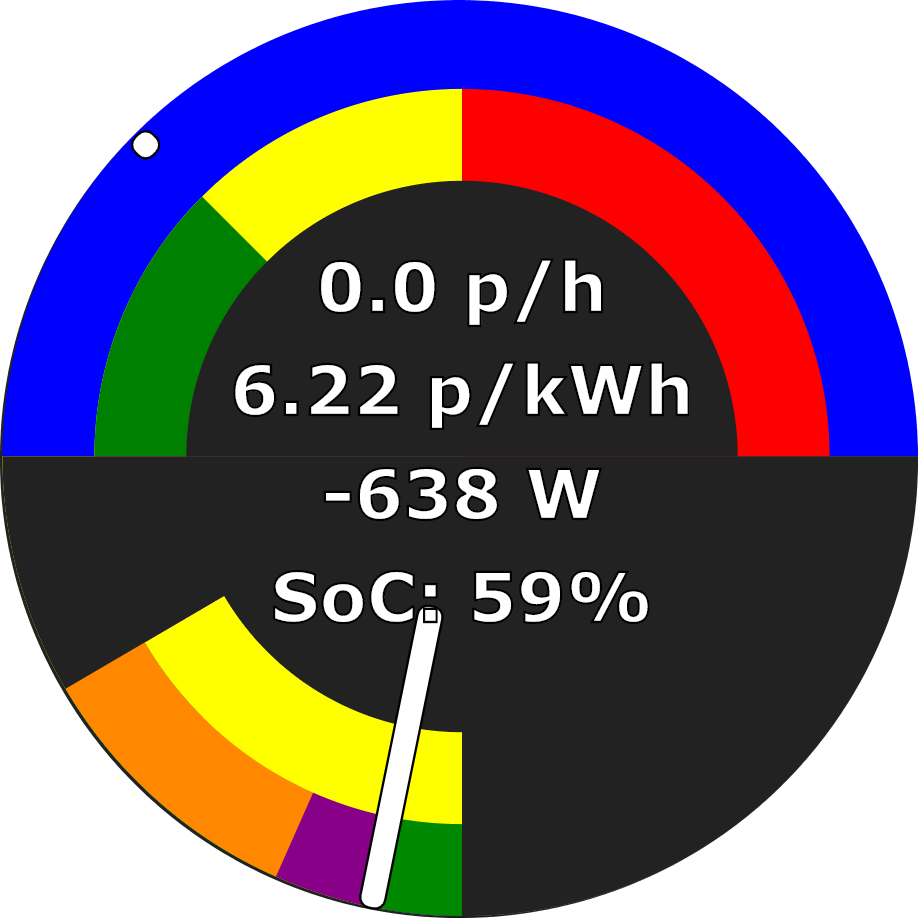
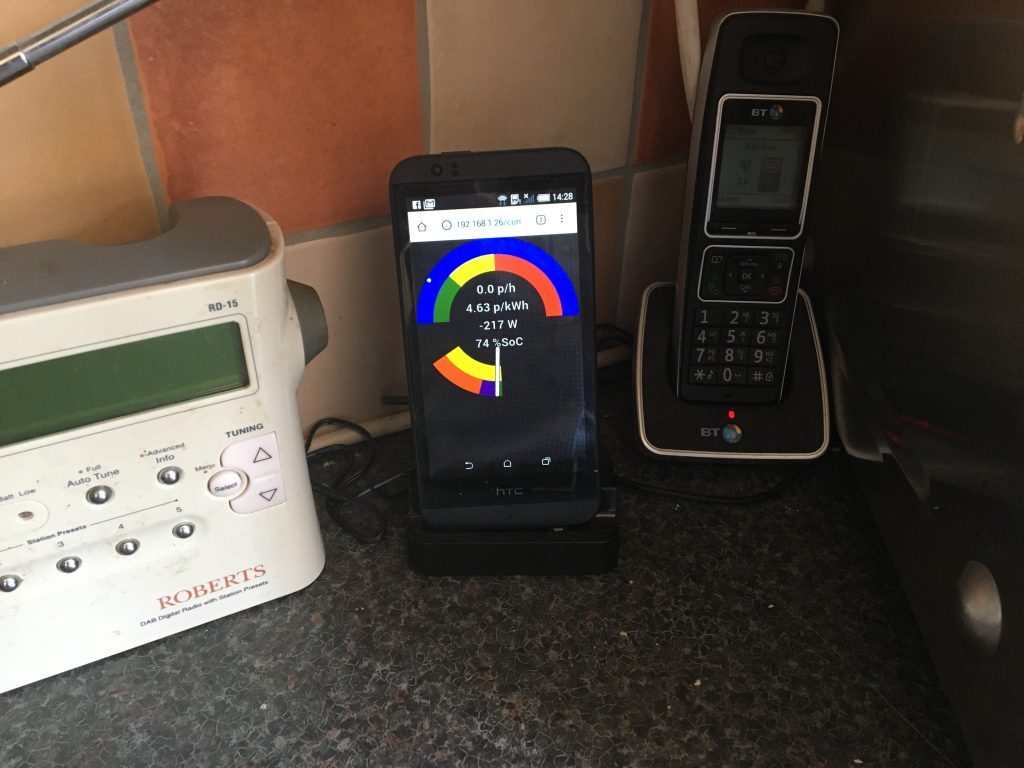
Much of my energy smart equipment is divided between my study and the the airing cupboard. Each has a Powerline adaptor allowing wired internet communication. The Home Energy Management System (HEMS) in the airing cupboard gets electricity pricing and solar predictions from the cloud and then directs the Powervault battery and the ImmerSUN diverter (partially) via the cloud. The Powervault is connected to the internet via an internet switch in my study and thence via the Powerline adapter. The ImmerSUN in the airing cupboard connects to the internet via a proprietary protocol to a bridge in my study and then onwards via the same internet switch.

The nine forms of communication are:

  1. Bluetooth – low power and low range device-to-hub communications for battery-powered smart home devices on Apple HomeKit.
  2. Ethernet – wired mains-powered internet devices
  3. Fibre broadband – high bandwidth connection from home to external internet
  4. ImmerSUN proprietary – wireless communications between mains-powered ImmerSUN devices: power diverter, bridge to internet, and remote current sensors
  5. Radio 868 MHz – radio signal to control car wallbox in garage from home
  6. Powerline communications – carries the internet over mains house wiring using mains-powered adapters
  7. Thread – an extension of Bluetooth allowing signals to travel from distant devices via nearer devices to a hub thus extending the area that a hub can cover
  8. WAN – external connection to a smart meter
  9. ZigBee HAN – internal connection between smart meters. ZigBee, like Bluetooth, is a low power low range protocol suitable for battery-powered devices (like a gas meter). It can be used for smart devices like Bluetooth, but in the form used in smart meters is secured and not accessible directly to consumers.

Making smart choices – smart tariff smart comparison revisited

Back in February I previewed a new online tool to help consumers choose an appropriate smart tariff in Making smart choices – smart tariff smart comparison. There are numerous price comparison sites that work for standard energy tariffs, but smart tariffs are generally excluded from such sites. Price comparison sites typically ask for a token meter read or guess consumption based on typical bills for similar homes, but this online tool takes actual half hourly consumption from your own electricity meter so its analysis is very sophisticated in comparison. As a research tool the tariff names are anonymised, although with a little thought they can be decoded.

Prior tariff versus nearest cost alternative

The above graph shows my prior Octopus Agile tariff being very competitive for an extended period but then losing top spot in January 2021 to an Octopus Go Faster tariff. Subsequently I’ve moved to a related tariff called Octopus Go (without the ‘faster’). The Go tariff offers four hours of electricity overnight at 5 p/kWh for a fixed period while the ‘faster’ derivative offers 5 hours at a slightly higher price and with choice of the discounted hours.

New comparison 6 months later

The newer graph above shows a widening gap over the last three months with the Go tariff being increasingly advantageous as rising wholesale prices force Agile pricing higher and higher. Since Agile is linked to the daily wholesale markets the price can rise (and drop) very quickly. Go on the other hand is not just cheaper but fixed for a year. July’s analysis shows Go being less than a third of price of Agile for my usage.

Go is ideally suited for EV charging. You could also get a sign-on bonus of £50 by clicking this link to move to any Octopus tariff.

Smartening up

We will shortly have been in this house for six years. During that time I have created three smart control systems that improve my energy costs or efficiency:

  1. heating controls to minimise gas purchase
  2. self-consumption controls of the electricity generated by my solar panels to maximise value of self-consumption
  3. smart tariff controls to buy grid electricity at the lowest price

Heating Controls

Most homes have a single heating zone with one timer and potentially one thermostat controlling the whole house with perhaps some thermostatic radiator valves (TRVs) capping the temperature in specific rooms.

By contrast we have seven heating zones created by electronic temperature control valves (eTRVs). Each zone has its own timer. There is no central timer or thermostat. Each eTRV can summon the boiler on when cold rather than simply cap the maximum temperature like a TRV.

Some rooms also have links to other smart devices such as disabling room heating when the window is open or turning off heating early when there’s no movement in the room.

The intent is to save energy by only heating rooms that are in use.

Self-consumption Controls

These controls manage the diversion of any excess output from my solar panels rather than give that energy to the grid. The loads are prioritised as follows:

  1. Powervault storage battery (fully proportional)
  2. Car charger (stepped proportional driven by ImmerSUN relay output)
  3. Hot water (driven by ImmerSUN fully proportional output)

Last year these controls helped me to use over 90% of the output of my solar panels avoiding buying £100s of electricity and gas. The priorities are set to maximise value – #1 avoid daytime electricity use at 16 p/kWh, #2 avoid car charging at 5-16 p/kWh, and #3 avoid gas consumption at 2.96 p/kWh.

Smart Tariff Controls

These controls manage my electric devices for lowest grid energy cost. The controlled devices are:

  • Battery storage (Powervault)
  • Dishwasher
  • Electric car charger
  • Hot water heating (ImmerSUN)
  • Washing machine

The hardware that has this control is known as a Home Energy Management System (HEMS). My HEMS is based on a simple computer known as a Raspberry Pi. The HEMS uses foreknowledge of the electricity price and predicted solar panel output to determine when best to run the above devices. It was designed around a tariff called Octopus Agile which has 48 half-hourly prices that change daily, but is currently working with a simpler two-rate smart tariff.

deviceCentral Heatingself-consumptionsmart tariff
Battery Storage#1X
Central Heating BoilerX
DishwasherX
Electric car charger #2X
Hot water heating#3X
Washing machineX
Devices controlled by smart systems

Most of these solutions are made up of commercially-available items that I have perhaps combined in a way not anticipated by their manufacturers. In particular:

  • I created a relay module to enable the gas boiler to be turned on remotely and programmed a series of logical rules for the Apple TV’s that act as the controllers.
  • I identified a way to prioritise different self-consumption devices by configuring their current clamps.
  • I built my smart car charger integrating various items of hardware and writing the ladder logic program that runs it.
  • I built the HEMS from commercially-available parts and wrote the software that runs on it to control my devices.

Farewell Agile, Hello Go

For the last few years I’ve been a user of, and advocate for, Octopus Energy’s Agile tariff. This unique tariff in the UK is linked to half-hourly wholesale electricity prices and gives the user 48 half-hourly electricity prices each day. As the price of electricity varies considerably from one half hour to another, customers like myself could save quite a lot of money by shifting consumption around such as by charging the car or running the washing machine at different times.

Example Agile electricity bill – average 4.48 p/kWh over the billing period

However in recent months wholesale electricity prices have been high. My understanding is that this is from a combination of factors including aging power stations being offline for maintenance and Brexit-related issues around market access and trading. The result of this is that while there’s still variation by time of day in the wholesale markets the pricing is always relatively high. The Agile tariff also applies a multiplier to the market prices to cover Octopus Energy’s costs which drives the retail price even higher. Thus there really doesn’t seem to be a financial benefit to such extreme agility compared to some more conventional tariffs. (I’m not criticising Octopus Energy here – they are completely transparent about how this tariff works)

As a result of this a few days ago I switched to another Octopus tariff – Go. Go is more like a traditional time-of-use tariff – like Economy 7 in the UK – except that Go provides a shorter cheap window of 4 hours not 7 hours and a deeper discount. Go’s headline pricing is a cheap 5p/kWh from 00:30 to 04:30 with a higher standard rate that varies by region and gets adjusted from time to time. My standard rate is 15.96 p/kWh fixed for 12 months.

My electricity consumption is managed by the Home Energy Management System (HEMS) which has been optimising my energy costs for some two and a half years. Having decided to move away from Agile then I need a quick change for my HEMS to work with the new Go tariff. My quick solution (a whole two lines of code) is to edit the Agile costs on the fly each day to replace Agile costs with Go costs in the 4 cheap hours – a softy of hybrid of Agile and Go. Additionally I’ve used an existing configuration file to apply a price cap at which the battery can be charged from the grid preventing grid charging above the 5 p/kWh price as it makes no economic sense to charge the battery at the higher Go price to avoid buying electricity at the same higher grid price. A side-effect of this (which I quite like) is that daytime consumption is still managed in a grid-friendly manner via the Agile price even though I’m physically paying the Go price. (I may have to think about this further if the Agile price starts to drop below 5 p/kWh)

The immediate effect of the standardised Go price at night is that the behaviour of the HEMS for EV charging, dishwasher, washing machine and water heating has all standardised too. All these now start at 00:30 except for water heating which now never happens from the grid since mains electricity is now always more expensive than gas. Dishwasher and washing machine may also be scheduled for during the day if anticipated solar production is high enough, while EV charging and water heating may also happen from solar in a closed loop manner.

Battery charging is a little less standardised at night. Battery charging now varies in a range of 0 to 4 hours overnight varying with anticipated solar production the next day. In the last few days I’ve seen both bookends – no hours of battery charging when the day ahead will be sunny and 4 hours of charging when the day ahead will be more mixed. During the cheap window, if the battery is not charging, then the battery is not permitted to discharge. Yesterday was one of the mixed days.

Electricity consumption on Go

As can be seen from my smart meter data above, almost all the electricity consumed was at night in the cheap window, so my average electricity cost for the day will be very close to 5p/kWh.

Battery behaviour on Go

The battery charging and discharging is shown by the blue and gold lines above. Initially the battery discharges to avoid paying 16 p/kWh to the grid, then it charges for 4 hours at 5 p/kWh, then there’s some further discharge until the sun rises, in the morning there’s some sun which charges the battery in a somewhat variable manner, then in the afternoon it’s sunnier and the battery reports some ‘Grid Power Out’ which is actually power available for lower priority self-consumption devices, and finally the battery discharges through the evening. There would have been some opportunity to charge the battery more during the afternoon but the battery was already nearly full.

The ImmerSUN gives probably the most complete overview of the home, albeit at only hourly resolution as follows:

  • Purple is the electricity consumption (home, battery, dishwasher, washing machine etc)
  • Red is bought electricity (58% of total)
  • Green is generated electricity (42% of total)
  • Blue is electricity used for water heating (which is all from generation and part of the 97% self-consumption)
  • Teal is electricity export (which is minimal at 3%)

In conclusion the change to Go seems to be saving me a significant amount of money compared to current Agile prices, and the hybridisation of the tariffs seems to be working well from a control perspective giving me the financial benefits of Go and should deliver the grid-friendly behaviour of Agile (although I’d need poorer weather to demonstrate that).

If you are a GB resident and would like to switch to Octopus Energy (who have incidentally been Which-recommended for years) then we can each earn £50 credit from this referral link.

Payback time

It been over a year now since I last reviewed what return I was getting on my investment in energy smart technology – solar panels, battery storage etc – so I think an update is due. This time I’m going to take the input data from my immersun system – one year of data from start of June 2020 to end of May 2021.

Diverted – this is where the immersun sends any surplus solar electricity to my immersion heater to make hot water. In 2020/1 we diverted 1056.6 kWh to hot water saving gas at 2.82 p/kWh. However the gas boiler isn’t 100% efficient losing heat both via the flue to the outside world and also via the hot water pipes to the home rather than hot water. If we assume 80% efficiency at the tank then 2.82 p/kWh as gas at the boiler is 4 p/kWh as heat in the tank. 1056.6 kWh at 4 p/kWh saved £37.25.

Exported – this is where I’m unable to use the solar power that we generate and it overflows into the grid. I’m not paid for Export so this is worth nothing to me.

Generation – this is the energy that we generate in the solar panels. I’m on the UK’s legacy Feed-in Tariff (FiT) scheme which pays me to generate electricity. In 2020/1 I was paid 14.65 explicitly for every kWh that I generated. I also received deemed (rather than metered) Export which paid 5.5 p/kWh on 50% of the kWh that I generated (which is where the ‘deemed’ part comes from). 5.5 p/kWh on 50% is equivalent to 2.75 p/kWh on 100% of the Generation making my revenue 17.4 p/kWh per kWh generated or £693.51 on the 3985.7 kWh that I actually generated.

Imported and House – these are respectively the electricity that I buy from the grid and that which I used within the home including appliances and car charging, some of which will comes from my own solar panels. The difference between House and Imported is the electricity that I used from my solar panels which would otherwise have been bought from the grid. If I assume that each kWh that I use from my solar panels avoids buying a kWh of electricity from the grid at 16.36 p/kWh (current Energy Saving Trust value for the average UK electricity price) then I avoided buying £423.81 of electricity by using the output of my solar panels.

Diverted1056.5 kWh*£0.04=£37.25
Exported338.6 kWh*£0.00=£0.00
Generated3985.6 kWh*£0.17=£693.51
Imported4748.9 kWh*-£0.16=-£776.92
House7339.4 kWh*£0.16=£1,200.73
Total£1,154.56
Return on smart energy investment @ 16.36 p/kWh grid price

With an investment of £8,670, £1,154 represents 7.5 years to pay back the capital invested.

I’m actually on a smart tariff so my electricity cost in this period at 8.05 p/kWh was significantly less than the UK’s average 16.36 p/kWh. This lower price will arguably reduce the value of the energy generated by the solar panels for self-consumption, but equally the ability to maximize the value of a smart tariff is itself a saving.

Diverted1056.5 kWh*£0.04=£37.25
Exported338.6 kWh*£0.00=£0.00
Generated3985.6 kWh*£0.17=£693.51
Imported4748.9 kWh*-£0.08=-£382.29
House7339.4 kWh*£0.08=£590.82
Total£939.29
Return on smart energy investment @ 8.05 p/kWh grid price (excluding the tariff benefit itself)

Using my actual average energy price rather than the higher UK average grid price pushes down the return by over £200 (£929.29 versus £1,154.56). However the costs of buying the imported 4,748.9 kWh falls by £394.63 through the tariff benefit, increasing the annual return to £1,333.93, and reducing the payback period from 7.5 to 6.5 years.

Thus, had I invested in this technology at one time back five and a half years ago and shortly after we moved to this house, then we’d have been in sight of payback with 1 or 2 years left. In practice of course I’ve made the investments at different times (solar first five and half years ago, battery around a year later, smart tariff later still), so my payback will be achieved a little later.

A snapshot of the ImmerSUN diverting to hot water

Some other statistics:

  • Of solar panel output:
    • 91.5% replaced bought energy (self-consumption)
    • 65.0% replaced bought electricity
    • 26.5% replaced bought gas for water heating
    • 8.5% was exported to the grid
  • Of incoming electricity:
    • 54.4% was from the grid
    • 45.6% was from the solar panels (“green contribution” in ImmerSUN’s terminology)

Making smart choices – smart tariff smart comparison

Regular readers will know that I’m into smart electricity tariffs as a means to save money and deliver a greener lower carbon electricity grid. In the last 12 months we’ve paid an average 7.2 p/kWh for electricity when we weren’t using our own from our solar panels. However you’ll never find these tariffs on price comparison sites who will happily ignore smart tariffs while earning commission by switching you to a standard flat rate or Economy 7 tariff that makes little difference to your costs versus what you may already have been paying. I’ve thus been pleased to support a project to develop a tool to help choose between these smart tariffs which are completely ignored by the existing switching services and price comparison sites and apps.

The project is now testing its solution.

My usage and costs versus nearest rival tariff.

The system under final testing works in a completely different manner to the regular services. Rather than ask a few questions about consumption or costs, the new tool asks about smart meter details and then loads a year’s data indirectly from your smart meter. It thus knows precisely what electricity you consumed over the prior 12 months. The tool also asks about your flexibility to shift load to cheaper times in fairly simple percentage terms and then shows a range of tariffs (currently for testing real tariffs with false names) and their average monthly costs. You can overlay the costs of each alternative tariff in turn over your existing costs. You can see that, even with maximum flexibility, I’d have paid an extra £116 annually on the nearest tariff to my existing tariff.

You can find the demonstration system here https://smarttariffsmartcomparison.org/

No fuss fuse

As we look to install a second electric vehicle charger that becomes a challenge for the electrical supply to our home which is limited to 60 Amps. I recently saw a page online by which our DNO (District Network Operator) – UKPN – could be requested to install an uprated fuse.

(Some readers may be curious regarding the irregular size of the hole around the cutout and meter. When we looked around the house I recall reflecting upon the fact that I didn’t know where the meters and consumer unit were. The mystery was explained when we moved in and these items were found to be behind a false wall in what is now my study having previously been concealed by pictures. We continued the practice by buying pictures to conceal three holes in the wall (now four) covering: electricity meter, gas meter and consumer unit (adding generation meter and isolator for solar panels).)

I’m delighted to report how smoothly the change went. I was advised that it might be the case that the work could not proceed on a first visit, and that it might be necessary for my electricity supplier to update meter and/or cables from meter to consumer unit; but the installation proceeded on the first visit with not only the cutout changed from 60 to 100 Amps but also the cables between the cutout and the meter renewed. All of this at a price of precisely nothing.

I had been reasonably confident in the meter as that had been renewed almost exactly two years ago when we moved from Economy 7 to a smart tariff, but I was less clear about the cables between the meter and the consumer unit. In the event all was fine.

The extra 40 Amps should now mean that I have no issues adding a 7.4 kW car charger which draws 32 Amps. I have previously posted about the new car charger. My task of writing the software for it is now considerably simplified as I shouldn’t need to worry about managing the after diversity maximum demand of the house to not exceed 60 Amps, and can concentrate on the other smart controls – tracking my solar surplus and responding to the smart tariff.

Inducted into the hall of fame

One of the features of our home is the all-electric kitchen. We do have gas for space heating and as a back-up on the hot water for days that are both dull and have relatively high cost electricity, but the kitchen is all-electric. I have to say that this was not our choice, rather the kitchen came that way when we bought the house five years ago. We have replaced the oven in the meantime, but until today the hob was that bought with the house.

Unfortunately the hob suffered a failure of the two of the rings and today we’ve replaced it like-for-like with a new inductive unit. Inductive is attractive as it’s relatively efficient, but I was struck by the fact that the one hob required a 32 Amp supply, but the new one manages with a 13 Amp plug.

Bosch PUE611BF1B inductive hob.

So, by what magic does the new hob use less than half the power of its predecessor?

itemold hobNew hob
Smallest ring1,200 Watts1,400 Watts
Second smallest 1,400 Watts1,800 Watts
Second largest1,800 Watts1,800 Watts
Largest ring2,200 Watts2,200 Watts
Total *6,600 Watts3,000 Watts
Tabulated of maximum non-Boost power per ring with manufacturer’s total

The first thing to observe is that the sum of the ring powers does not equal the manufacturer’s total for the new hob, although it does for the old hob. The second would be that the sum of the new ring powers at 7,200 Watts is more than the sum of the old ring powers even though the required total is less!

The answer is that the new hob features power management capability. In any hob the rings will spend much of their time cycling on and off to maintain the required heat. In the old hob all the rings might on at one time drawing maximum power, but a few moments later they might all be off. However the power management in the new hob the total power would be levelled out so that the average over time might be the same, but the peaks smaller and the troughs shallower.

For most people this levelling out of the power demand would pass unnoticed, but for us it could be quite useful.

We do most of our cooking in the evenings for which, particularly in winter, power is taken from our Powervault storage battery with any excess from the grid as illustrated by the series of evening spikes in the image to the right. The Powervault has a relatively limited maximum power (hence the spikes) but as the new hob has power management then any spiking beyond battery maximum power capability should be reduced thus avoiding what, for us, could be peak rate electricity at 35 p/kWh on our dynamic smart tariff which is a direct cost save.

Bright revisited

Back in late 2018 I purchased a Hildebrand Glow Stick Consumer Access Device (CAD) to monitor my electricity consumption. A CAD is a consumer device that can be paired with domestic smart meters to provide the consumer with a means of reading the meter. All UK smart meters are supplied with a dedicated in-home display (IHD) to display energy consumption, which is also an example of a CAD. The Glow Stick pairs with the meters like the IHD but shares the data to the cloud from where it can be read either via an app (Bright) or another device using APIs.

Glow Stick CAD

Each smart meter effectively has two interfaces – a Wide Area Network (WAN) connection used for metering and billing and a Home Area Network (HAN) used for connection between meters (electric and gas), hub (embedded within the electric meter) and IHD. The HAN is also available for smart home devices.

“Network hub“ including Glow Stick

“Network hub” including (from top to bottom):

  1. Network switch providing additional hardwired connections to the internet, placed behind..
  2. TalkTalk router providing WiFi and 4 hardwired connections to the external internet, placed above..
  3. Network storage, placed above..
  4. Immersun bridge (left) and Glow Stick (right and forwards)

When I initially installed the Glow Stick it provided a very useful tool to see current and historic energy consumption, but the equivalent cost displays were incorrect (at no fault of Hildebrand) because the CAD correctly read the meter costs, but the meter was not sufficiently sophisticated to store the complex Agile tariff (where unit cost changes every 30 minutes).

I recently learned that Hildebrand now had the ability to take the tariff directly from Octopus Energy via API, bypassing the incorrect tariff data in the meter. A quick support email to Hildebrand confirmed that this was not only possible, but also that the cost data would be corrected back to when I bought the Glow Stick back in 2018. A few days later and the conversion was complete.

These two views show today’s part-complete data:

The screenshot on the left shows today’s part-complete energy data. That on the right shows the equivalent cost data. Had the unit rate been constant throughout the day then the two profiles would have been proportional, but instead the screenshots show the magnifying impact of the higher unit rates in the four to seven PM window with equivalent consumption to the late afternoon resulting in rather higher costs.

I should emphasise however that my average unit rate is very low as I usually have much higher consumption in low cost periods than I do in high cost periods.

My electricity bill to May 2020

One of my recent electricity bills had an average of 3.49 p/kWh ex-VAT. Half-hourly rates varied between around minus 10 p/kWh (I.e. I was paid to use electricity) to plus 25 p/kWh. A low average price was achieved by shifting electricity consumption to when the price was lowest.

My next step is likely to be to use the API to get the real time household load for load management as an increasing number of electrical consumers (potentially a second car charger) risks overloading my supply fuse if all loads were on simultaneously.

Monitoring the HEMS

For some time now I’ve been thinking about creating a real time display which pulls together data from a variety of sources around the home to provide an overview of what’s going on without the need to visit multiple web pages or apps. Until the last 10 days or so that involved little more than thoughts of how I might evolve the existing immersun web page with more content (I don’t have the skills to write my own app), but then about 10 days ago I saw an online gauge that someone else had created to show energy price and inspiration struck. Ten days later I have my monitor working, albeit not complete:

HEMS monitor

The monitor pulls together information from:

  • My electricity tariff for p/kWh
  • My immersun for power data (to/from: grid, solar, water, house)
  • My storage battery for power in/out and state of charge
  • My HEMS for electricity cost thresholds between different battery modes.

The gauge consists of two parts: (i) an upper electricity cost part and (ii) a lower power part.

The upper electricity cost part is effectively a big price gauge from 0 p/kWh to 25 p/kWh with a needle that moves each half hour as the price changes. It has various features:

  • The outer semi-circular ring (blue here) shows today’s relationship between battery mode and electricity price. Today is very sunny, so no electricity was bought from the grid to charge the battery, and this part is all blue for normal battery operation. If the days was duller and electricity was to be bought to charge the battery, then two further sectors would appear:
    1. a dark green sector from zero upwards showing the grid prices at which the battery would be force charged from the grid, and
    2. a light green sector showing when the battery is not permitted to discharge but may continue to charge from solar.
  • In inner semi-circular ring (green / yellow / red here) currently just colour-codes increasing electricity price, but will be used to show today’s prices at which car charging and water heating are triggered from the grid.
  • The current price per kWh is taken from Octopus’s price API, while the current cost per hour is derived both from this and the grid power from the immersun.
  • The needle grows from a simple dot indicating the price per kWh only when no power is drawn from the grid to a full needle when the electricity cost is 10 pence per hour or more.

The lower power part is effectively a power meter ranging from 5,000 Watts of export to the left to 5,000 Watts of import to the right. It updates every few seconds. It has various features:

  • The outer semi-circular ring (orange /maroon / green here) shows how power is being consumed:
    • orange – shows consumption by the house less specified loads
    • maroon – shows battery charging
    • blue (not shown) – shows water heating
    • green – shows export to the grid
  • The inner semi-circular ring (yellow here) shows the source of power. The sum of the sources should equal the sum of the consumers. The sources are:
    • maroon (not shown) – shows battery discharge
    • yellow – shows solar power
    • red (not shown) – shows grid power
  • The power value shows the net import or export from / to the grid, while SoC refers to the state of charge of the battery (0-100%). The combination of import power and electricity price gives the cost per hour in the top gauge.
  • The needle position shows net import (to the right) or next export (to the left). The needle should thus be to the left of the green sector, or to the right of the (unseen) red sector. Needle length show the full power being handled and is thus proportionate to the angle of the sector including all the colours in the lower gauge and extends from 0 to 5 kW.
Monitor installed on an old phone in the kitchen.

The gauge scales to fill the smallest of screen height or width and translates to be centrally positioned regardless of screen size. My intention is to display it on an old mobile phone as an energy monitor, but I can also access it on any web browser on any device within the home.