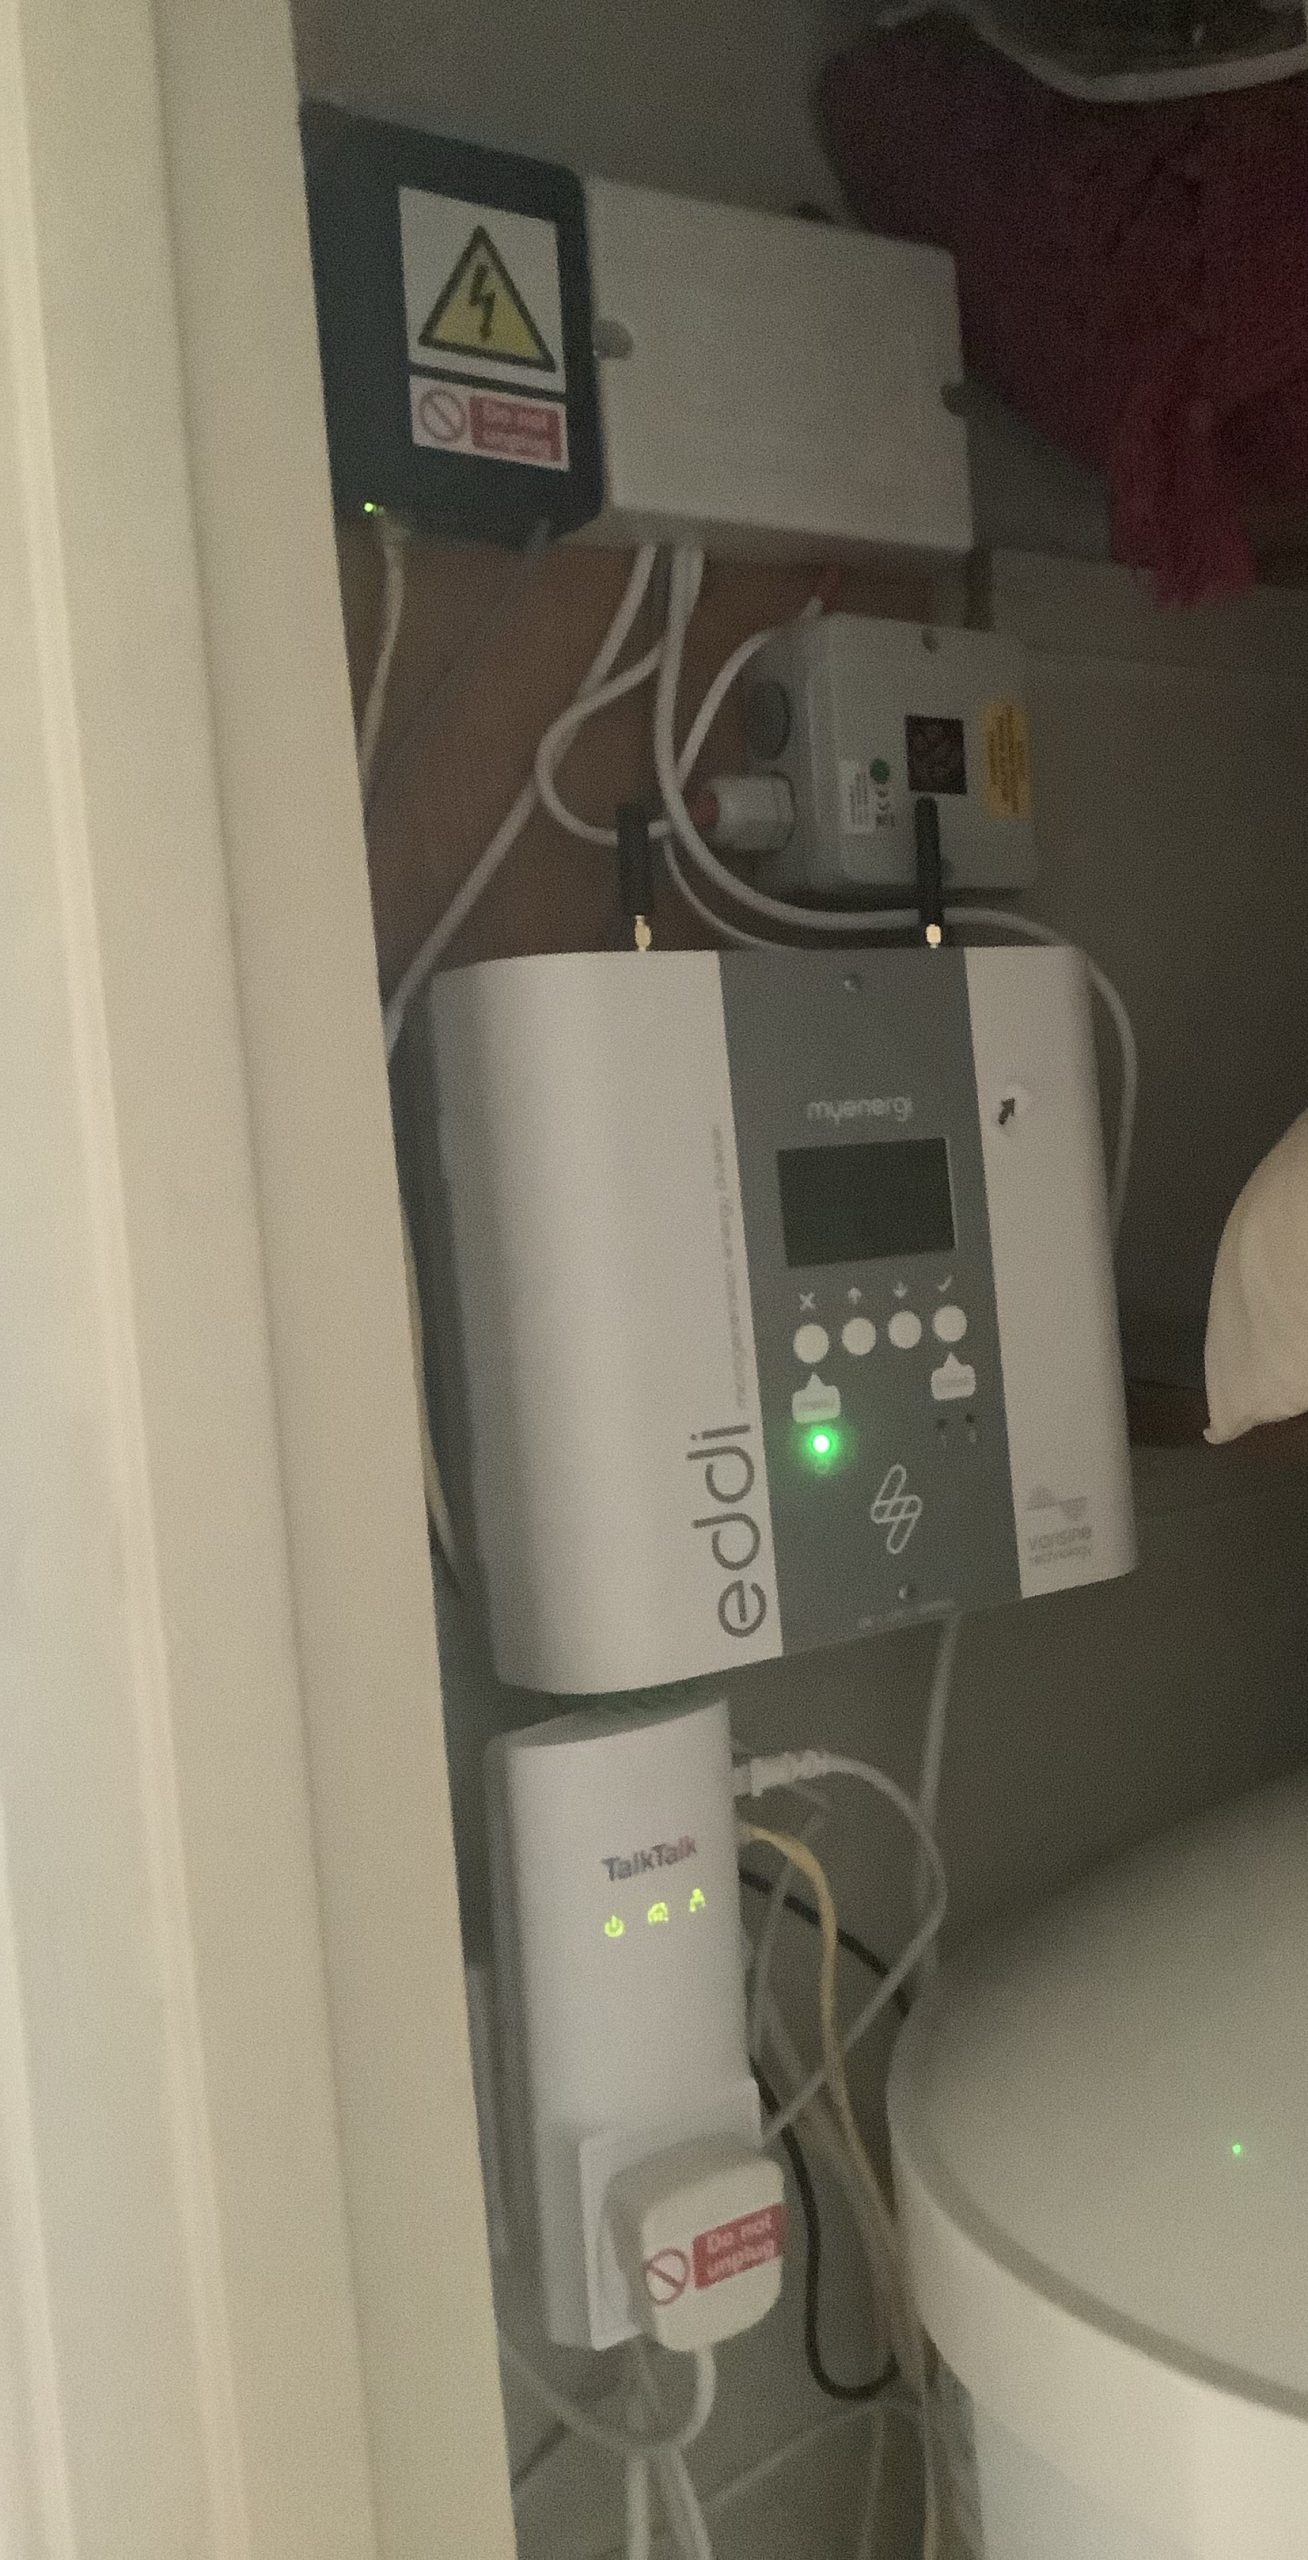
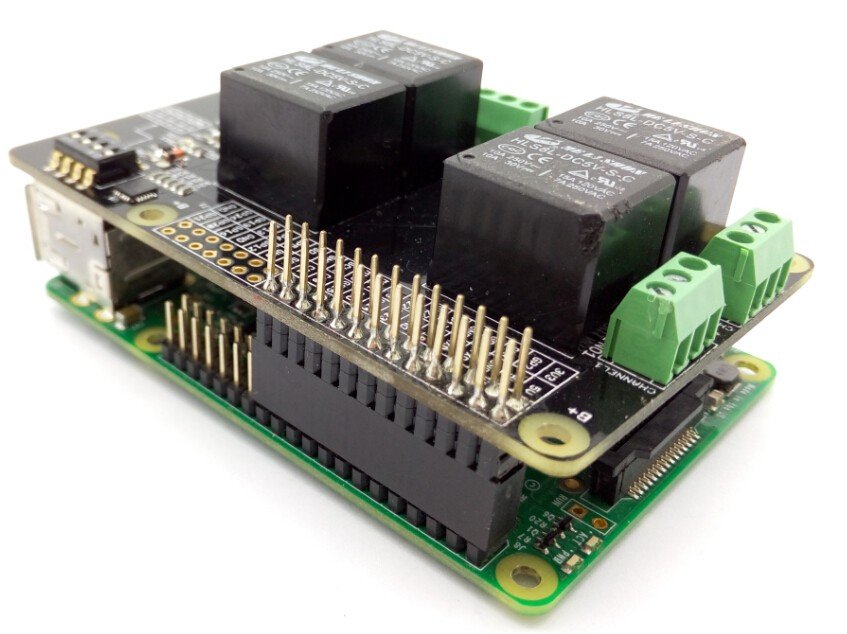
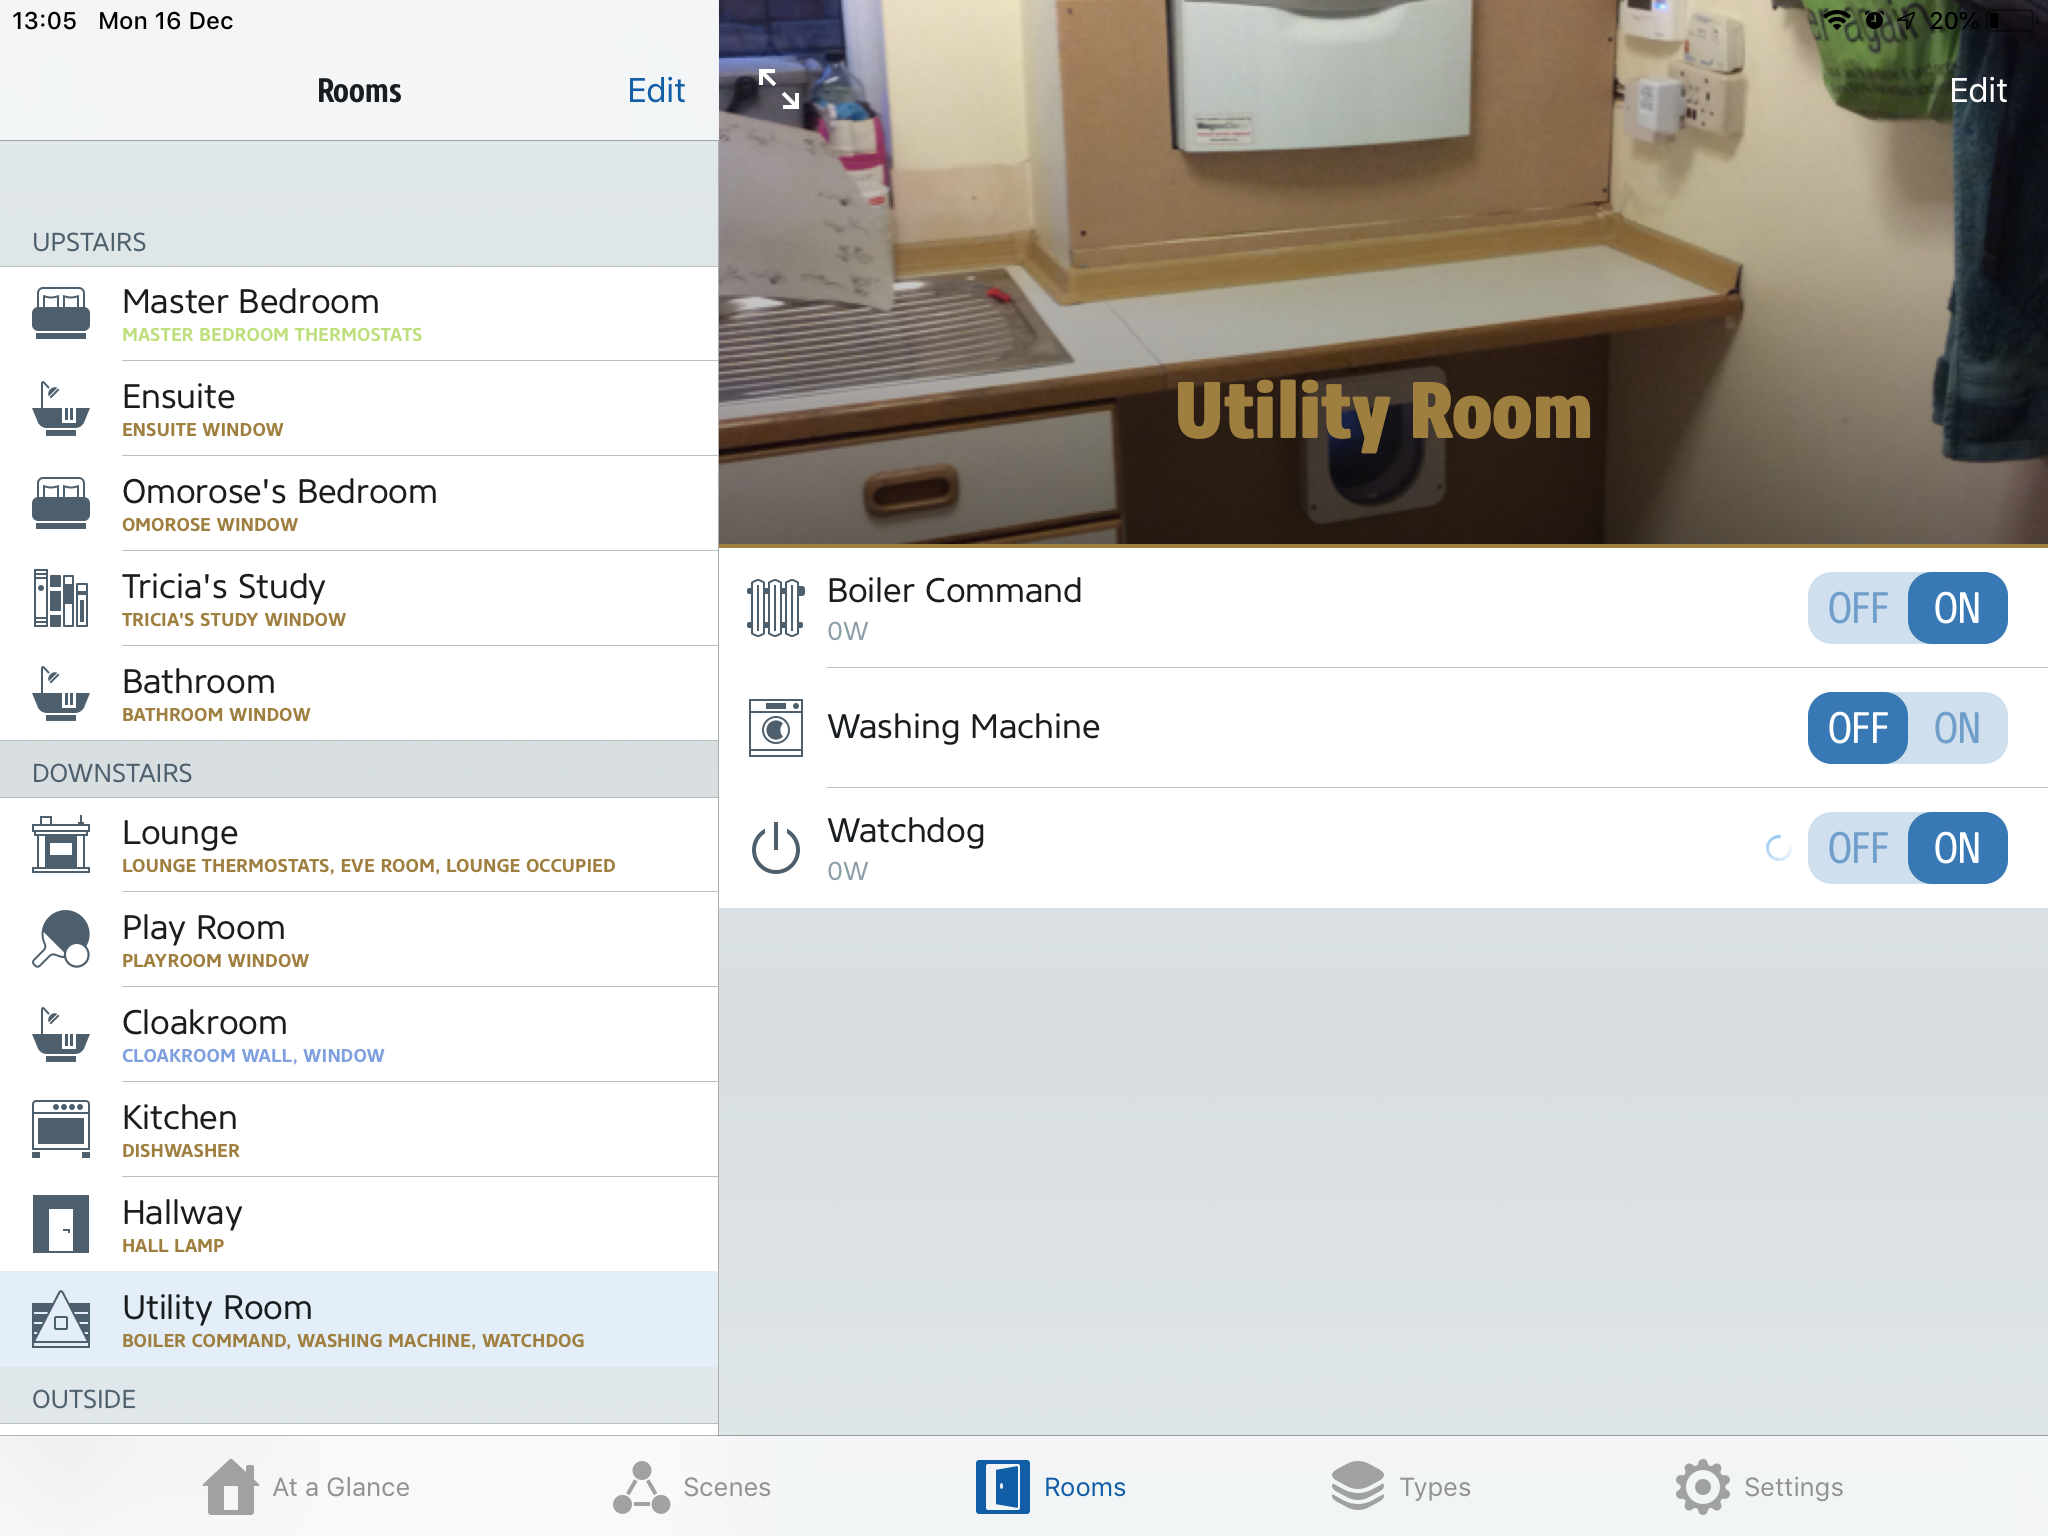
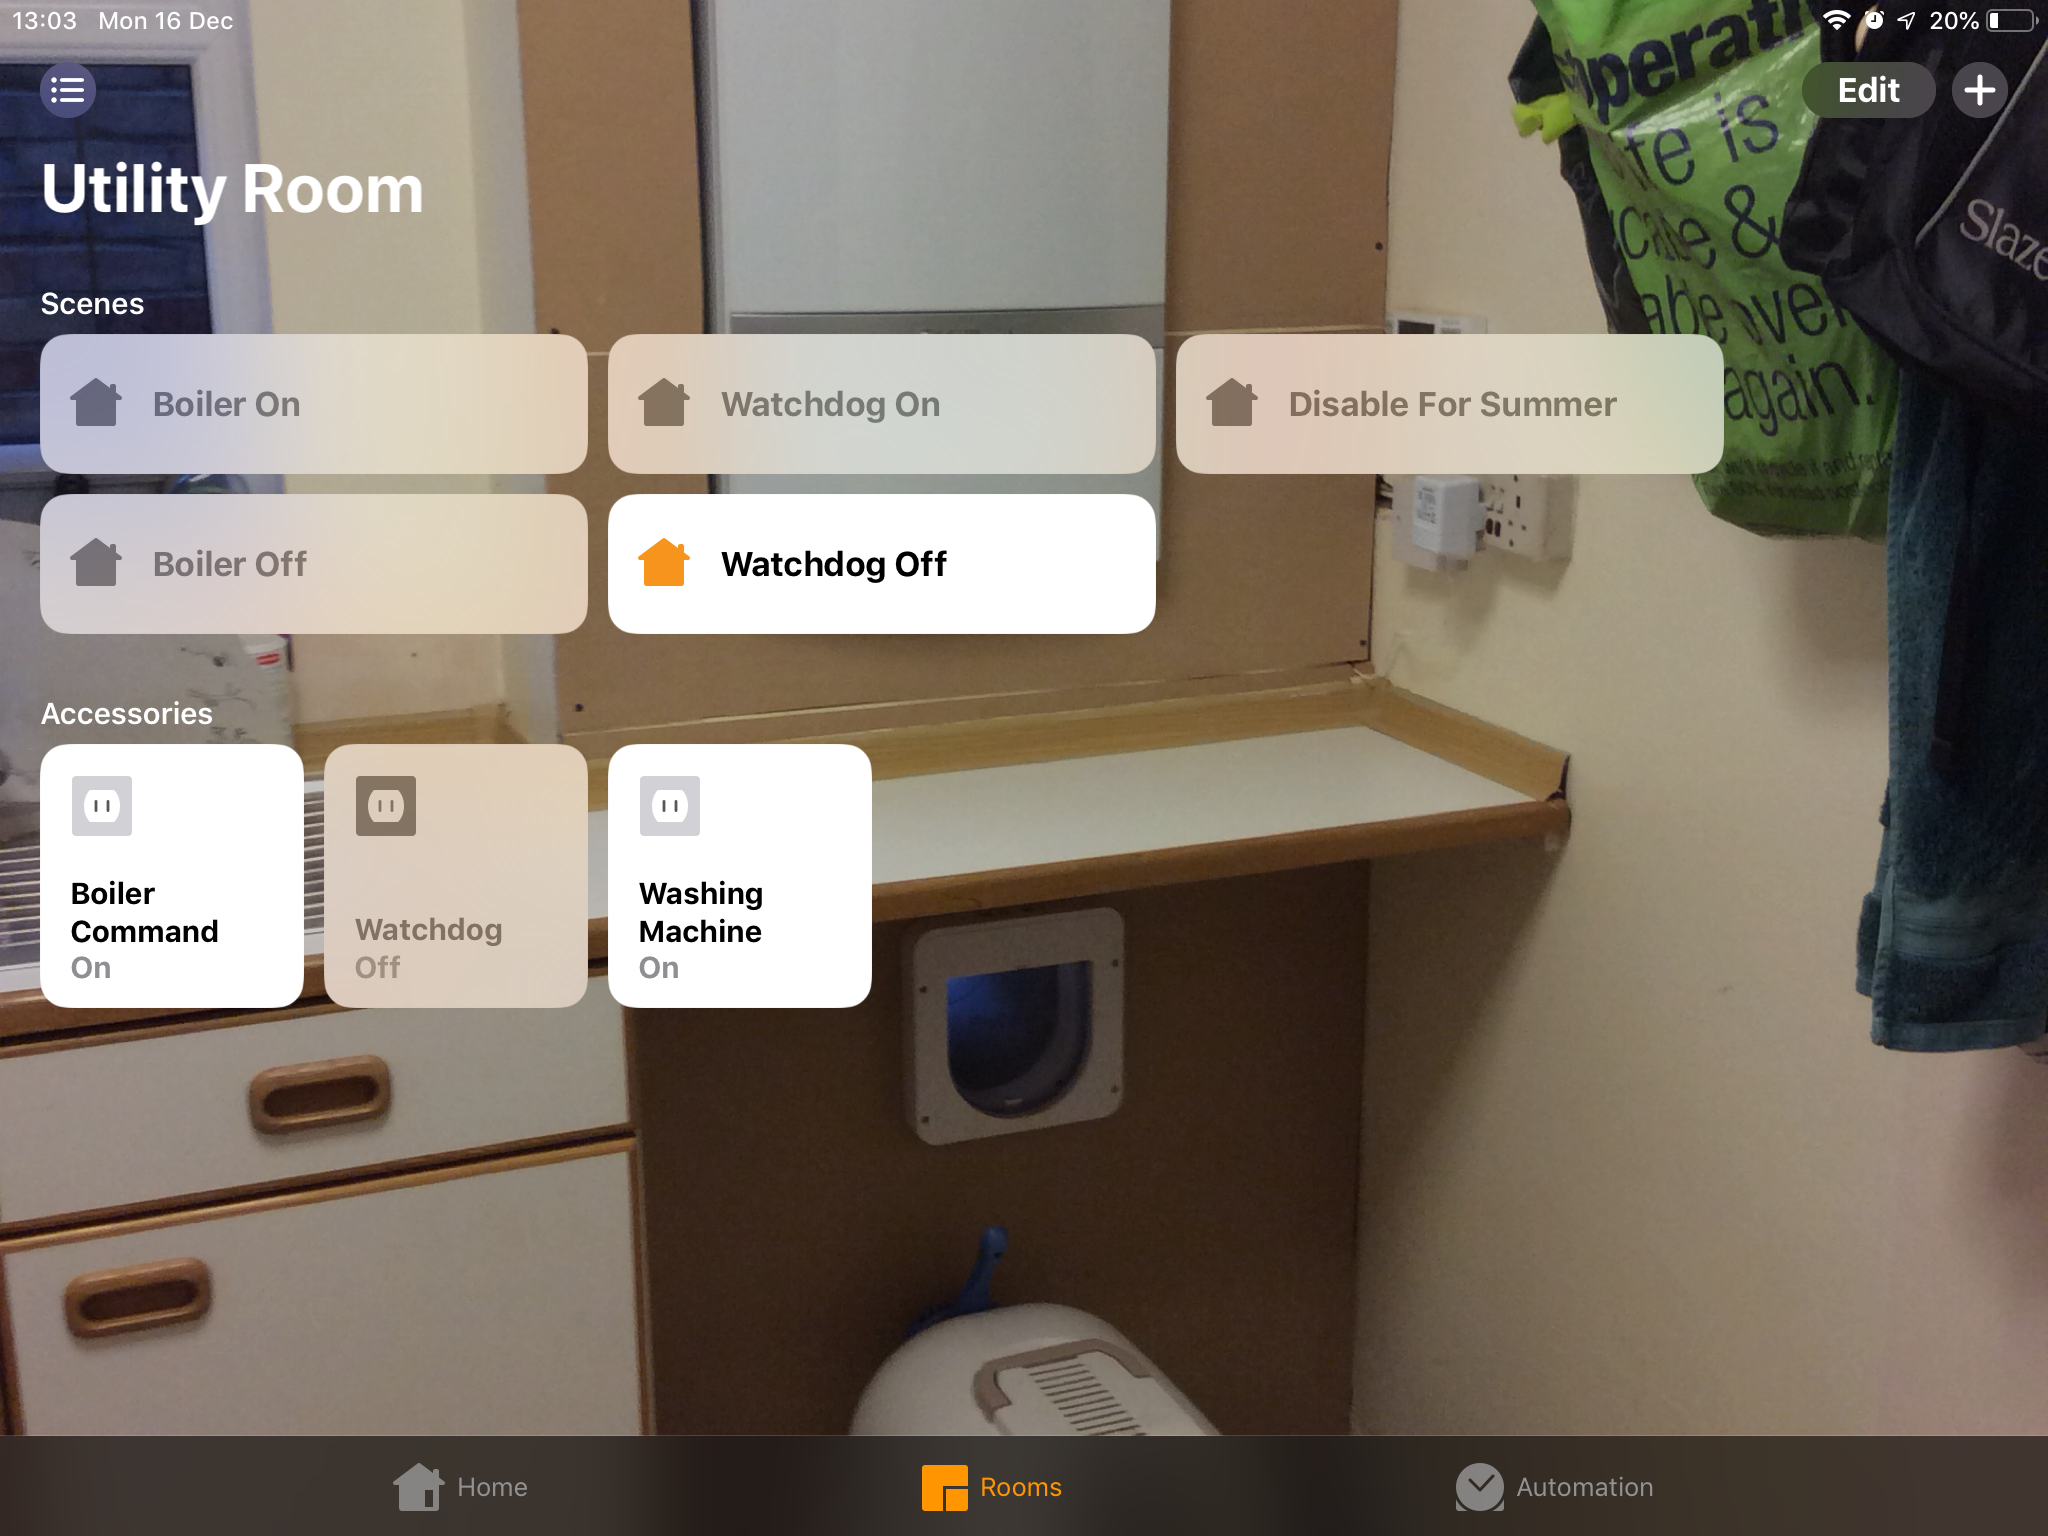
I’ve recently replaced the diverter which manages diversion of my surplus solar electricity to immersion heater for hot water and/or electric car charger. The new unit is a Myenergi Eddi. I also needed a Harvi to transmit the output of remote current sensors to the Eddi and an accessory digital input/output board to control my older car charger from the Eddi.
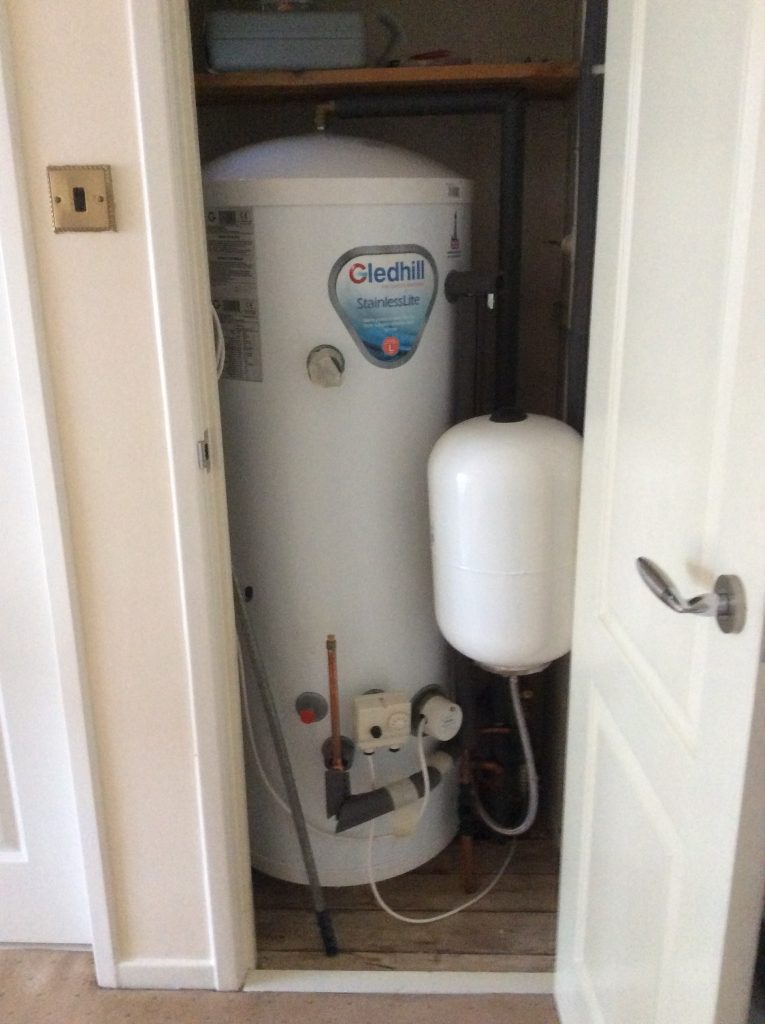
The panel below sits inside my airing cupboard for close proximity to the immersion heater in operation but lifts down as an assembly for maintenance.
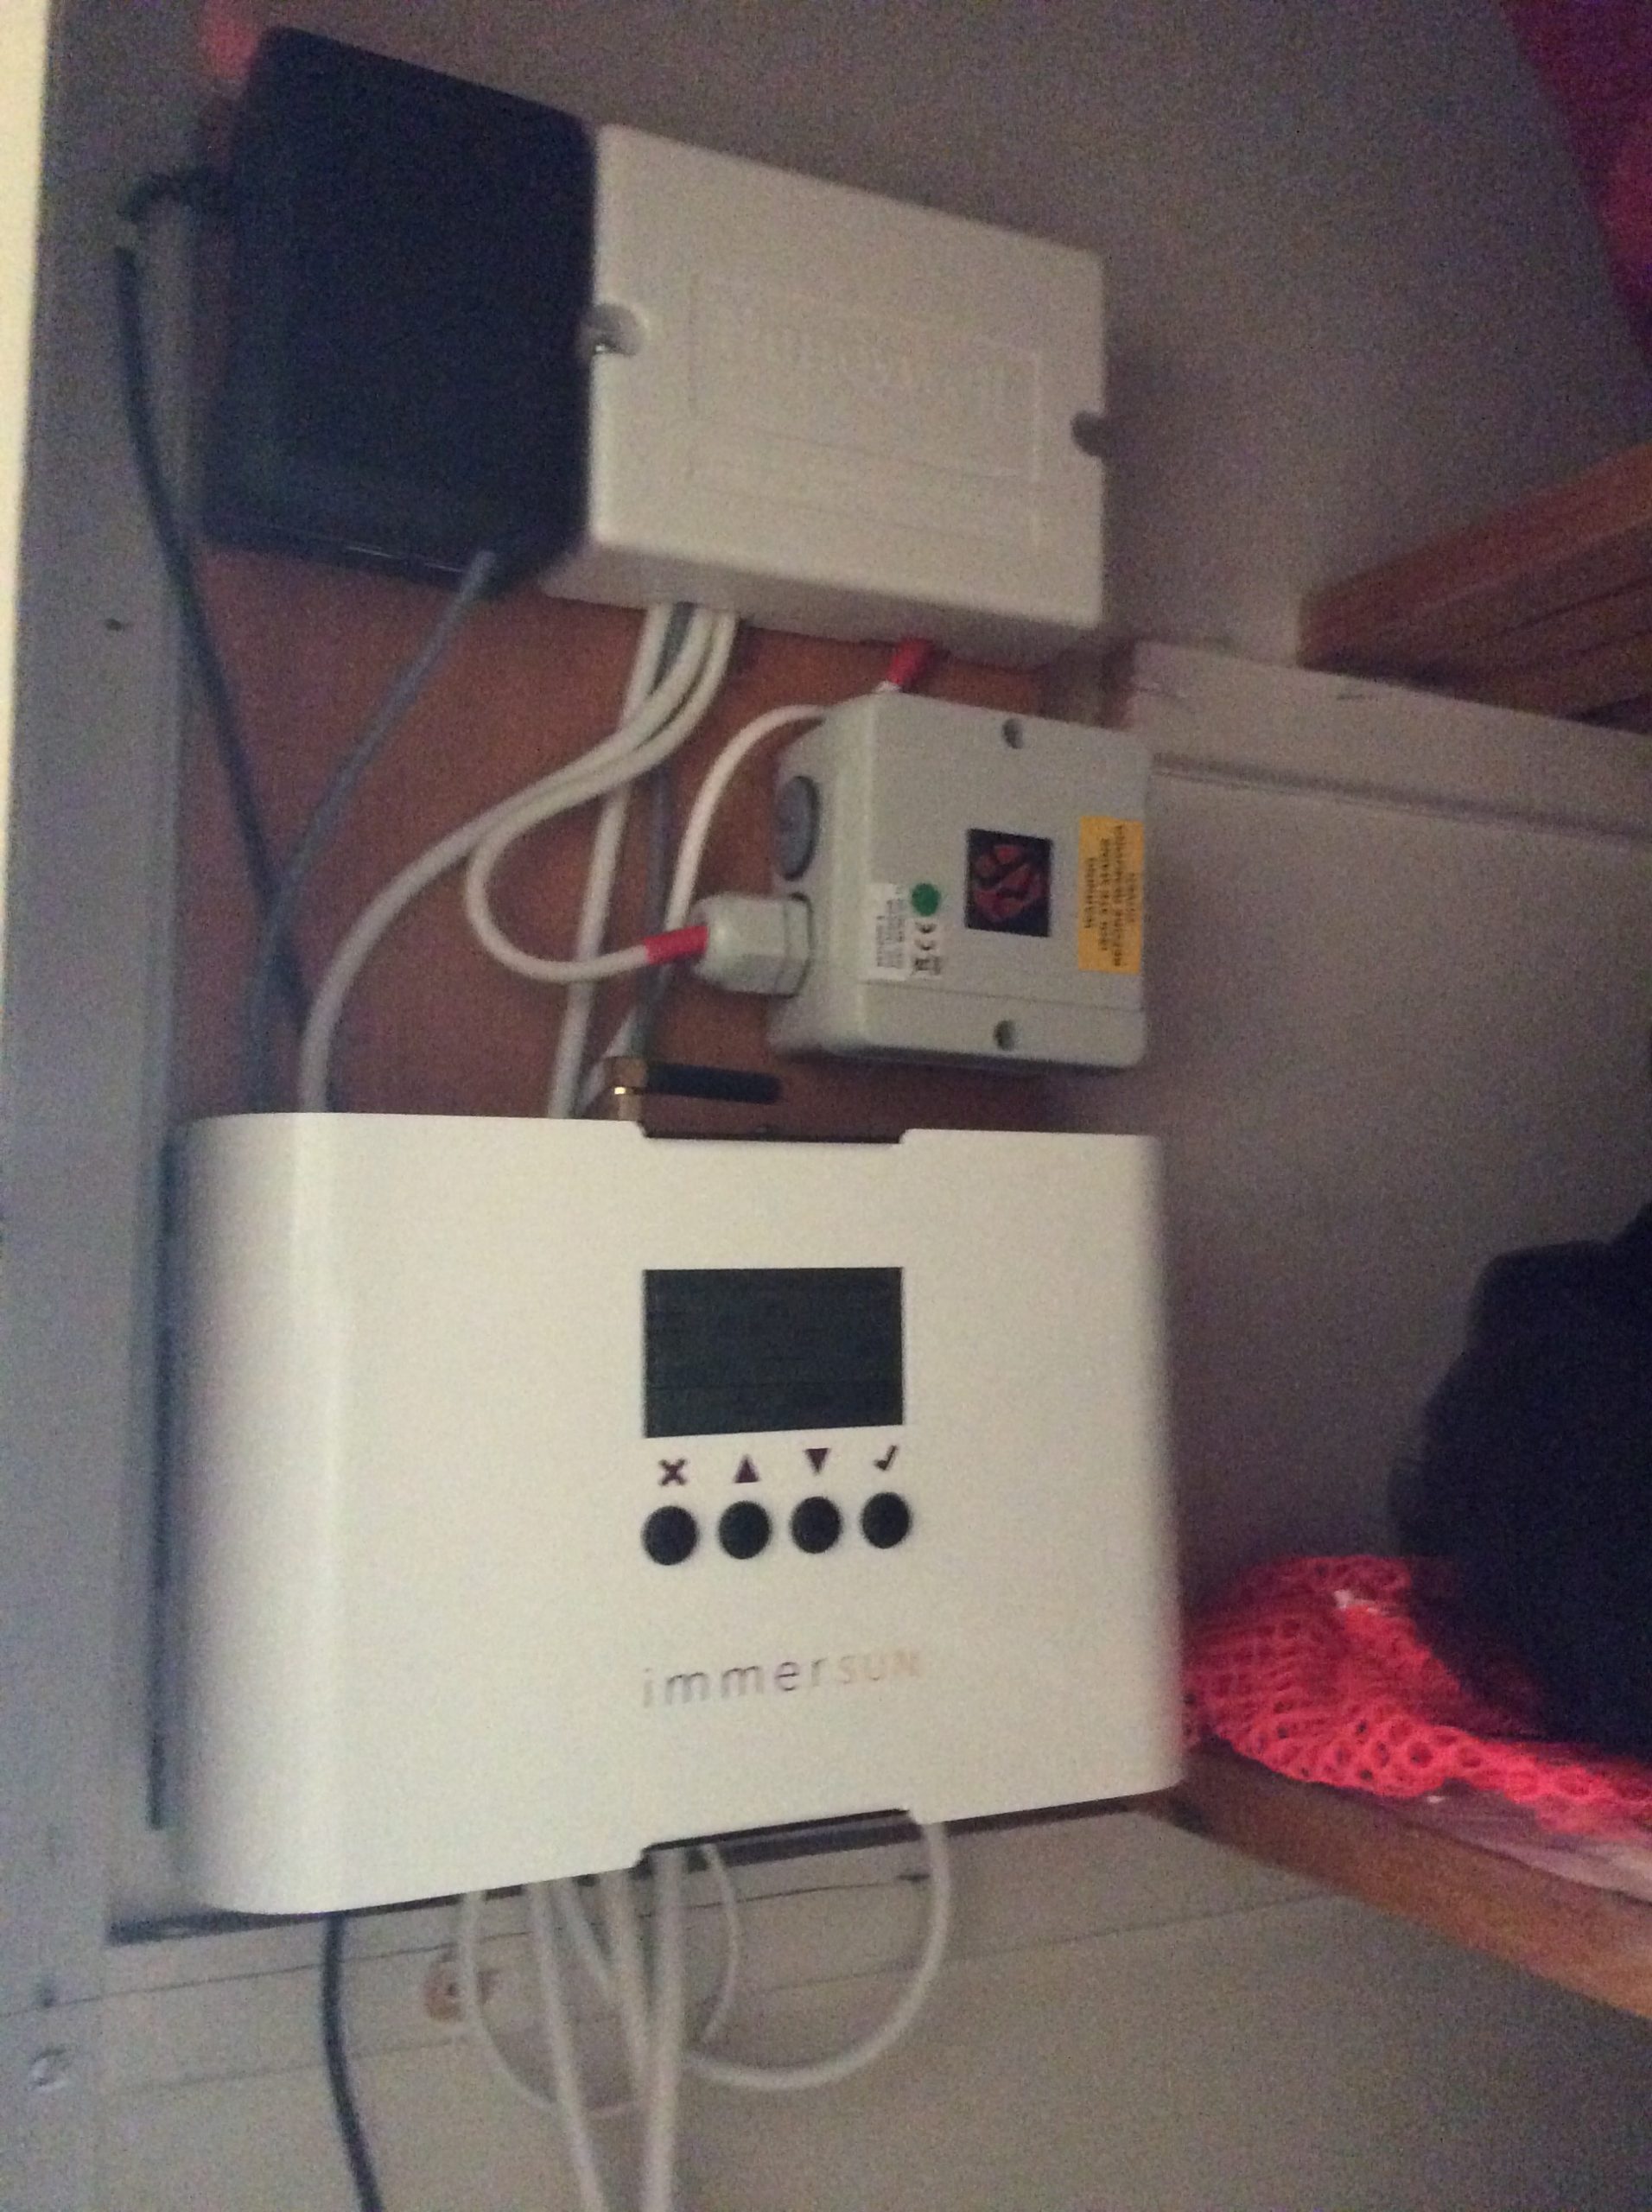
Eddi installed in airing cupboard
From top to bottom:
Home Energy Management System (HEMS) – left
Junction box – right
Transmitter to activate my older car charge point
New Eddi
TalkTalk powerline internet device which connects HEMS and Eddi to the internet over the house wiring (more robust that WiFi). There’s a mains socket behind which includes a USB output to power the HEMS. The mains plug in front powers the transmitter (above) and the various relay-activated operations.
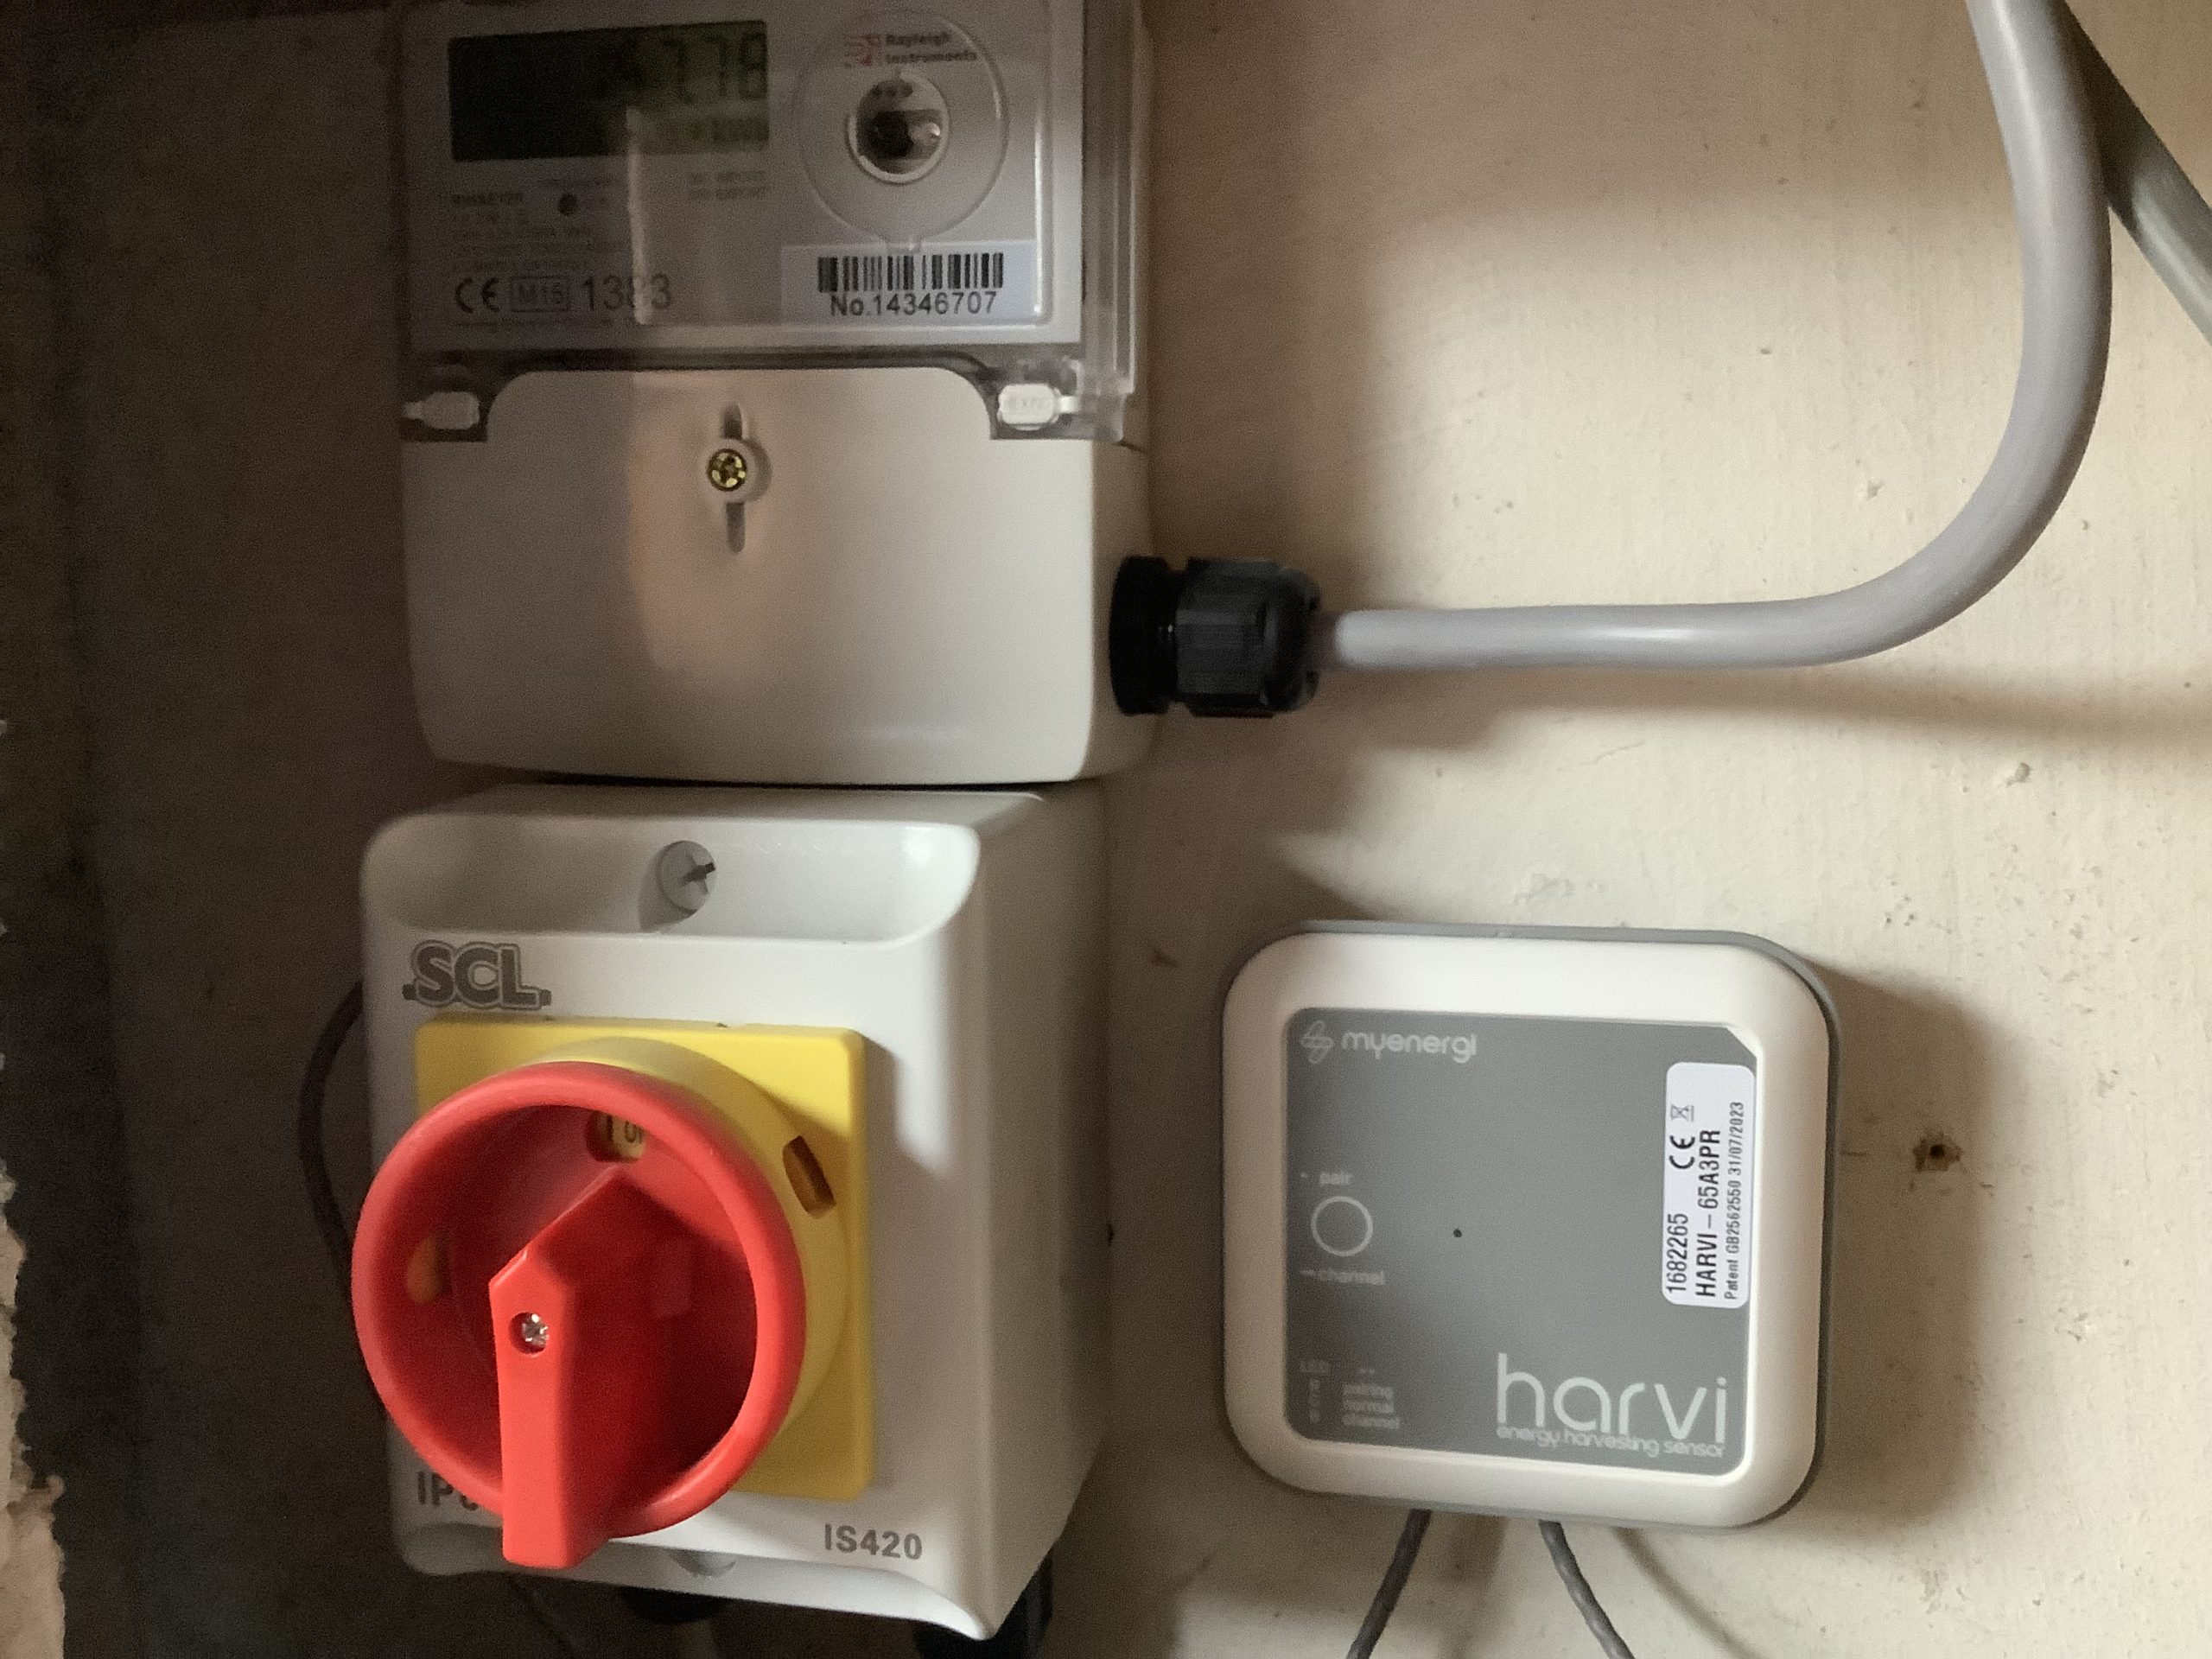
The Harvi is connected to two current clamps and transmits the signals from those clamps to the Eddi. Each Harvi can connect to three sensors but I only use two: (i) the import/export to/from the house and (ii) the output of the solar panels.
To the left on the Harvi is the isolator for the solar panels (which has a current sensor inside) and above is the generation meter for the solar panels.
Harvi transmitter
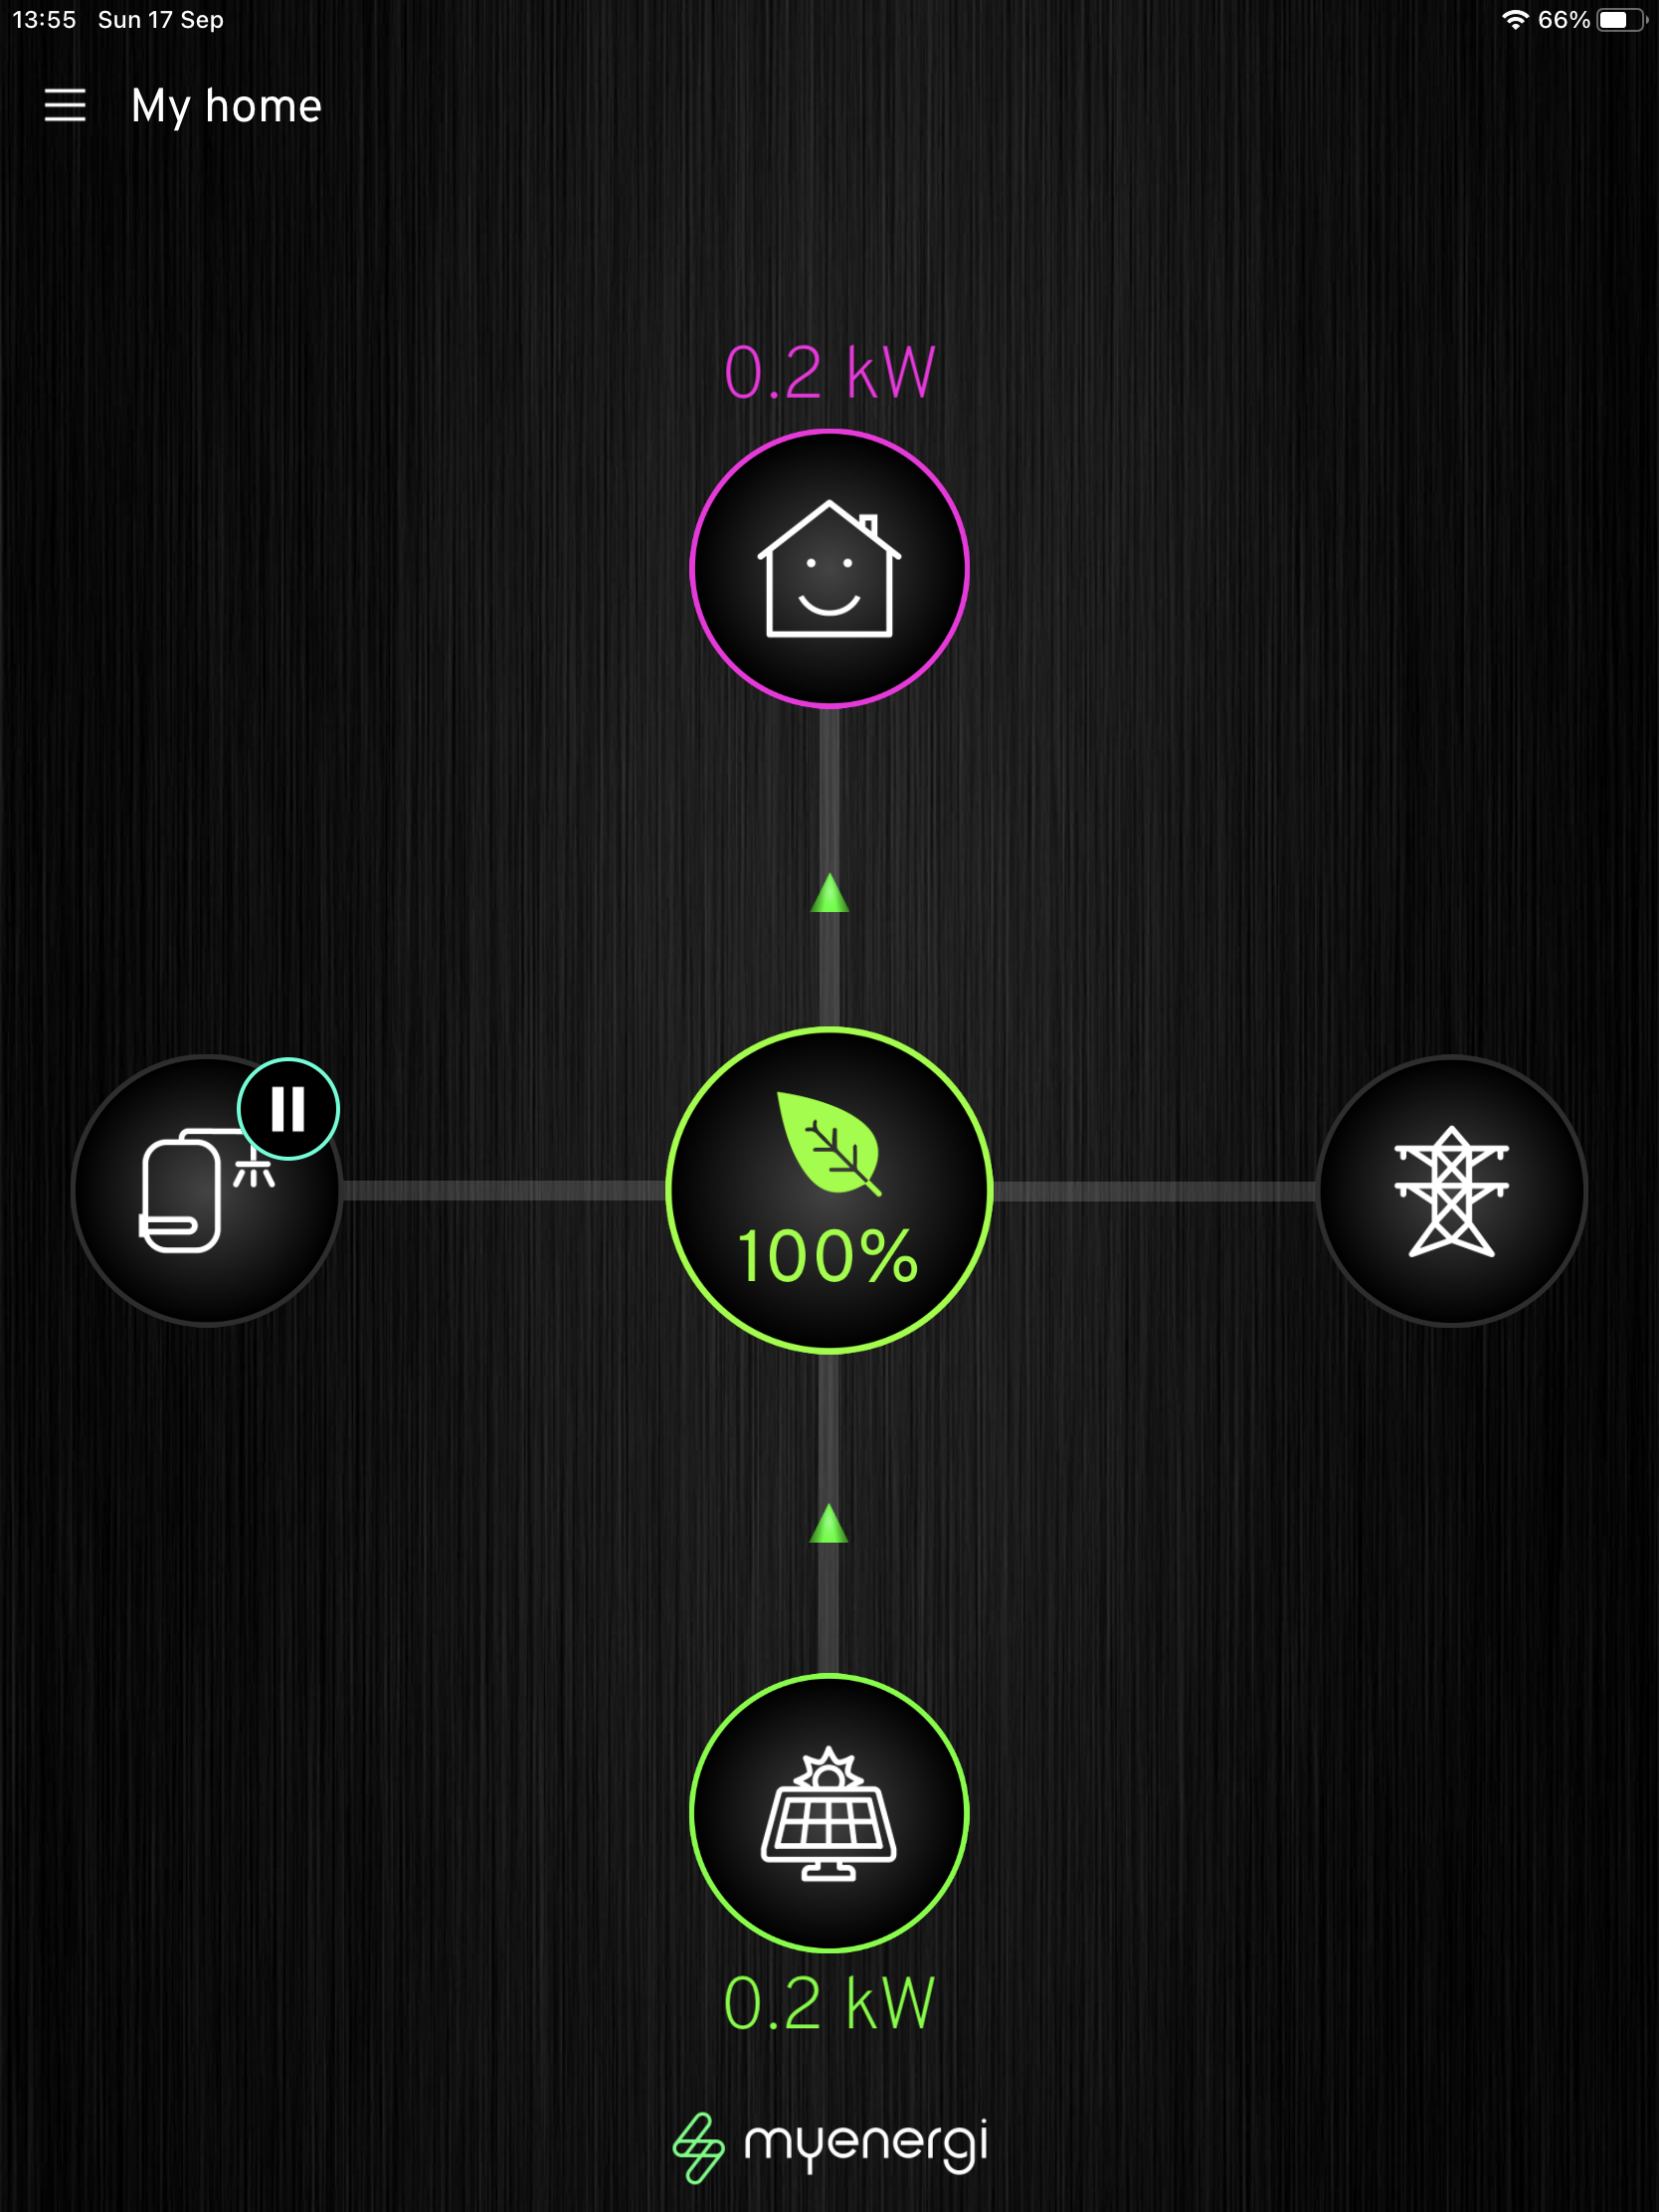
The Myenergi app
The Eddi connects to the app via the internet connection described above. The app has a range of features but the screen illustrated shows (clockwise from 3 o’clock):
Power to/from the grid (measured via Harvi)
Power from solar panels (measured via Harvi)
Power diverted to immersion heater (measured via Eddi)
Power to home (inferred by calculation from the above).
Percentage of green energy (i.e. from panels rather than grid).
I’m pretty pleased with my purchase which I found intuitive to install and works well. The system also provides capability to add more sensors so I may well add to that including a sensor for my battery on the existing Harvi and possibly one in the garage for my older car charger.
We will shortly have been in this house for six years. During that time I have created three smart control systems that improve my energy costs or efficiency:
heating controls to minimise gas purchase
self-consumption controls of the electricity generated by my solar panels to maximise value of self-consumption
smart tariff controls to buy grid electricity at the lowest price
Heating Controls
Most homes have a single heating zone with one timer and potentially one thermostat controlling the whole house with perhaps some thermostatic radiator valves (TRVs) capping the temperature in specific rooms.
By contrast we have seven heating zones created by electronic temperature control valves (eTRVs). Each zone has its own timer. There is no central timer or thermostat. Each eTRV can summon the boiler on when cold rather than simply cap the maximum temperature like a TRV.
Some rooms also have links to other smart devices such as disabling room heating when the window is open or turning off heating early when there’s no movement in the room.
The intent is to save energy by only heating rooms that are in use.
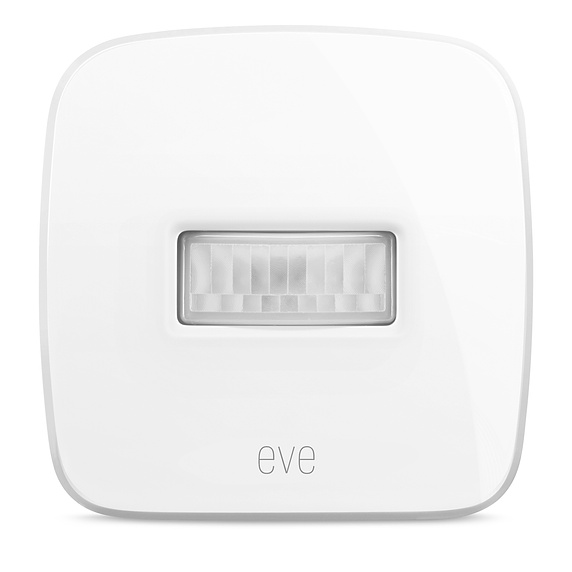
New Eve Thermo eTRV
Eve Motion
Eve Door and Window
Boiler control
Smart controls – HEMS and immersun.
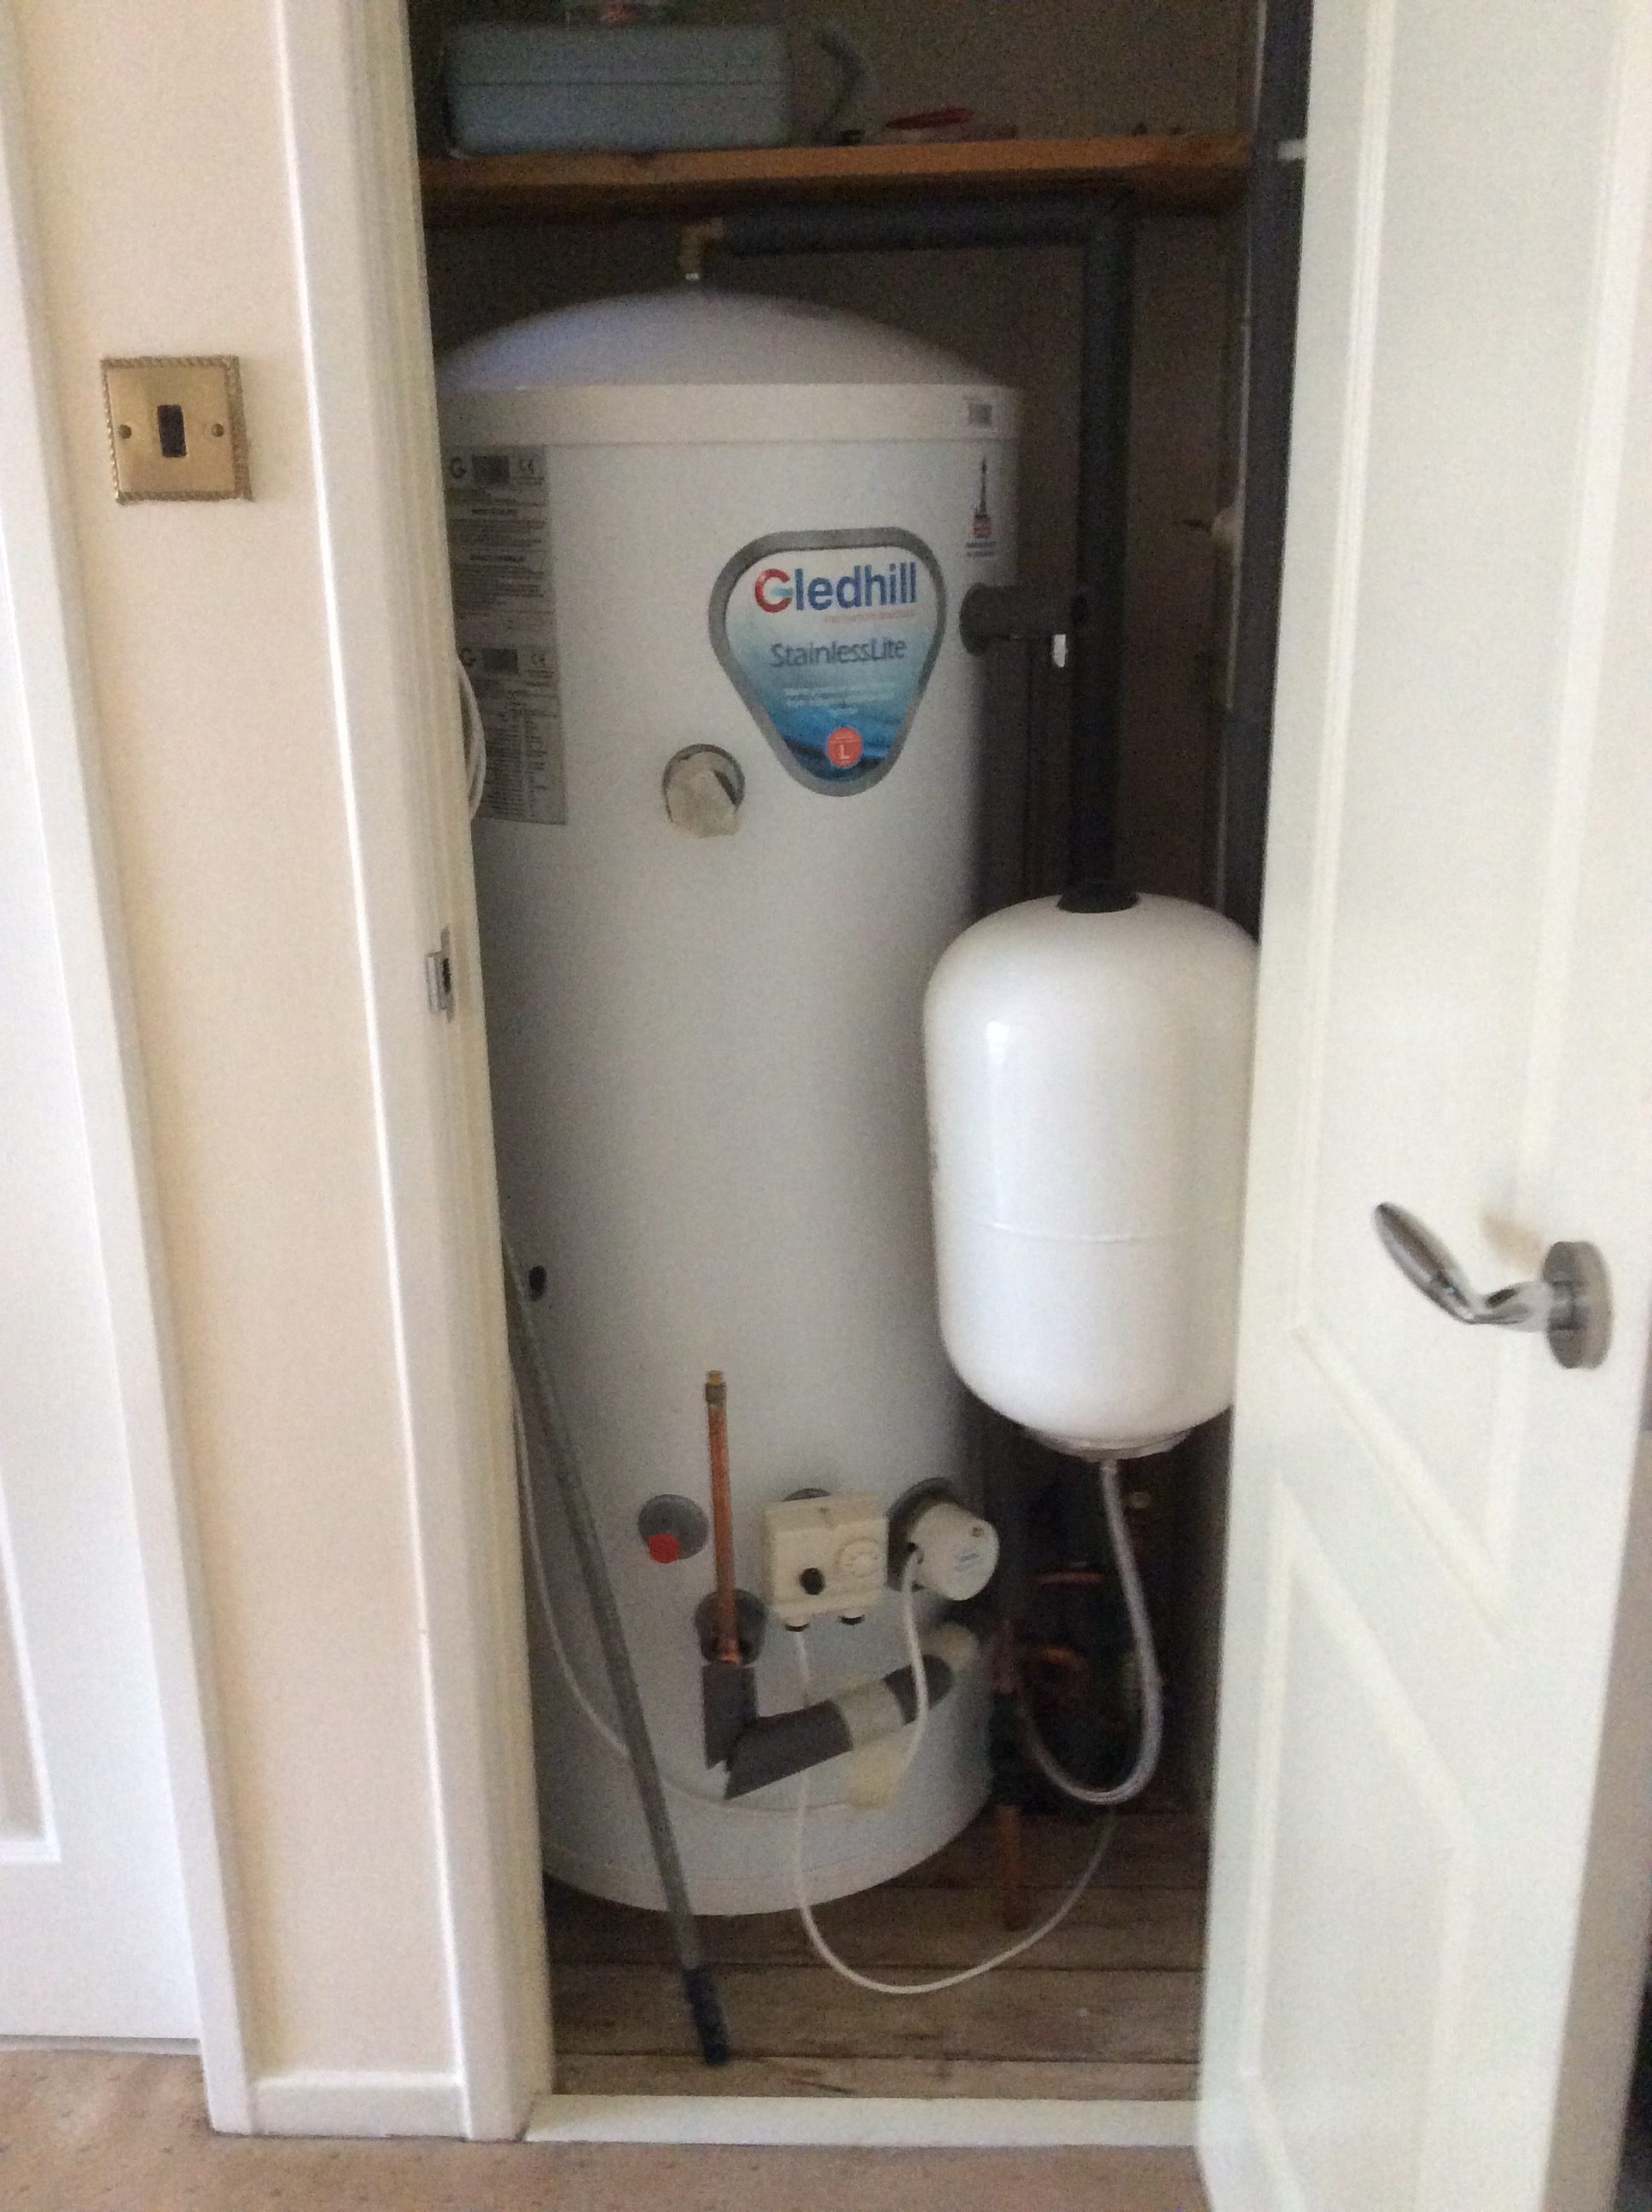
Hot water cylinder with immersion heater
Car charger
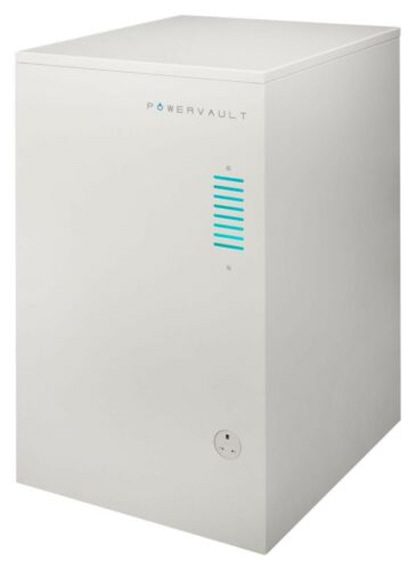
Powervault storage
Self-consumption Controls
These controls manage the diversion of any excess output from my solar panels rather than give that energy to the grid. The loads are prioritised as follows:
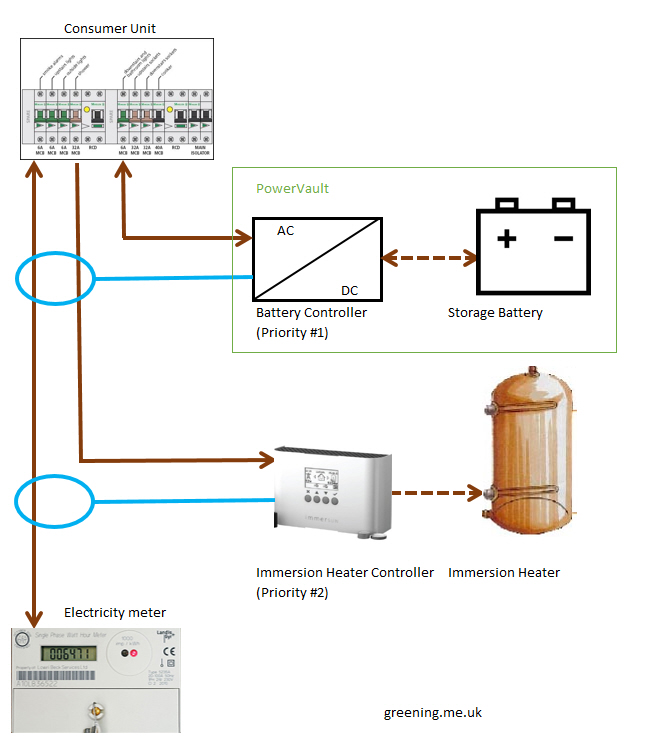
Powervault storage battery (fully proportional)
Car charger (stepped proportional driven by ImmerSUN relay output)
Hot water (driven by ImmerSUN fully proportional output)
Last year these controls helped me to use over 90% of the output of my solar panels avoiding buying £100s of electricity and gas. The priorities are set to maximise value – #1 avoid daytime electricity use at 16 p/kWh, #2 avoid car charging at 5-16 p/kWh, and #3 avoid gas consumption at 2.96 p/kWh.
Smart Tariff Controls
These controls manage my electric devices for lowest grid energy cost. The controlled devices are:
Battery storage (Powervault)
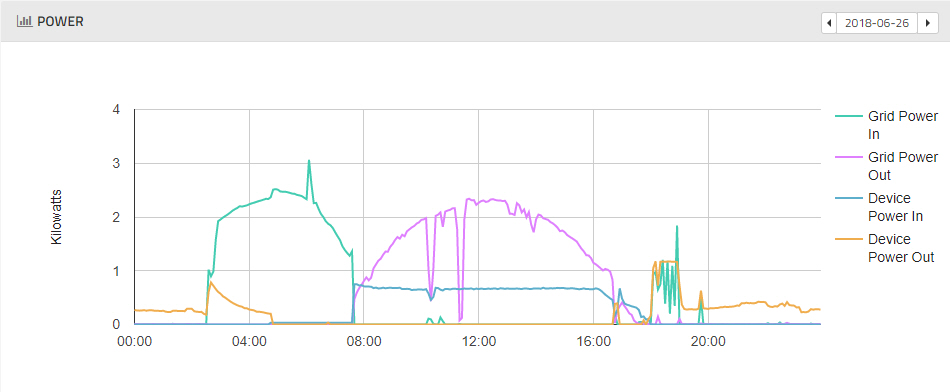
Dishwasher
Electric car charger
Hot water heating (ImmerSUN)
Washing machine
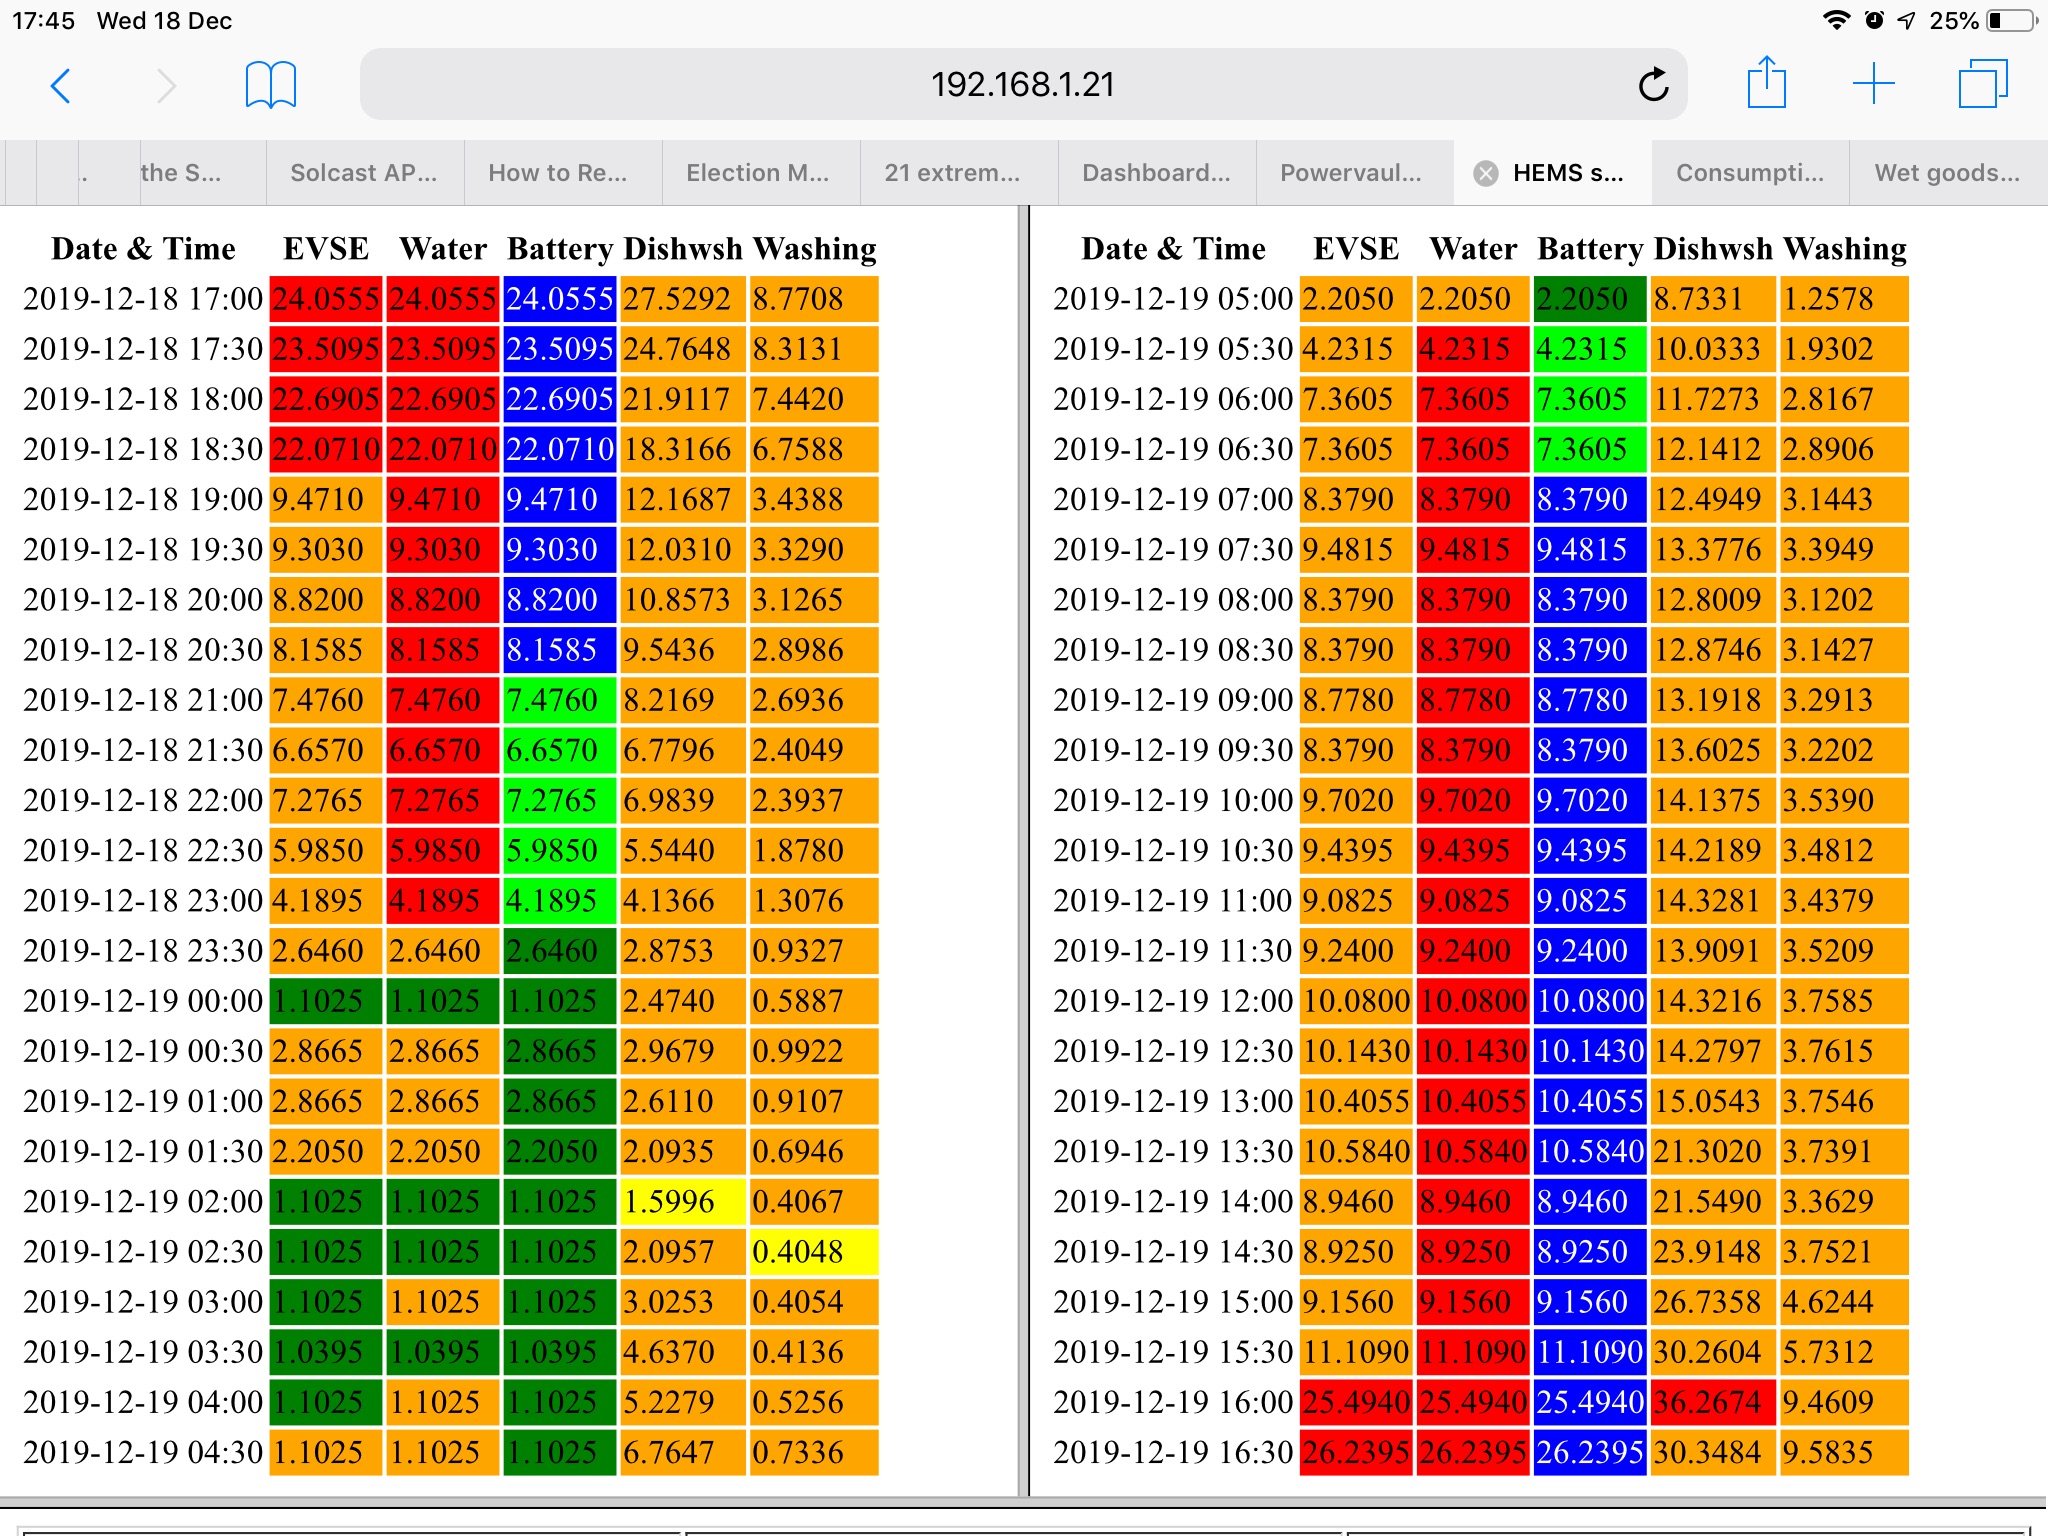
The hardware that has this control is known as a Home Energy Management System (HEMS). My HEMS is based on a simple computer known as a Raspberry Pi. The HEMS uses foreknowledge of the electricity price and predicted solar panel output to determine when best to run the above devices. It was designed around a tariff called Octopus Agile which has 48 half-hourly prices that change daily, but is currently working with a simpler two-rate smart tariff.
Hybridised Agile and Go
Raspberry Pi as HEMS
Bosch Washing Machine
Siemens Dishwasher
device
Central Heating
self-consumption
smart tariff
Battery Storage
#1
X
Central Heating Boiler
X
Dishwasher
X
Electric car charger
#2
X
Hot water heating
#3
X
Washing machine
X
Devices controlled by smart systems
Most of these solutions are made up of commercially-available items that I have perhaps combined in a way not anticipated by their manufacturers. In particular:
I created a relay module to enable the gas boiler to be turned on remotely and programmed a series of logical rules for the Apple TV’s that act as the controllers.
I identified a way to prioritise different self-consumption devices by configuring their current clamps.
I built my smart car charger integrating various items of hardware and writing the ladder logic program that runs it.
I built the HEMS from commercially-available parts and wrote the software that runs on it to control my devices.
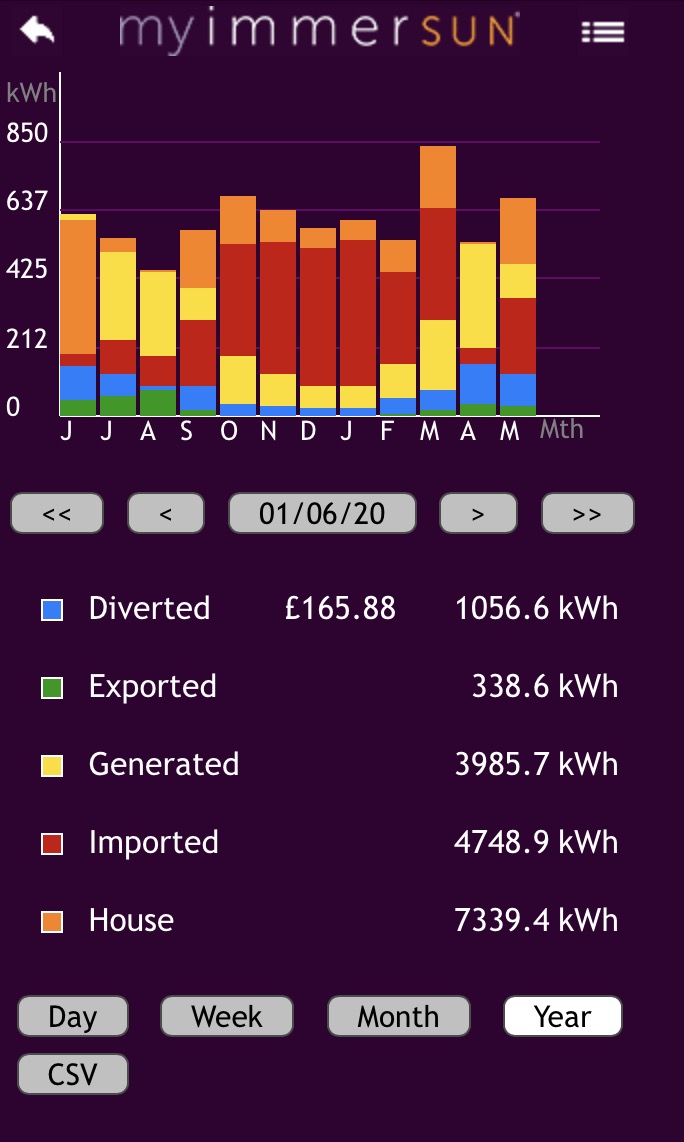
It been over a year now since I last reviewed what return I was getting on my investment in energy smart technology – solar panels, battery storage etc – so I think an update is due. This time I’m going to take the input data from my immersun system – one year of data from start of June 2020 to end of May 2021.
ImmerSUN diverter
ImmerSUN monitoring – June 2020 to May 2021
Diverted – this is where the immersun sends any surplus solar electricity to my immersion heater to make hot water. In 2020/1 we diverted 1056.6 kWh to hot water saving gas at 2.82 p/kWh. However the gas boiler isn’t 100% efficient losing heat both via the flue to the outside world and also via the hot water pipes to the home rather than hot water. If we assume 80% efficiency at the tank then 2.82 p/kWh as gas at the boiler is 4 p/kWh as heat in the tank. 1056.6 kWh at 4 p/kWh saved £37.25.
Exported – this is where I’m unable to use the solar power that we generate and it overflows into the grid. I’m not paid for Export so this is worth nothing to me.
Generation – this is the energy that we generate in the solar panels. I’m on the UK’s legacy Feed-in Tariff (FiT) scheme which pays me to generate electricity. In 2020/1 I was paid 14.65 explicitly for every kWh that I generated. I also received deemed (rather than metered) Export which paid 5.5 p/kWh on 50% of the kWh that I generated (which is where the ‘deemed’ part comes from). 5.5 p/kWh on 50% is equivalent to 2.75 p/kWh on 100% of the Generation making my revenue 17.4 p/kWh per kWh generated or £693.51 on the 3985.7 kWh that I actually generated.
Imported and House – these are respectively the electricity that I buy from the grid and that which I used within the home including appliances and car charging, some of which will comes from my own solar panels. The difference between House and Imported is the electricity that I used from my solar panels which would otherwise have been bought from the grid. If I assume that each kWh that I use from my solar panels avoids buying a kWh of electricity from the grid at 16.36 p/kWh (current Energy Saving Trust value for the average UK electricity price) then I avoided buying £423.81 of electricity by using the output of my solar panels.
Diverted
1056.5 kWh
*
£0.04
=
£37.25
Exported
338.6 kWh
*
£0.00
=
£0.00
Generated
3985.6 kWh
*
£0.17
=
£693.51
Imported
4748.9 kWh
*
-£0.16
=
-£776.92
House
7339.4 kWh
*
£0.16
=
£1,200.73
Total
£1,154.56
Return on smart energy investment @ 16.36 p/kWh grid price
With an investment of £8,670, £1,154 represents 7.5 years to pay back the capital invested.
I’m actually on a smart tariff so my electricity cost in this period at 8.05 p/kWh was significantly less than the UK’s average 16.36 p/kWh. This lower price will arguably reduce the value of the energy generated by the solar panels for self-consumption, but equally the ability to maximize the value of a smart tariff is itself a saving.
Diverted
1056.5 kWh
*
£0.04
=
£37.25
Exported
338.6 kWh
*
£0.00
=
£0.00
Generated
3985.6 kWh
*
£0.17
=
£693.51
Imported
4748.9 kWh
*
-£0.08
=
-£382.29
House
7339.4 kWh
*
£0.08
=
£590.82
Total
£939.29
Return on smart energy investment @ 8.05 p/kWh grid price (excluding the tariff benefit itself)
Using my actual average energy price rather than the higher UK average grid price pushes down the return by over £200 (£929.29 versus £1,154.56). However the costs of buying the imported 4,748.9 kWh falls by £394.63 through the tariff benefit, increasing the annual return to £1,333.93, and reducing the payback period from 7.5 to 6.5 years.
Thus, had I invested in this technology at one time back five and a half years ago and shortly after we moved to this house, then we’d have been in sight of payback with 1 or 2 years left. In practice of course I’ve made the investments at different times (solar first five and half years ago, battery around a year later, smart tariff later still), so my payback will be achieved a little later.
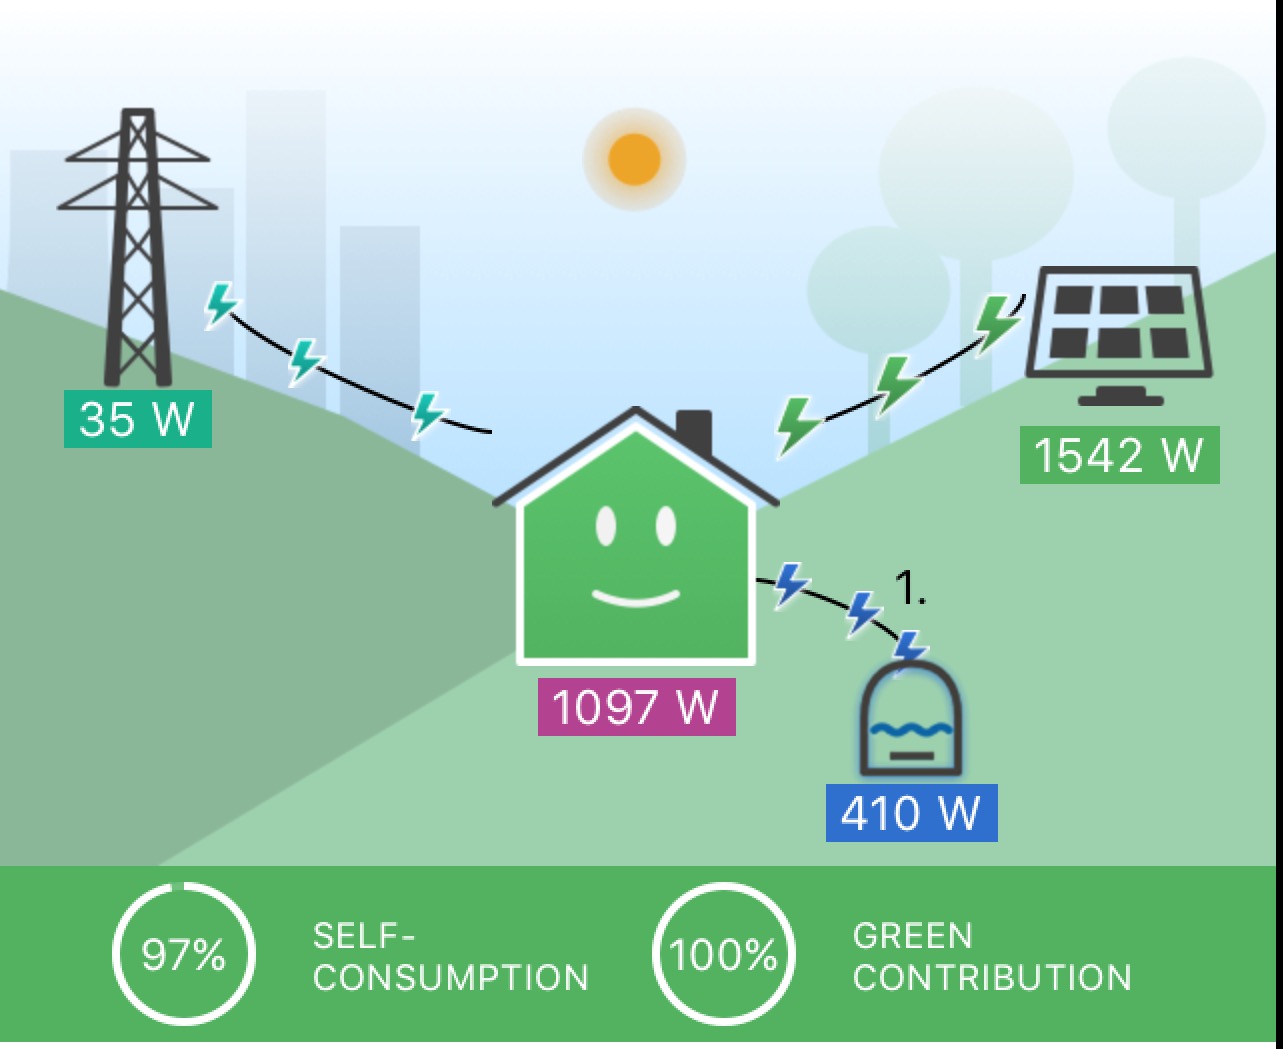
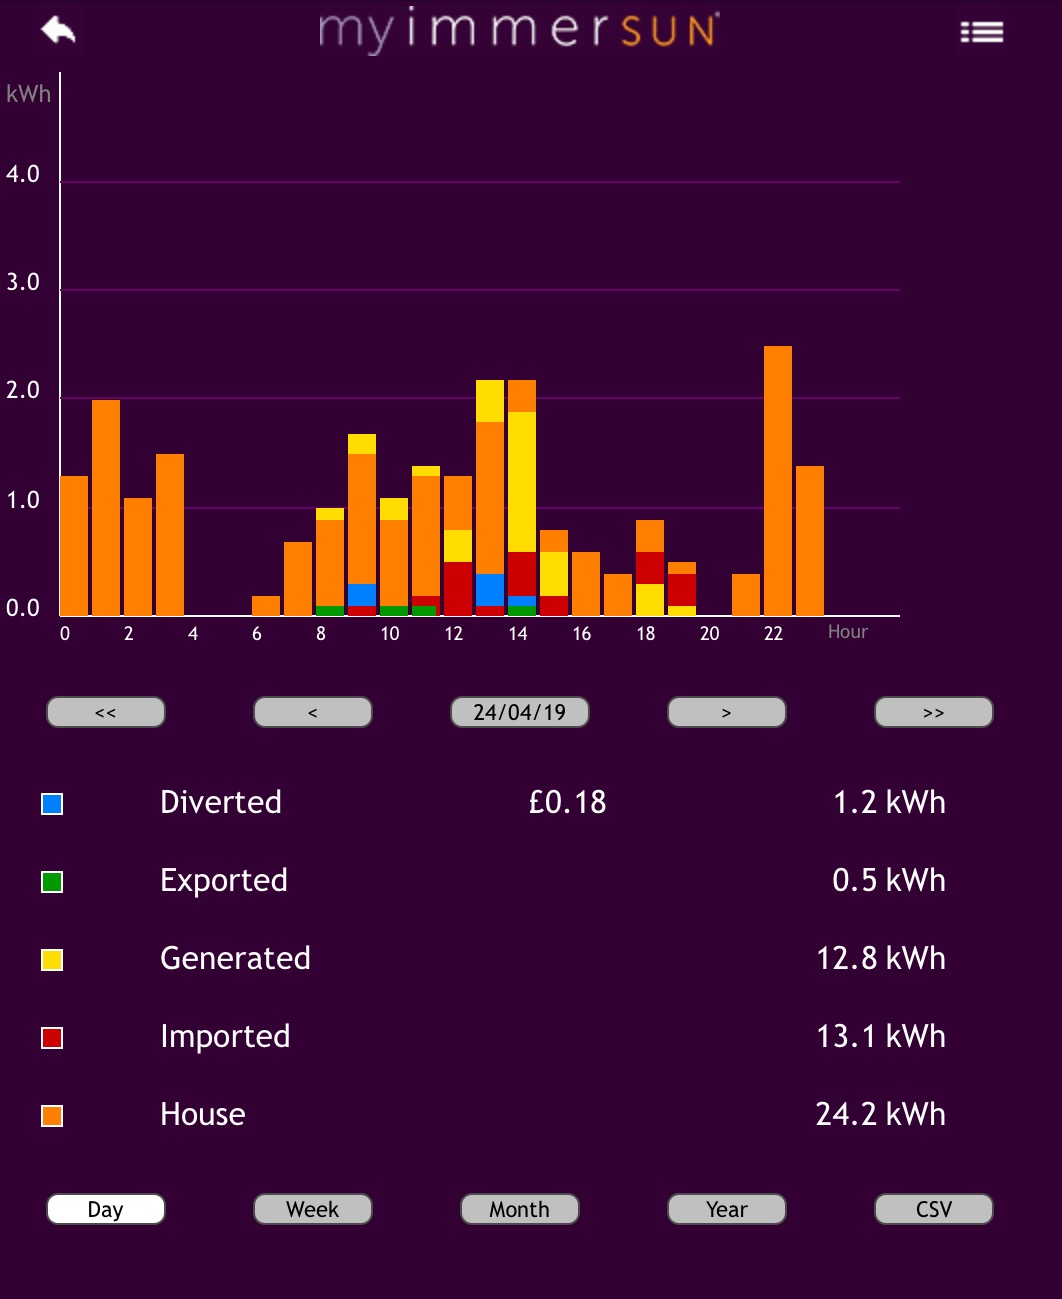
A snapshot of the ImmerSUN diverting to hot water
Some other statistics:
Of solar panel output:
91.5% replaced bought energy (self-consumption)
65.0% replaced bought electricity
26.5% replaced bought gas for water heating
8.5% was exported to the grid
Of incoming electricity:
54.4% was from the grid
45.6% was from the solar panels (“green contribution” in ImmerSUN’s terminology)
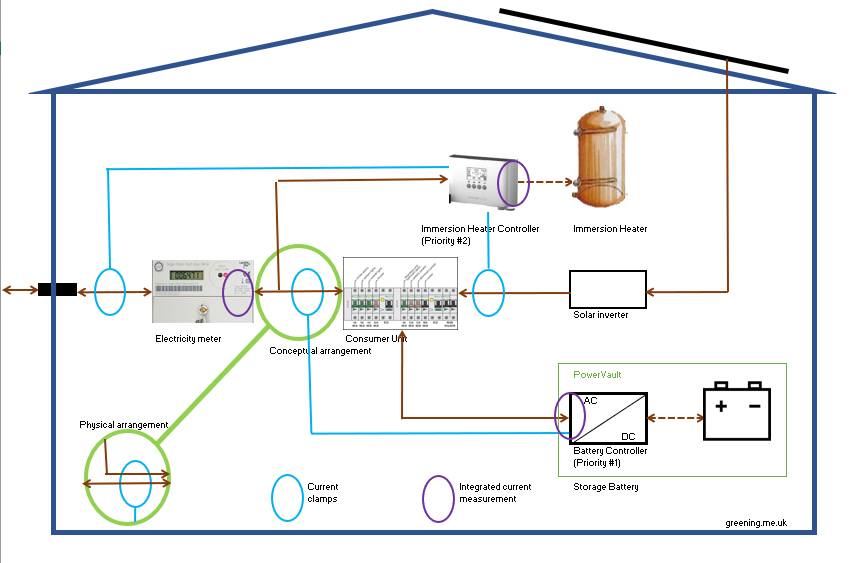
Main electricity supply cutout with current clamp above
As previously noted, I recently had the main supply cut-out to my house uprated from 60 to 100 Amps in preparation for installation of an additional electric vehicle charger. That involved my Distribution Network Operator (DNO) replacing the fuse within the black fuse holder with the torn red label above and replacing the brown live and blue neutral cables between the cutout and the electricity meter to the top right of the picture. In my case the technicians involved automatically moved the black current clamp that sits above the cutout from the old live cable to the new one without even mentioning it, but it did occur to me that it would be worth documenting what current clamps I have, what they do and where they are for the benefit of any future trades who may not replace like-for-like.
I have two devices that currently use three current clamps between them:
Immersun. Has two current clamps, one for control and one for solar generation data only.
Immersun control clamp is around the main live feed between cutout and meter as pictured above and illustrated below. It measures any flow of electricity to the grid and prompts the Immersun to divert this to water heating or car charging.
Immersun generation clamp is around the main live feed between the inverter for the solar panels and consumer unit and specifically inside the rotary isolator on this cable (being a good location where the live alone can be encircled without the neutral).
Powervault battery. Has 1 current clamp inside the consumer unit which encircles both the incoming live and the live feed to the immersion heater. These two cables are orientated such that flow from the solar panels to the grid or to the immersion heater passes in the same direction through the clamp as illustrated below. (This is unorthodox and not what the installation manual describes, but is done to force the priority of the battery over the immersun when a solar surplus is available)
Positions of 2 of 3 current clamps.
There were previously three additional current clamps which were used by UK Power Networks (UKPN) my local DNO who part-funded my battery storage four years ago as part of a trial. Some of these clamps may still be present as I can still see some of the associated cables, but are no longer actively used as the associated data loggers are long gone. These clamps monitored: grid in/out (duplicates 1.1 above), battery in/out (duplicates battery’s own internal measurements), and solar panel in/out (duplicates 1.2 above).
DNOs tend to be concerned about excessive exports to local electricity grids which can cause voltage quality issues. Any export from a battery could add to any export from solar panels and could cause the DNOs preferred export limit to be exceeded. Given that the battery, as installed to the manufacturer’s advice, would measure the total export then it would be possible software within a battery to limit battery export such that the sum of battery plus solar export never exceeded the DNO’s recommended value. In practice the gross output of a 4 kWp solar array rarely exceeds the 16 Amp export limit even before the load of the home is subtracted to achieve the export from the home, so in many battery + solar installations there’s little prospect of the limit ever being exceeded even without such software limits.
The question that recently occurred to me is whether if a battery had such a software limit would that limit be defeated by my unorthodox installation of the battery’s current clamp?
Conceptual arrangement of clamps
My physical arrangement on the battery clamp encircling both the feed to the consumer unit and the cable to the immersion heater is equivalent to feeding the immersion heater from a connection between the meter and the consumer unit and having the clamp between that connection and the consumer unit. As such the battery clamp may read higher than the actual export since some of the power from the solar panels that is measured by the clamp may be diverted to the immersion heater without actually being exported. Thus, if the battery has a software function to limit to export, an arrangement like mine will cause the export limit to operate more aggressively than design intent and the DNO’s export recommendation will not be exceeded. Once the water is hot, and no further diversion occurs, then a battery clamp positioned like mine will record the same current as the meter and the Immersun’s clamp. Since I regard export as an error state then such a more aggressive limit on export is of no consequence to me.
Regular readers may recall that our hot water can be generated in 3 different ways: (i) conventional gas boiler, (ii) from grid electricity and (iii) from the surplus on my own solar panels. Attractions of these options are that gas is always available and stable in price, but my grid electricity is lower carbon and may at times be cheaper than gas, and my solar electricity is lowest in both carbon and cost but is subject to significant daily and seasonal variation.
Hot water cylinder with immersion heater
Smart controls – HEMS and immersun.
The logic to sort out which source to use is managed by my HEMS. Gas is the baseline and the gas boiler is set to heat water for an hour a day in the early evening to ensure that baths etc are possible. The heating is thermostatically controlled so it doesn’t heat if the water is already hot, and that thermostat is set slightly lower than the immersion thermostat too.
The ImmerSUN normally operates automatically to divert surplus solar electricity proportionately to the immersion heater after the needs of general house load, battery charging and car charging have been taken. However if the electricity price is negative (yes, really) then the HEMS may override the ImmerSUN so that water heating is not done by free solar but instead may be delayed to allow use of paid-to-use electricity.
The final part of this triumvirate is buying electricity from the grid to heat water. Here the price of bought electricity is compared either to the price of gas and a decision made to use electricity when it is cheaper (it’s always lower CO2), or compared to the price of surplus solar (effectively zero) to buy from the grid. Both of these are obviously comparisons with a price threshold but until now the choice of threshold has been made manually – typically against gas in winter when solar output is limited and against solar in summer when more readily available. However the reality of UK weather is that this is a compromise as it may be very sunny one day but very dull the next.
Solar forecasting
The new refinement therefore is to use the existing solar forecasting integration. Solar forecasting already informs HEMS decisions about when to charge the storage battery from the grid and when to operate the wet goods (dishwasher and washing machine). The latest change is that the solar forecasting is now also use to choose whether to base a decision to buy electricity for water heating against a threshold related to the gas price or against the price of surplus solar PV.
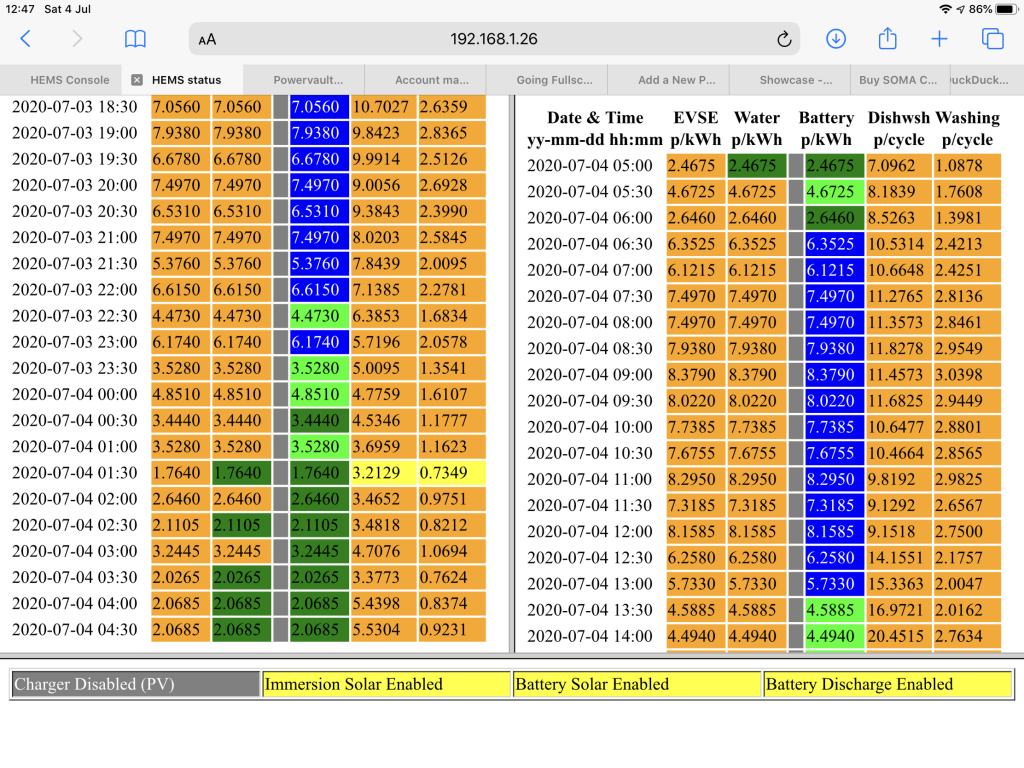
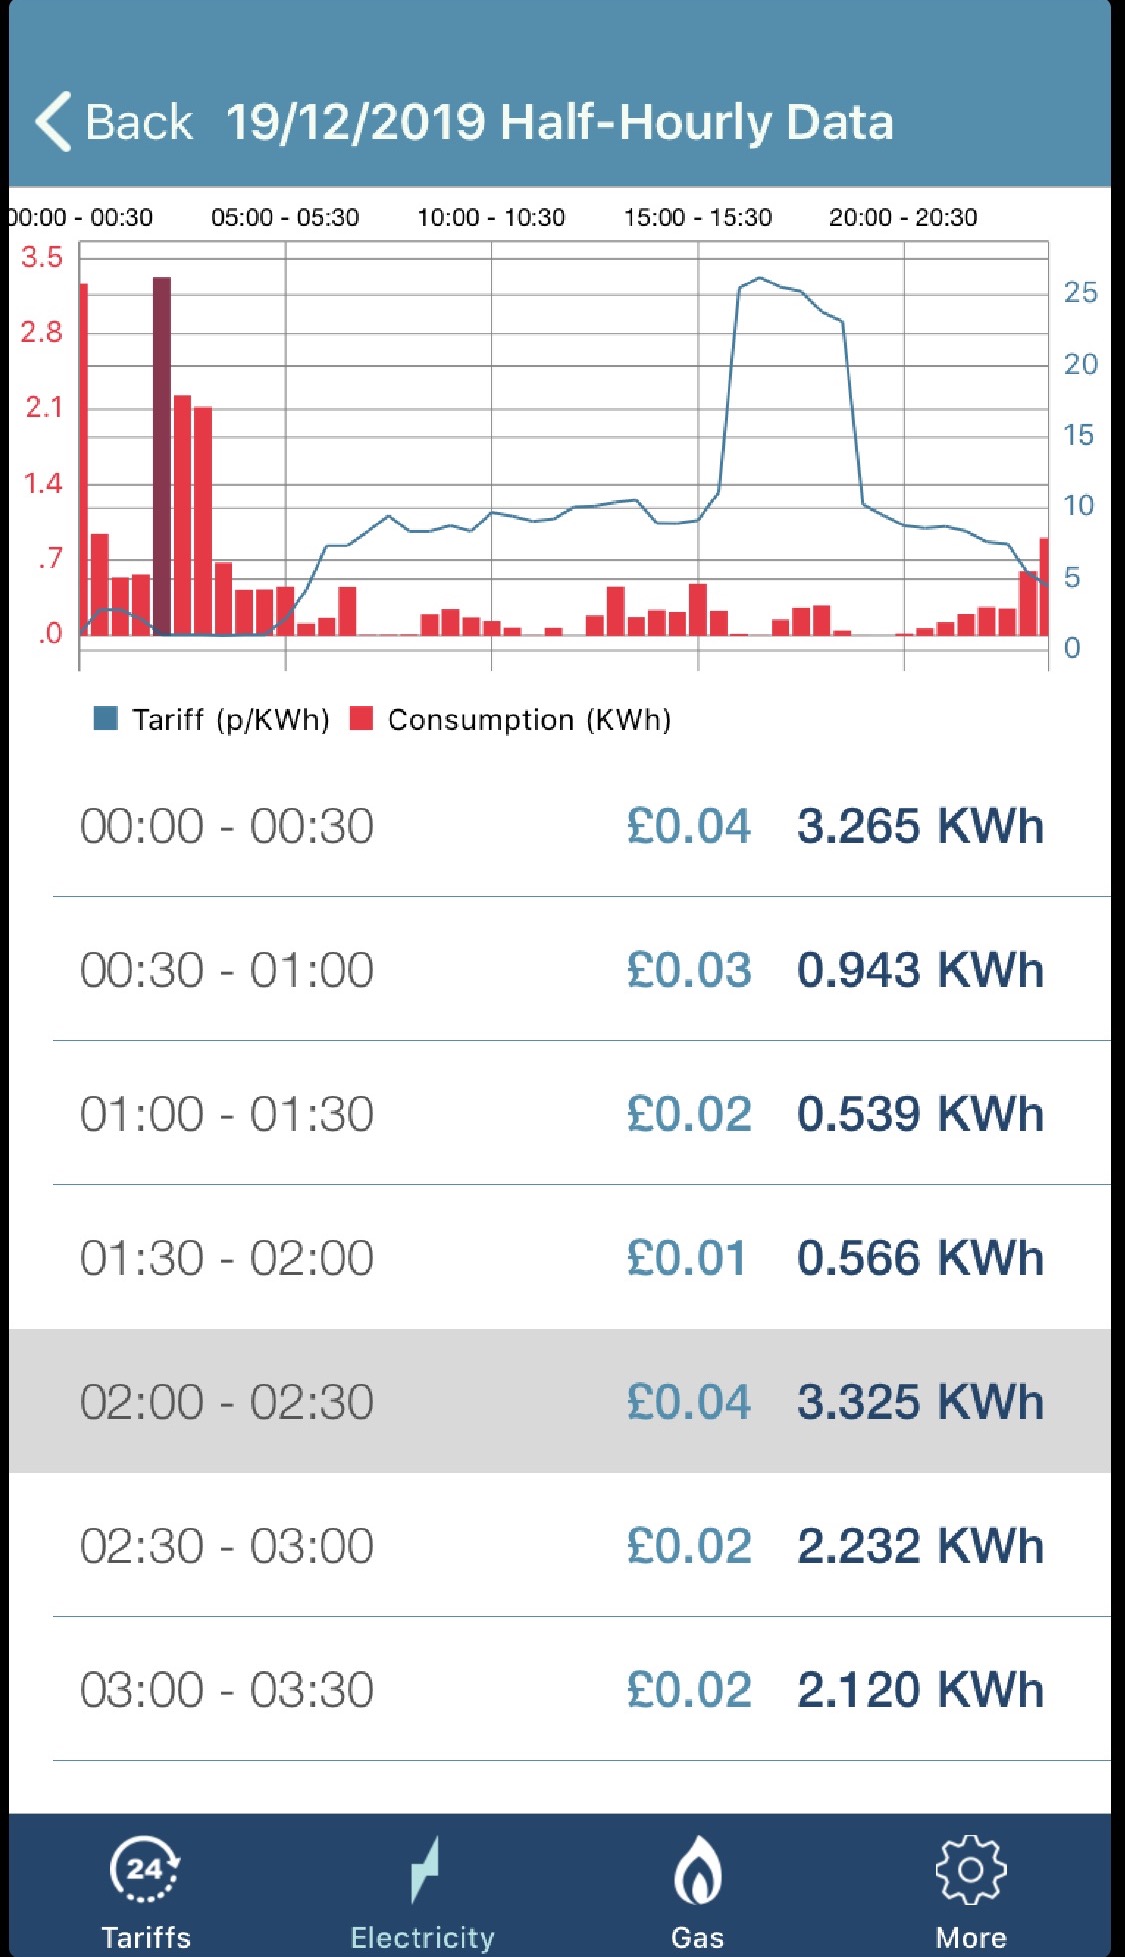
HEMS schedule for July 4th.
The above schedule shows that, as a result of no significant solar production anticipated on the 4th, the HEMS has compared electricity price to gas price and thus elected to buy electricity from the grid to make hot water overnight since at 1.7640 to 2.4675 p/kWh electricity is cheaper than gas.
It can’t be very often that an energy company blogs about its customers’ achievements. Last week it happened. Octopus Energy wrote a blog entitled “How to hack your home for cheaper, greener, energy with our open API” which featured the achievements of its customers, and Greening Me got two honourable mentions.
For those not familiar with geek-speak, API is Application Programming Interface which is a mechanism by which an app, webpage or computer program may give commands to, or receive data from, another program – often a web server. Such APIs are often closed (that is that they are only available for use by the creator’s own app or webpage etc), but in this case the Octopus APIs are open so that they can be used by others (including me) to create our own apps, webpages, or other integrations to get data from Octopus. That data may be future price information for a UK electricity region or the actual consumption from a specified electricity meter for example. Octopus document their APIs and encourage others to find innovative uses for them.
Other APIs that I use were either documented privately by the manufacturers of the equipment concerned, although the manufacturer has not put the API in the public domain, or were reverse-engineered by myself or others by looking at how the manufacturer used it or at the internet traffic that it generated and working out how we could use it ourselves for a slightly different purpose. Such purposes would include controlling equipment other than by the manufacturer’s own app, or collecting data into some non-supported form.
Diversity in third party solutions using the Octopus API.
Greening Me’s first mention in the blog came under the Smart Electric Vehicle (EV) Charging section where Octopus wrote..
One of our own smart energy pioneers, Greening Me, has used a Raspberry Pi and an add-on circuit board with our API to switch his electric car charger on/off and set the best time for his hot water immersion heater to run. He also has solar generation and so he can direct his solar power to either his smart car charger or hot water.
The first reference
Later in the “I’ll do it myself (tech level 🌶🌶🌶)” section after describing a group of “smart home pioneers” Octopus wrote..
Together with Western Power Distribution, Passiv Systems have also created something similar to Greening Me’s HEMS, which is currently being trialled and evaluated as another BEIS funded research project called MADE.
The second reference
So it’s official – I’m a “smart energy pioneer” and a “smart home pioneer”. I also quite like the idea of being a “home hacker” in the positive sense of someone who makes their own home conform to their wishes. If you’d like to read the full blog post from Octopus Energy then you can do so here https://octopus.energy/blog/agile-smart-home-diy/.
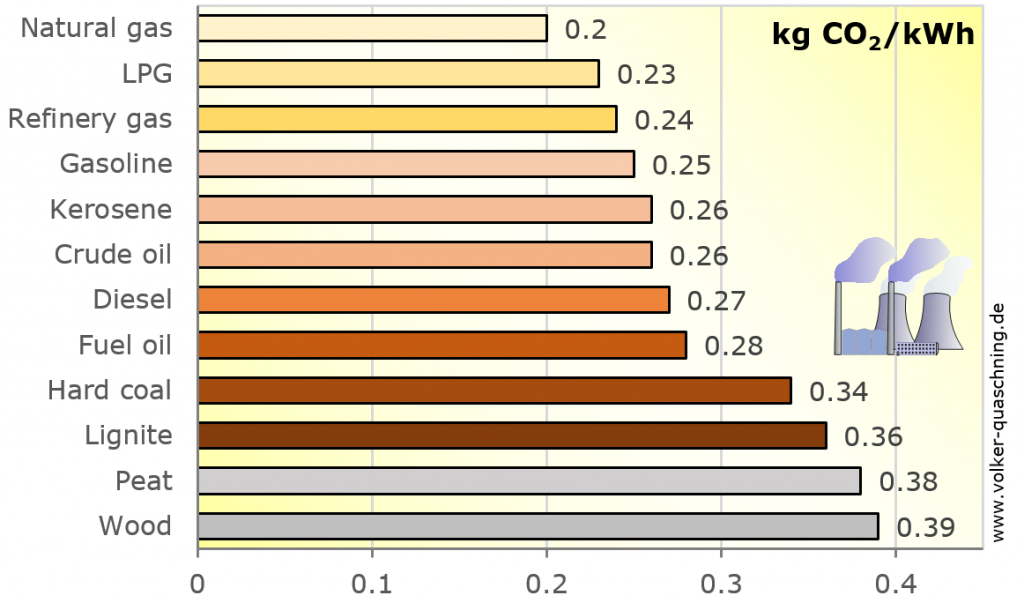
CO2 production is increasingly of interest as the world struggles to limit man-made climate change. As we use different energy sources each represents a certainly amount of CO2 reflecting a combination of the energy invested to create that power source (e.g. the wind turbine may generate wholly renewable power, but its construction created some CO2) and the CO2 created as it generates energy once constructed (nothing for renewables but relatively high for fossil-fuelled generation).
I’ve previously shared this table showing the IPCC’s view of the embedded CO2 in different sources of electricity generation.
IPCC’s view of embedded CO2 in different sources of electricity generation
A recent question and resulting discussion in an on-line forum prompted me to think more about the area of embedded CO2.
My first observation would be that my rooftop solar panels do quite well on this scale with a CO2 figure of 41 gCO2/kWh.
The second observation would be regarding energy storage. My view would be that any energy storage device from a small scale domestic battery like my own to a large pump storage scheme can never deliver better embedded CO2 that the source of its energy. So, for example, if I charge my battery from my own solar at 41 gCO2/kWh with a cycle efficiency of 80% (the maker’s claim) then the embedded CO2 in the energy coming out of the battery cannot be better than 41 gCO2/kWh / 80% = 51 gCO2/kWh. Indeed it would be worse than that as this doesn’t account for the CO2 generated in creating the battery nor its operational life, but I don’t have figures for those.
Example of UK grid CO2 intensity
Thirdly, as my own embedded CO2 is relatively low whether exported directly from my panels or indirectly via the storage battery, then the CO2 intensity of the grid always benefits from my export. The 116 gCO2/kWh illustrated above is pretty low for the UK grid which varies widely but is still more than my solar PV directly or stored solar PV. Indeed had I exported onto the grid at the time illustrated above then my 41 gCO2/kWh versus the grid’s 116 gCO2/kWh would have saved 75 gCO2 for each kWh that I exported.
However if, for example, I export electricity but need to then buy more gas to make hot water then that too has a CO2 impact.
If I need to buy a kWh of gas to make hot water that’s 0.2 kgCO2/kWh or 200 gCO2/kWh even before I’ve accounted for the relative inefficiency of the gas boiler versus my electric immersion heater. If I assume that the gas boiler is 90% efficient then I will be responsible for 200 gCO2/kWh / 90% = 222 gCO2/kWh for a kWh used to make hot water. Thus, while exporting 1 kWh of solar PV may save the electricity grid 75 gCO2/kWh, it’s added 222 gCO2/kWh to gas consumption – a net deterioration of 147 gCO2/kWh.
Natural gas of course is the lowest CO2 of the fossil fuels listed above – if your home is heated by oil, coal or wood then the analysis is further skewed towards using your own self-generated power rather than exporting electricity and importing another fuel for heating.
The electricity grid’s carbon intensity also varies. In 2019 the UK average was 256 gCO2/kWh (a little higher than my estimate for gas) however this varies considerably through the year with the highest embedded CO2 in early winter evenings when I have little if any solar PV to contribute to the grid, and may well be lowest when I and others have surplus solar PV. My understanding is that the lowest grid CO2 occurs with a combination of high renewables (such as particularly windy weather) coupled with low demand (such as summer nights).
Thus my own strategy is to:
Maximise self-consumption of my own solar PV as my energy source with the lowest embedded CO2 (except in the event of an extreme plunge pricing event when the grid is under highest stress)
Make best use of storage to minimise consumption from the grid in the evening peaks when embedded CO2 is likely to be highest.
When a solar-shortfall is anticipated then buy electricity selectively from the grid at lowest CO2 (using Agile electricity price as a surrogate for CO2).
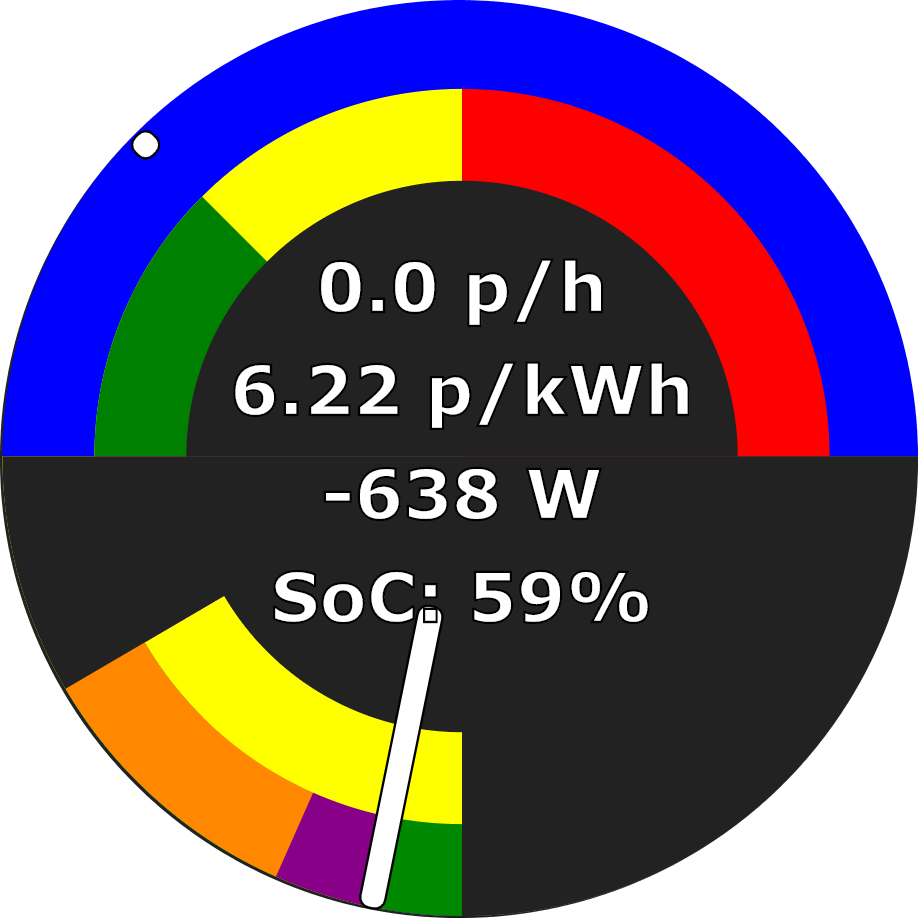
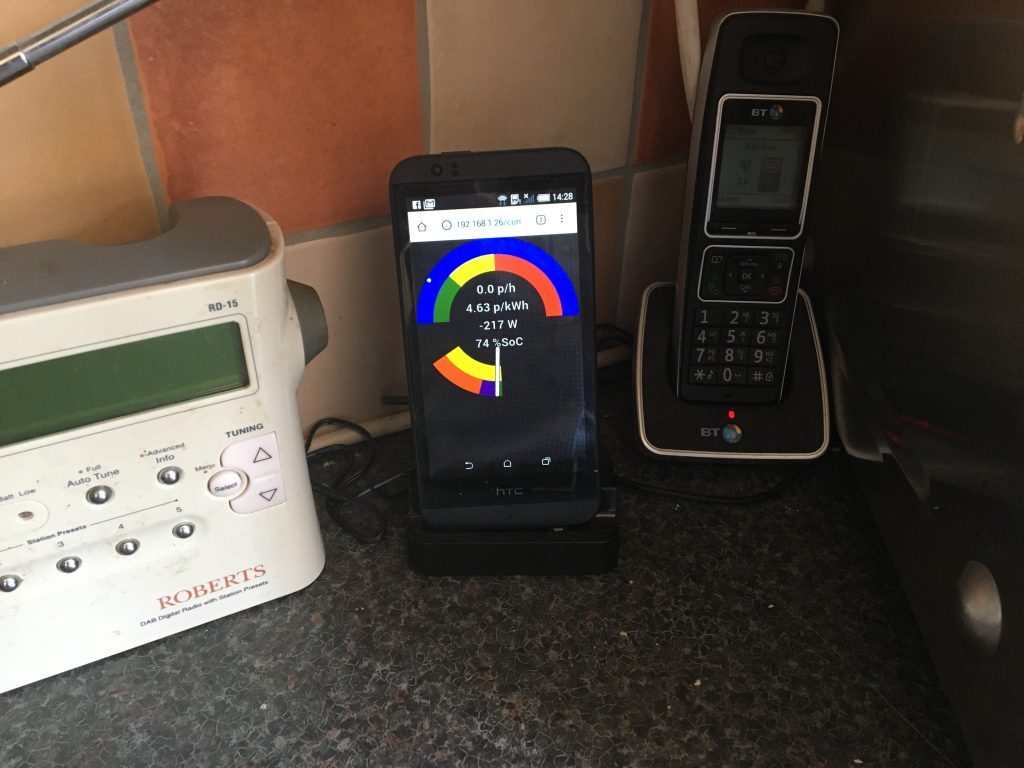
For some time now I’ve been thinking about creating a real time display which pulls together data from a variety of sources around the home to provide an overview of what’s going on without the need to visit multiple web pages or apps. Until the last 10 days or so that involved little more than thoughts of how I might evolve the existing immersun web page with more content (I don’t have the skills to write my own app), but then about 10 days ago I saw an online gauge that someone else had created to show energy price and inspiration struck. Ten days later I have my monitor working, albeit not complete:
HEMS monitor
The monitor pulls together information from:
My electricity tariff for p/kWh
My immersun for power data (to/from: grid, solar, water, house)
My storage battery for power in/out and state of charge
My HEMS for electricity cost thresholds between different battery modes.
The gauge consists of two parts: (i) an upper electricity cost part and (ii) a lower power part.
The upper electricity cost part is effectively a big price gauge from 0 p/kWh to 25 p/kWh with a needle that moves each half hour as the price changes. It has various features:
The outer semi-circular ring (blue here) shows today’s relationship between battery mode and electricity price. Today is very sunny, so no electricity was bought from the grid to charge the battery, and this part is all blue for normal battery operation. If the days was duller and electricity was to be bought to charge the battery, then two further sectors would appear:
a dark green sector from zero upwards showing the grid prices at which the battery would be force charged from the grid, and
a light green sector showing when the battery is not permitted to discharge but may continue to charge from solar.
In inner semi-circular ring (green / yellow / red here) currently just colour-codes increasing electricity price, but will be used to show today’s prices at which car charging and water heating are triggered from the grid.
The current price per kWh is taken from Octopus’s price API, while the current cost per hour is derived both from this and the grid power from the immersun.
The needle grows from a simple dot indicating the price per kWh only when no power is drawn from the grid to a full needle when the electricity cost is 10 pence per hour or more.
The lower power part is effectively a power meter ranging from 5,000 Watts of export to the left to 5,000 Watts of import to the right. It updates every few seconds. It has various features:
The outer semi-circular ring (orange /maroon / green here) shows how power is being consumed:
orange – shows consumption by the house less specified loads
maroon – shows battery charging
blue (not shown) – shows water heating
green – shows export to the grid
The inner semi-circular ring (yellow here) shows the source of power. The sum of the sources should equal the sum of the consumers. The sources are:
maroon (not shown) – shows battery discharge
yellow – shows solar power
red (not shown) – shows grid power
The power value shows the net import or export from / to the grid, while SoC refers to the state of charge of the battery (0-100%). The combination of import power and electricity price gives the cost per hour in the top gauge.
The needle position shows net import (to the right) or next export (to the left). The needle should thus be to the left of the green sector, or to the right of the (unseen) red sector. Needle length show the full power being handled and is thus proportionate to the angle of the sector including all the colours in the lower gauge and extends from 0 to 5 kW.
Monitor installed on an old phone in the kitchen.
The gauge scales to fill the smallest of screen height or width and translates to be centrally positioned regardless of screen size. My intention is to display it on an old mobile phone as an energy monitor, but I can also access it on any web browser on any device within the home.
Discussion elsewhere prompted me to look into what I spent on what you might term my energy smart systems relating to electricity consumption, so I thought I’d document it here.
Item
Description
Cost
Comment
1
Solar photovoltaic system (4kW)
£5,500
Bundled with ImmerSUN.
2
Powervault battery storage (4kWh)
£2,000
Free installation as part of UKPN trial.
3
ImmerSUN management system with monitoring.
£600
Estimate based on today’s pricing.
4
Remote-controlled car charger.
£300
Modified used charger from eBay. My own software.
5
Raspberry Pi items to make HEMS
£200
My own software.
6
Wet goods automation (WIFIPLUG x 2)
£70
TOTAL
£8,670
Prior analysis of items #1-#4 in pre-Agile days has suggested a total of 9 years to achieve payback on this investment through use of around 85% of the generated energy. Solar panels are potentially good for over 20 years operation, although I doubt the lead-acid batteries will still be operating for anything like that long.
The combination of item #5 with my Octopus Agile dynamic smart electricity tariff has resulted in my average bought electricity price being 7.75 p/kWh in 2019, about half the UK average. I suppose that I could make the same judgements and program items manually each day, but the HEMS significantly reduces my time commitment to achieve that.
Item #6 is my most recent addition. The sophistication of the algorithm combining the Agile tariff with a simple model of the cycle of each device is such that I would never achieve such a high quality result manually. However the saving is perhaps only a three pence each day so maybe £10 per year on my Agile tariff and thus 7 years to pay for the two smart plugs.
Much of this content is thus around 7 years to payback. The HEMS is potentially much quicker, but relies on having smart systems to control such as battery storage and car charger.
One of the consequences of integrating a smart home is the large number of different apps, web portals and potentially sources of APIs involved. The ones I use include:
Bright
Eve
HEMS
Home
Immersun
OctoWatchdog
Powervault
WIFIPLUG
Title
App
Portal
API
Purpose
Comment
Bright
Y
N
Y
Reads and stores consumption from smart meter.
No price data for my tariff due to smart meter limitations.
Eve
Y /3
N
N
Eve’s alternative to Home for all HomeKit accessories with additional functionality for Eve’s own devices.
I prefer this to Home for editing rules. I use Eve products mostly for central heating control.
Home
Y /3
N
N
Apple’s own app for the HomeKit smart home ecosystem.
Need to refer to device manufacturers own apps (such as Eve or WIFIPLUG) for some configuration and data.
HEMS
N
Y
N
My own web portal to view HEMS schedule and status via Apache web-server on Raspberry Pi.
MyImmersun
Y
Y
Y /1
Control of ImmerSUN power diverter.
Available API provides some measurement and status data as per main screen of the app.
Powervault
N
Y
Y /2
Control of Powervault storage system.
Available APIs provide some user scheduling and status capability.
OctoWatchdog
Y /3
Y
Y
Future cost, and historic costs and consumption (30 prior days) from Octopus (electricity supplier).
APIs provided by Octopus. App developed by an enthusiast using Octopus APIs. Octopus’s own web portal provides historic consumption but does not pair this with cost. Monthly statements show graph of consumption and cost for each day.
WIFIPLUG
Y
N
Y
Control and measurements from own brand smart plugs.
Plugs also appear in Home and Eve apps. I use for dishwasher and washing machine.
Notes to table:
APIs not officially released. Reverse-engineered by an enthusiast and available on line.
APIs not officially released. Used as part of a sponsored trial when I first got the battery and re-used by myself with some manufacturer support.
iOS only. Not available for Android.
Some of these apps have similarities:
Both Bright and OctoWatchdog show whole of house energy consumption (and potentially cost) derived from the smart meter. However they have differences too. A smart meter sits on two networks: (i) the Wide Area Network (WAN) via which the meter communicates with the energy supplier and (ii) the Home Area Network (HAN) which links the devices in the home (electricity meter, gas meter, CADs/IHD and gateway). Bright connects to the HAN via small piece of hardware called a Glow Stick Wi-Fi CAD and collects its own data in real time and stores its own records of energy consumption in the cloud; while OctoWatchdog involves no extra in-home hardware, and takes data a day in arrears from Octopus not storing anything in the cloud itself. Bright’s USP is the real time consumption and current day’s data (neither of which OctoWatchdog supports), while OctoWatchdog’s USP is the availability of electricity price which isn’t available from the meter.
Both Eve and Home interact with all devices in the whole HomeKit ecosystem. Eve is best for creating rules and has more ability to configure Eve’s own devices, while Home is best for sharing access with family members. WIFIPLUG’s app is more limited only interacting with their own devices, and thus cannot see Eve or other HomeKit devices.
Both MyImmersun and WIFIPLUG apps, and the Powervault portal, allow configuration of their own manufacturer devices. They all have, for example, timer capability and data logging. MyImmersun is better for giving a whole-of-home view showing solar panel output and net input to house (so provides a more comprehensive energy monitor), Powervault shows no solar panel output but does give a view of whole-of-home, while WIFIPLUG provides only a view of the energy consumption of devices plugged in to the WIFIPLUGs.