It’s now 3 years since I became an Octopus Energy customer. Each month I’ve been noting the average unit rate from my electricity bill. These average rates vary month-by-month as I’ve always been on a smart tariff where the price is different at different times of day, and thus my average rate varies depending on how my consumption is divided between different times of day
Month
Year 2018/19
Year 2019/20
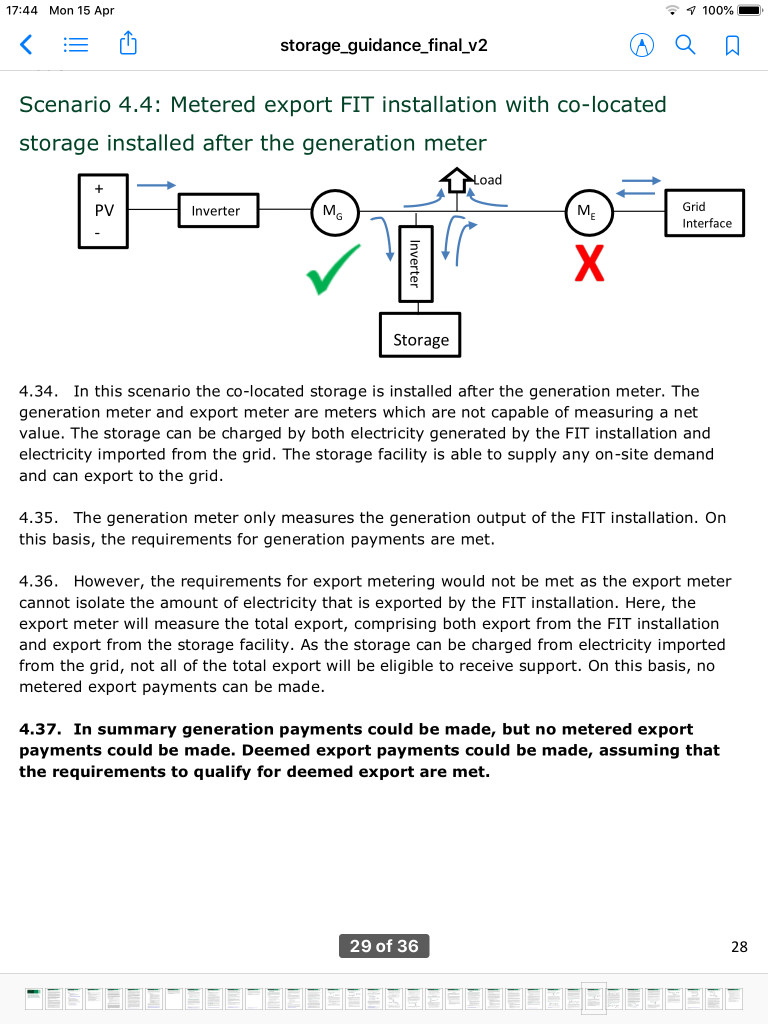
Year 2020/1
Year 2021/2
Year 2022/3
November
14.27 p/kWh
8.96 p/kWh
6.69 p/kWh
7.37 p/kWh
12.75 p/kWh
December
10.17 p/kWh
6.51 p/kWh
9.61 p/kWh
7.66 p/kWh
14.26 p/kWh
January
6.86 p/kWh
9.74 p/kWh
8.32 p/kWh
15.36 p/kWh
February
5.59 p/kWh
11.18 p/kWh
6.93 p/kWh
11.36 p/kWh
March
5.02 p/kWh
8.85 p/kWh
6.88 p/kWh
10.14 p/kWh
April
8.35 p/kWh
8.74 p/kWh
7.36 p/kWh
9.33 p/kWh
May
4.48 p/kWh
11.50 p/kWh
6.36 p/kWh
8.59 p/kWh
June
7.03 p/kWh
3.49 p/kWh
12.52 p/kWh
9.48 p/kWh (part old Go at 7.5 p/kWh)
11.28 p/kWh (part new Go at 9.5 p/kWh)
July
8.20 p/kWh
4.40 p/kWh
15.60 p/kWh (part)
End Agile / Start Go
5.92 p/kWh (part)
10.09 p/kWh (new Go with 7.5 p/kWh overnight)
10.62 p/kWh (to 30/6)
10.39 p/kWh (from 01/07)
August
6.29 p/kWh (part)
5.99 p/kWh (balance)
6.15 p/kWh
6.19 p/kWh
11.82 p/kWh
11.63 p/kWh
September
5.63 p/kWh
7.62 p/kWh
6.30 p/kWh
11.07 p/kWh
13.41 p/kWh (to 15/09)
12.66 p/kWh (from 16/06)
October
6.86 p/kWh
6.97 p/kWh
6.83 p/kWh
13.76 p/kWh
13.66 p/kWh
For most of this time I was on a very complex tariff called Octopus Agile which is directly linked to wholesale prices and, while historically that has been very good value, rising wholesale prices recently have caused that tariff to get increasingly expensive and so I’ve switched to Octopus Go which provides a 5 p/kWh inc-VAT night time rate for 4 hours. This is ideal for charging our electric cars and also the home battery if the next day’s solar production looks as if it will be limited.
Both of these tariffs are so-called smart tariffs enabled by smart meters. Some people can be very negative towards smart meters and indeed smart tariffs, but based on my experience it seems to me that if you have some flexibility to move electricity consumption to off-peak periods these can be excellent value for money.
I currently use the FiT revenue from my solar panels (about £700 annually) to offset my energy bills and am left paying £20/month towards household energy. I also earn a little income from referrals.
If you fancy an energy company that can provide excellent value for money, has good customer service, and that’s been recommended by Which? magazine for years why not switch with this link and earn an additional £50 credit? share.octopus.energy/ochre-beach-637
One of the features of our home is the all-electric kitchen. We do have gas for space heating and as a back-up on the hot water for days that are both dull and have relatively high cost electricity, but the kitchen is all-electric. I have to say that this was not our choice, rather the kitchen came that way when we bought the house five years ago. We have replaced the oven in the meantime, but until today the hob was that bought with the house.
Unfortunately the hob suffered a failure of the two of the rings and today we’ve replaced it like-for-like with a new inductive unit. Inductive is attractive as it’s relatively efficient, but I was struck by the fact that the one hob required a 32 Amp supply, but the new one manages with a 13 Amp plug.
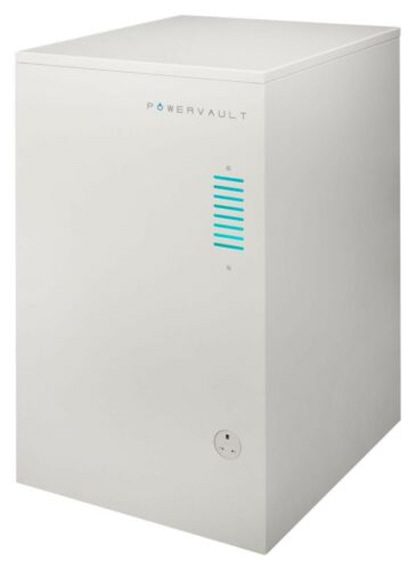
Bosch PUE611BF1B inductive hob.
So, by what magic does the new hob use less than half the power of its predecessor?
item
old hob
New hob
Smallest ring
1,200 Watts
1,400 Watts
Second smallest
1,400 Watts
1,800 Watts
Second largest
1,800 Watts
1,800 Watts
Largest ring
2,200 Watts
2,200 Watts
Total *
6,600 Watts
3,000 Watts
Tabulated of maximum non-Boost power per ring with manufacturer’s total
The first thing to observe is that the sum of the ring powers does not equal the manufacturer’s total for the new hob, although it does for the old hob. The second would be that the sum of the new ring powers at 7,200 Watts is more than the sum of the old ring powers even though the required total is less!
The answer is that the new hob features power management capability. In any hob the rings will spend much of their time cycling on and off to maintain the required heat. In the old hob all the rings might on at one time drawing maximum power, but a few moments later they might all be off. However the power management in the new hob the total power would be levelled out so that the average over time might be the same, but the peaks smaller and the troughs shallower.
For most people this levelling out of the power demand would pass unnoticed, but for us it could be quite useful.
Powervault storage
Grid import
We do most of our cooking in the evenings for which, particularly in winter, power is taken from our Powervault storage battery with any excess from the grid as illustrated by the series of evening spikes in the image to the right. The Powervault has a relatively limited maximum power (hence the spikes) but as the new hob has power management then any spiking beyond battery maximum power capability should be reduced thus avoiding what, for us, could be peak rate electricity at 35 p/kWh on our dynamic smart tariff which is a direct cost save.
Most of us are used to a simple world of electricity where we pay for what we consume. For most folks like myself based in the UK that’s typically a fixed price per kWh/unit consumed regardless of time of day, even through dual-rate tariffs have been around for decades – the best known being “Economy 7” tariffs. However as the grid gets smarter then there are increasing opportunities to save on, or make money from, electricity.
Electricity opportunities for import / export and positive /negative cost.
Conventional – pay for power.
This is the area with which most of us are most familiar. We all get the idea of paying for the power we consume. Most UK households pay a fixed price per kWh/unit regardless of the time of day. We have a competitive electricity market, so there are the choice of 70 to 80 different providers who will make different offers regarding standing charge (sometimes marketed as a subscription) and unit cost.
There’s also the opportunity to choose between a flat rate tariff or Economy 7 even on conventional meters that provide a discounted night rate for 7 hours.. These typically provide a discounted night rate, but may charge a little more during the day. They used to advertise these as ‘less than half-price electricity’ but that’s often not the case now.
Stepping up in complexity (and opportunity) smart meters provide the opportunity for a more diverse range of tariffs including different cheap night time periods, more than two rates at different times of day (in extreme 48 half-hourly rates), and a free day at the weekend (i.e. a zero rate of a weekend day) etc.
Beyond that my own tariff (Octopus Agile) not only has up to 48 different half-hourly prices/day that change daily based on that day’s market prices. That might sounds a bit scary but it can yield very cheap electricity prices – 4.48 p/kWh for me in April/May 2020 (for example) which is a third of what most people pay.
My electricity costs April/May 2020
(The original version of this post wrongly had the table from my gas bill above and mistakenly claimed that I had paid “a quarter of what most people pay” rather than a third. Total consumption is untypically low at the present time due to limited miles driven.)
Agile – paid to consume
Top left on my initial diagram is Agile – paid to consume.
One of the features of the wholesale electricity market is that at times the market price for electricity goes negative. At such times the a significant excess of supply (typically because of high output from wind turbines) over demand (often but not always at night) yields a negative price so electricity companies looking to buy electricity are being paid to take it. Most electricity companies will continue to charge their customers the standard price in these circumstances but, with the octopus Agile tariff, the negative pricing is passed to the consumer so that you are paid to consume electricity. This is one of the reasons that my electricity costs are so low.
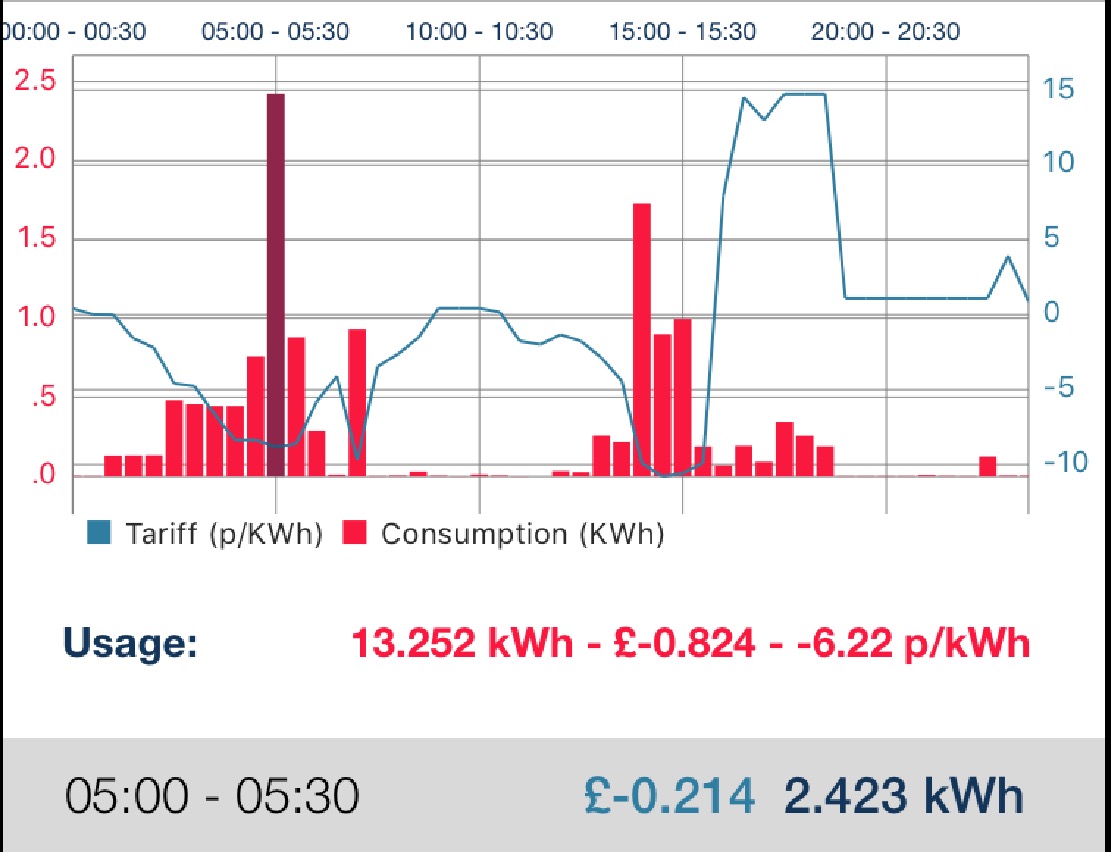
My electricity costs – Saturday 23rd May 2020
The above chart shows my electricity costs for Saturday 23rd May 2020. The blue line shows the half-hourly electricity price varying between minus 10 p/kWh and plus 15 p/kWh. The red bars show my electricity consumption in each half hour. You can see how consumption tends to be highest when the price is lowest leading to an average price paid of minus 6.22 p.kWh (i.e. they paid me to use electricity) – indeed they paid me 82.4 p to buy electricity that day.
Conventional export – paid to export
The next opportunity to make money from electricity is to sell it to the grid. Obviously that depends on having a source for the electricity typically a generating asset like solar panels or a wind turbine, possibly coupled with a storage device like a battery. It’s also possible with a battery alone, but I know no-one who does that as the economics are more challenging.
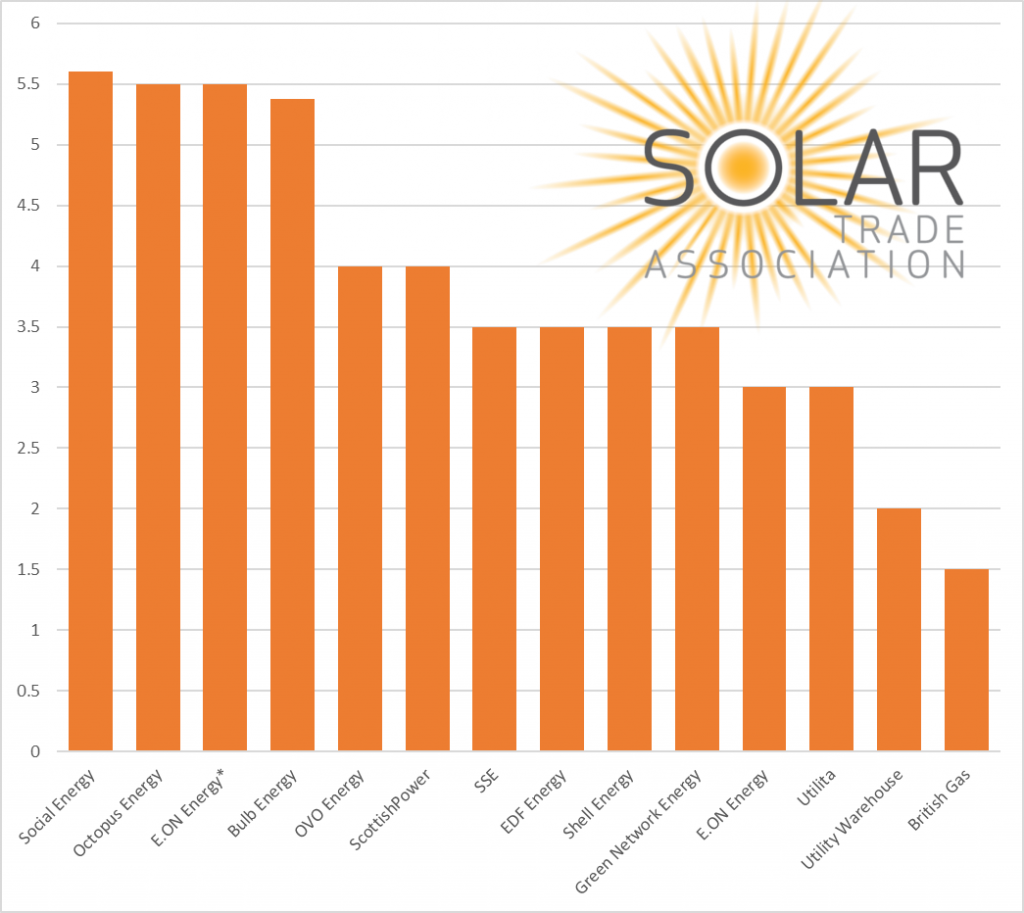
The UK currently has a scheme called Smart Export Guarantee (SEG) where you can sell your export to an electricity company. Prices vary enormously so it’s worth shopping around and not just assuming that your electricity company will give you a good offer.
SEG rates from the Solar Trade Association
There is also a smarter SEG option where Octopus offer a dynamic SEG based on market rates (Octopus Agile Export) which may at times offer a high rate, but also offers a lower rate at times, and is thus perhaps better suited to those with storage.
I myself am NOT on such a tariff as I’m on an older legacy Feed-in Tariff (FiT). Despite its name FiT is a generation incentive, not an export incentive. As a generation incentive FiT encourages self-consumption since each kWh that I consume myself does not reduce my income, whereas on SEG each kWh that I use myself (such as making hot water) would reduce export income. So, for example, if I use a kWh of electricity to make hot water that’s saved a kWh (or thereabouts) of gas at around 3 p/kWh, but if I was on SEG then I might have lost 5.5 p/kWh of export revenue to save 3 p/kWh on gas which is clearly an on-cost not a saving. There are other benefits of course because I’ve reduced my carbon footprint by using my own low CO2 electricity to replace a fossil fuel, but it’s not (in this case) improving my financial position.
A further area of research by others is V2X (V2H and V2G) – taking electricity stored in an electric vehicle and using that within the home (V2H) or exporting it to the grid (V2G).
Export penalty – penalised for export
A logical consequence of this smart grid that I’ve outlined is being penalised for export. If there are times when the market price for electricity is negative then if I were part of that market then I might expect to be penalised for export. This doesn’t actually exist in the UK, as the only model that links SEG payments to the market price, Octopus Agile Export, protects its customers from negative pricing.
Should consumers be exposed to this risk then a logical behaviours would be:
To manage self-consumption into the negative export periods, and potentially thus increase export in the positive export periods. For example disable diversion to an immersion heater or car when export price is positive, and then maximise self-consumption when the export price (and presumably the import price also) is negative.
To disable the generating asset to avoid the export penalty.
Conclusions
Some people like myself will find developments in the smart energy sector a fascinating and engaging topic with opportunities both the save money and engage in creating a cleaner and greener electricity system.
However given that many choose not to even participate in the competitive market for electricity supply created when the regional electricity companies were privatised in late 1990 (i.e. 30 years ago) then there will be a significant number who are not so motivated.
This then creates opportunity for a wider variety of smart offers. Some products, at the Agile Octopus end of the spectrum, giving the consumer the opportunity to benefit from their own decision making, while others look more like a traditional dumb tariff with a very simple price structure but potentially making the energy company a more active manager of the home appliances so that the consumer hopefully plays a lower unit rate while the energy company takes responsibility for managing the assets within the home.
Back in late 2018 I purchased a Hildebrand Glow Stick Consumer Access Device (CAD) to monitor my electricity consumption. A CAD is a consumer device that can be paired with domestic smart meters to provide the consumer with a means of reading the meter. All UK smart meters are supplied with a dedicated in-home display (IHD) to display energy consumption, which is also an example of a CAD. The Glow Stick pairs with the meters like the IHD but shares the data to the cloud from where it can be read either via an app (Bright) or another device using APIs.
Glow Stick CAD
Each smart meter effectively has two interfaces – a Wide Area Network (WAN) connection used for metering and billing and a Home Area Network (HAN) used for connection between meters (electric and gas), hub (embedded within the electric meter) and IHD. The HAN is also available for smart home devices.
“Network hub“ including Glow Stick
“Network hub” including (from top to bottom):
Network switch providing additional hardwired connections to the internet, placed behind..
TalkTalk router providing WiFi and 4 hardwired connections to the external internet, placed above..
Network storage, placed above..
Immersun bridge (left) and Glow Stick (right and forwards)
When I initially installed the Glow Stick it provided a very useful tool to see current and historic energy consumption, but the equivalent cost displays were incorrect (at no fault of Hildebrand) because the CAD correctly read the meter costs, but the meter was not sufficiently sophisticated to store the complex Agile tariff (where unit cost changes every 30 minutes).
I recently learned that Hildebrand now had the ability to take the tariff directly from Octopus Energy via API, bypassing the incorrect tariff data in the meter. A quick support email to Hildebrand confirmed that this was not only possible, but also that the cost data would be corrected back to when I bought the Glow Stick back in 2018. A few days later and the conversion was complete.
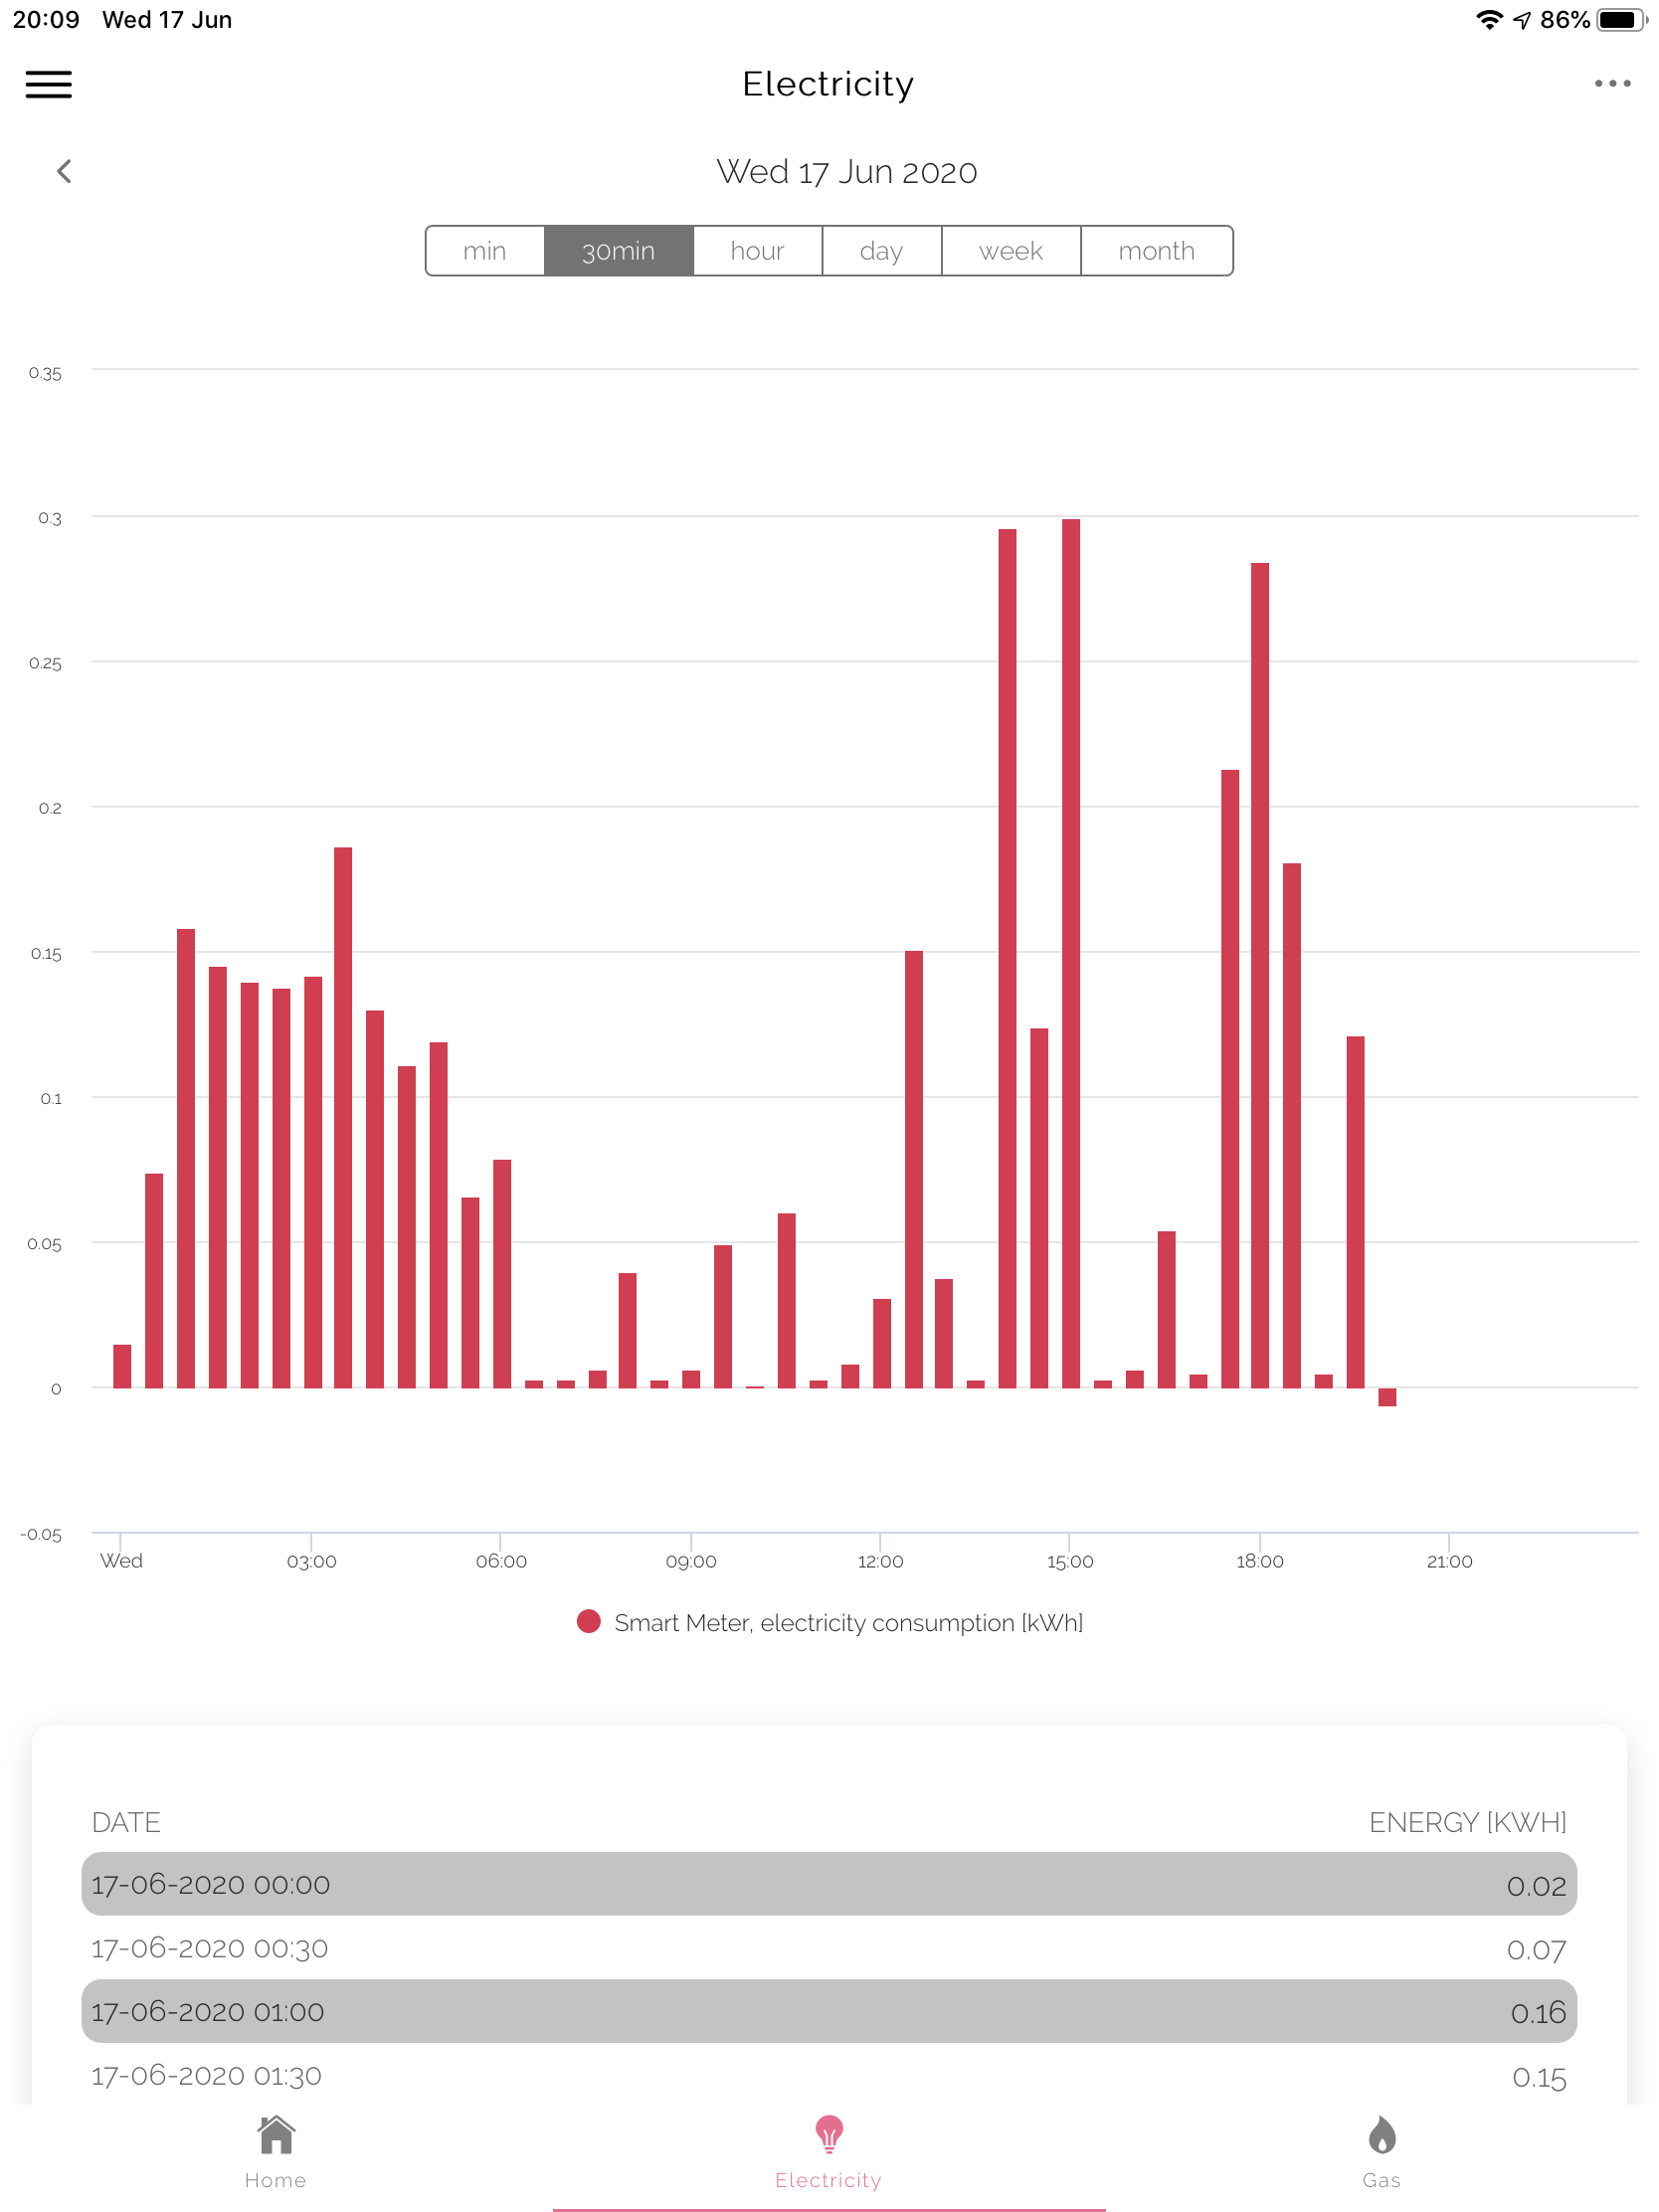
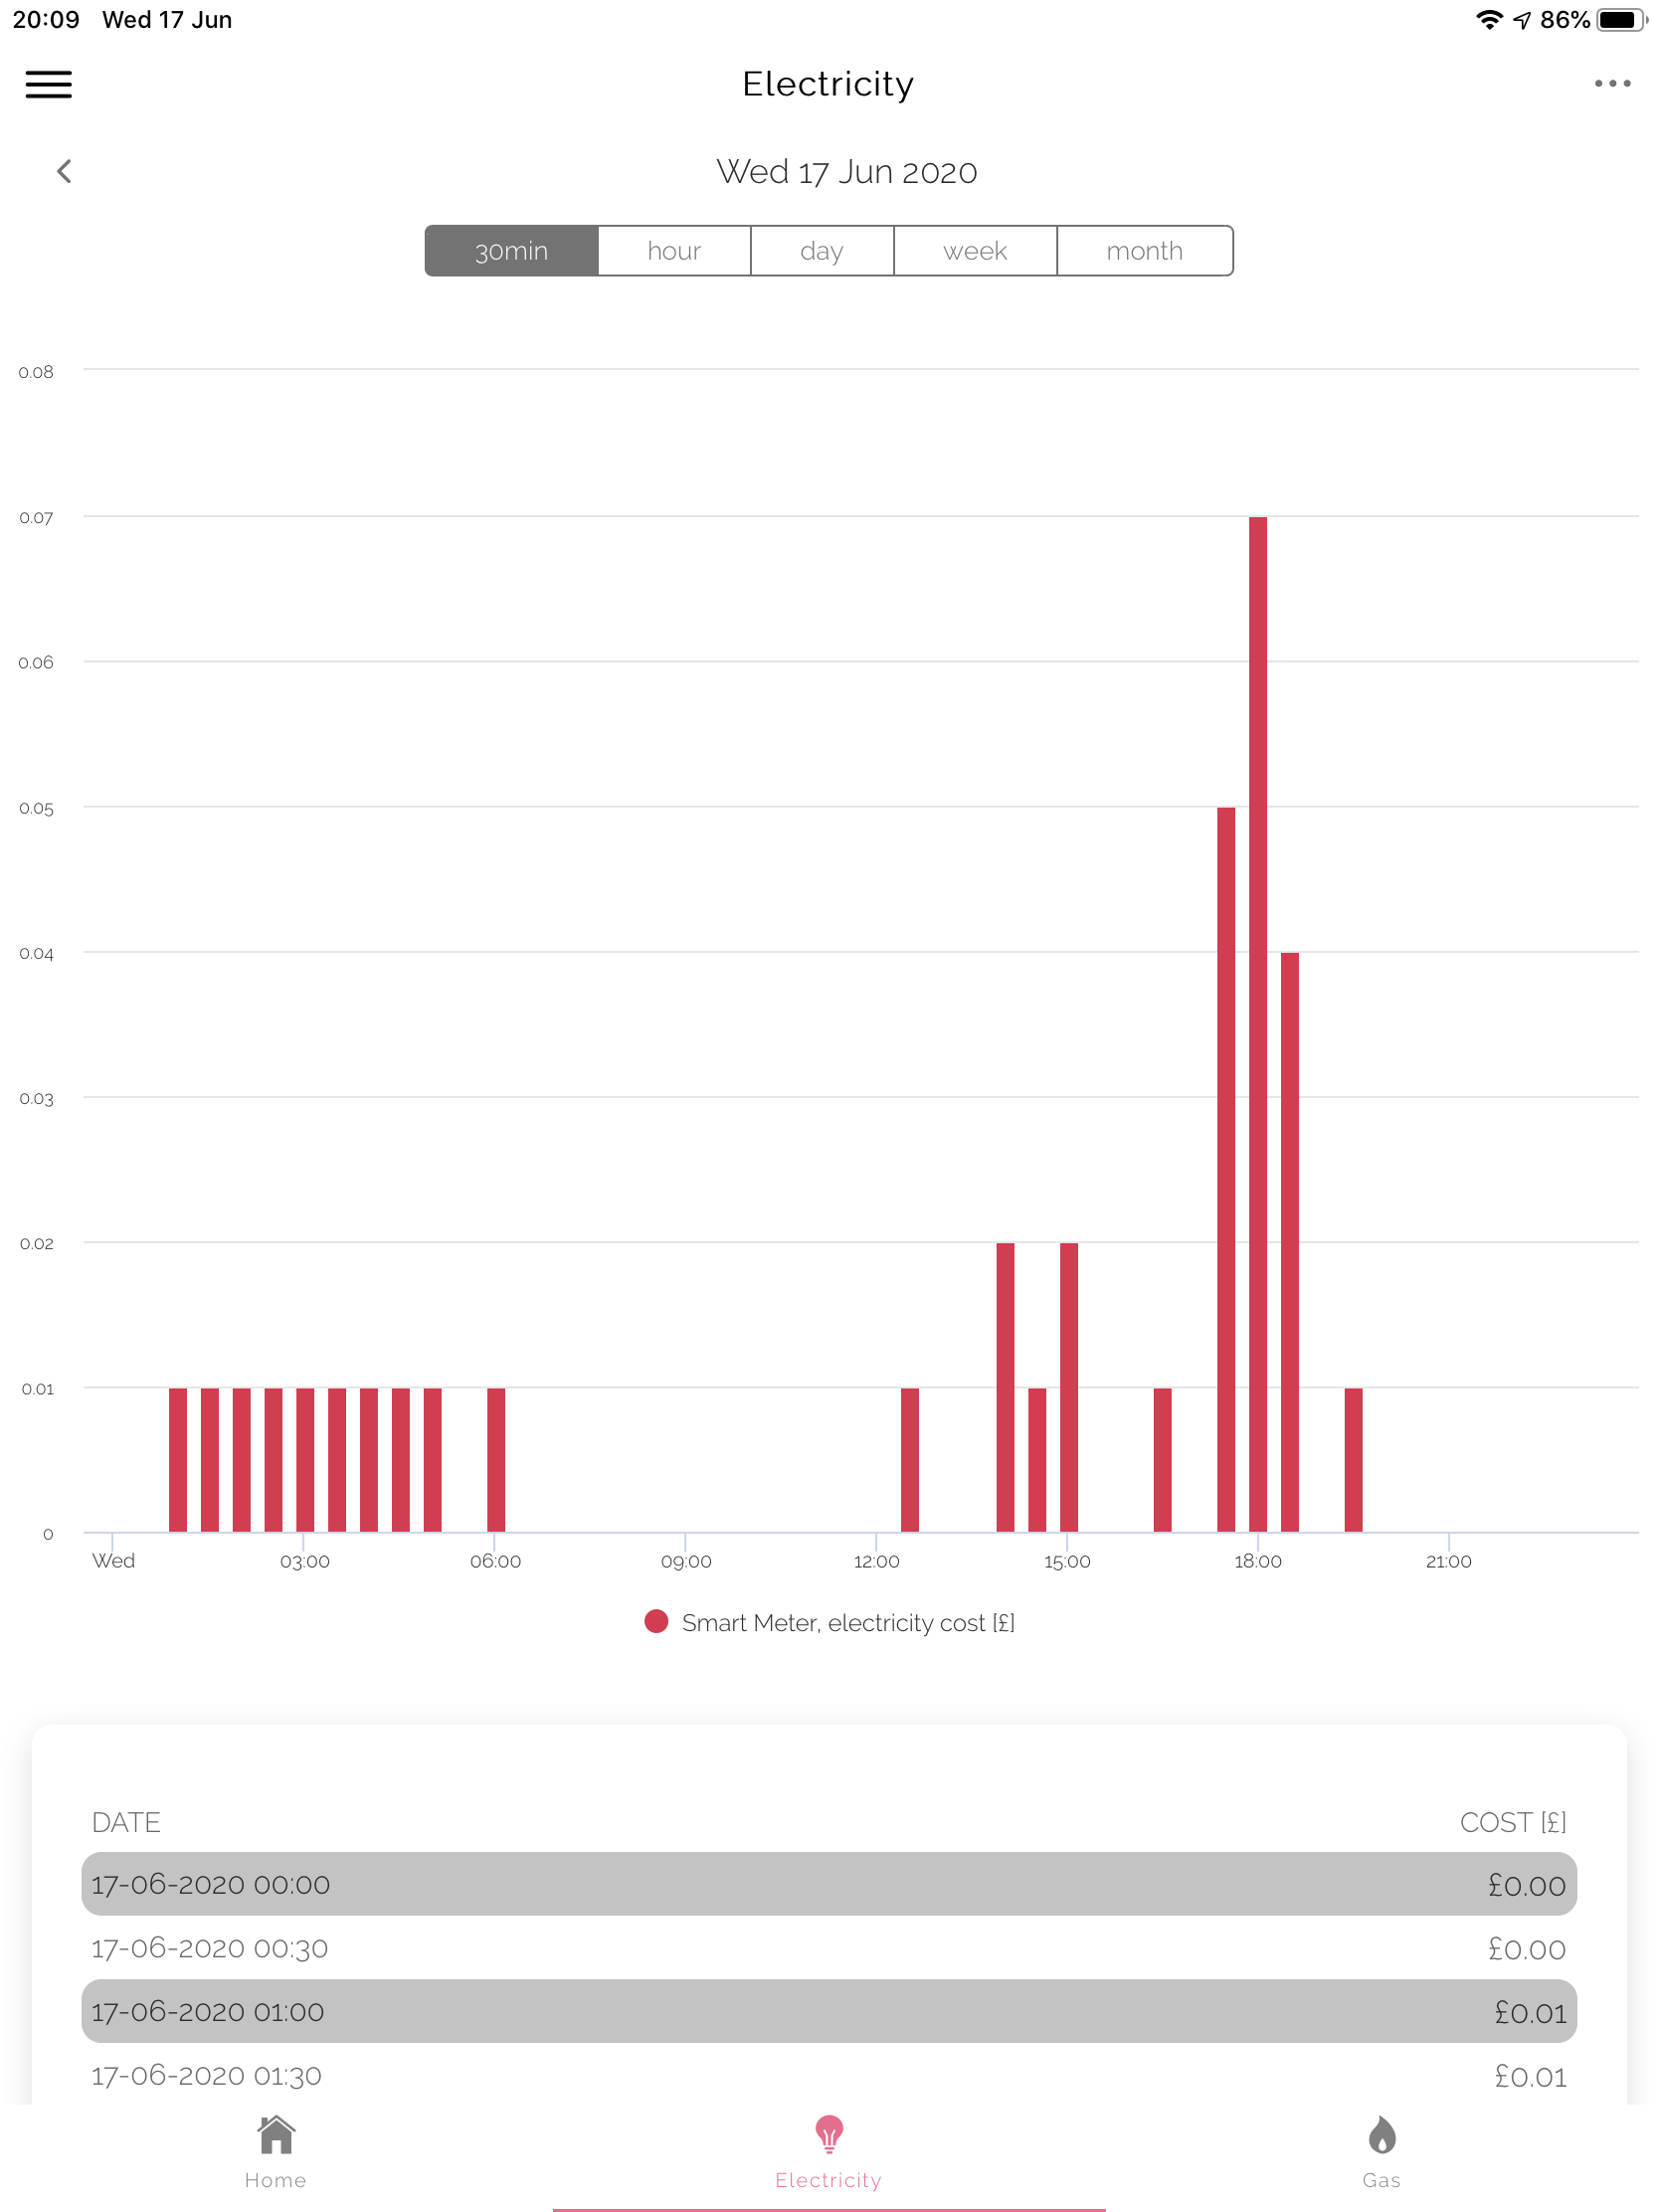
These two views show today’s part-complete data:
Energy view
Cost view
The screenshot on the left shows today’s part-complete energy data. That on the right shows the equivalent cost data. Had the unit rate been constant throughout the day then the two profiles would have been proportional, but instead the screenshots show the magnifying impact of the higher unit rates in the four to seven PM window with equivalent consumption to the late afternoon resulting in rather higher costs.
I should emphasise however that my average unit rate is very low as I usually have much higher consumption in low cost periods than I do in high cost periods.
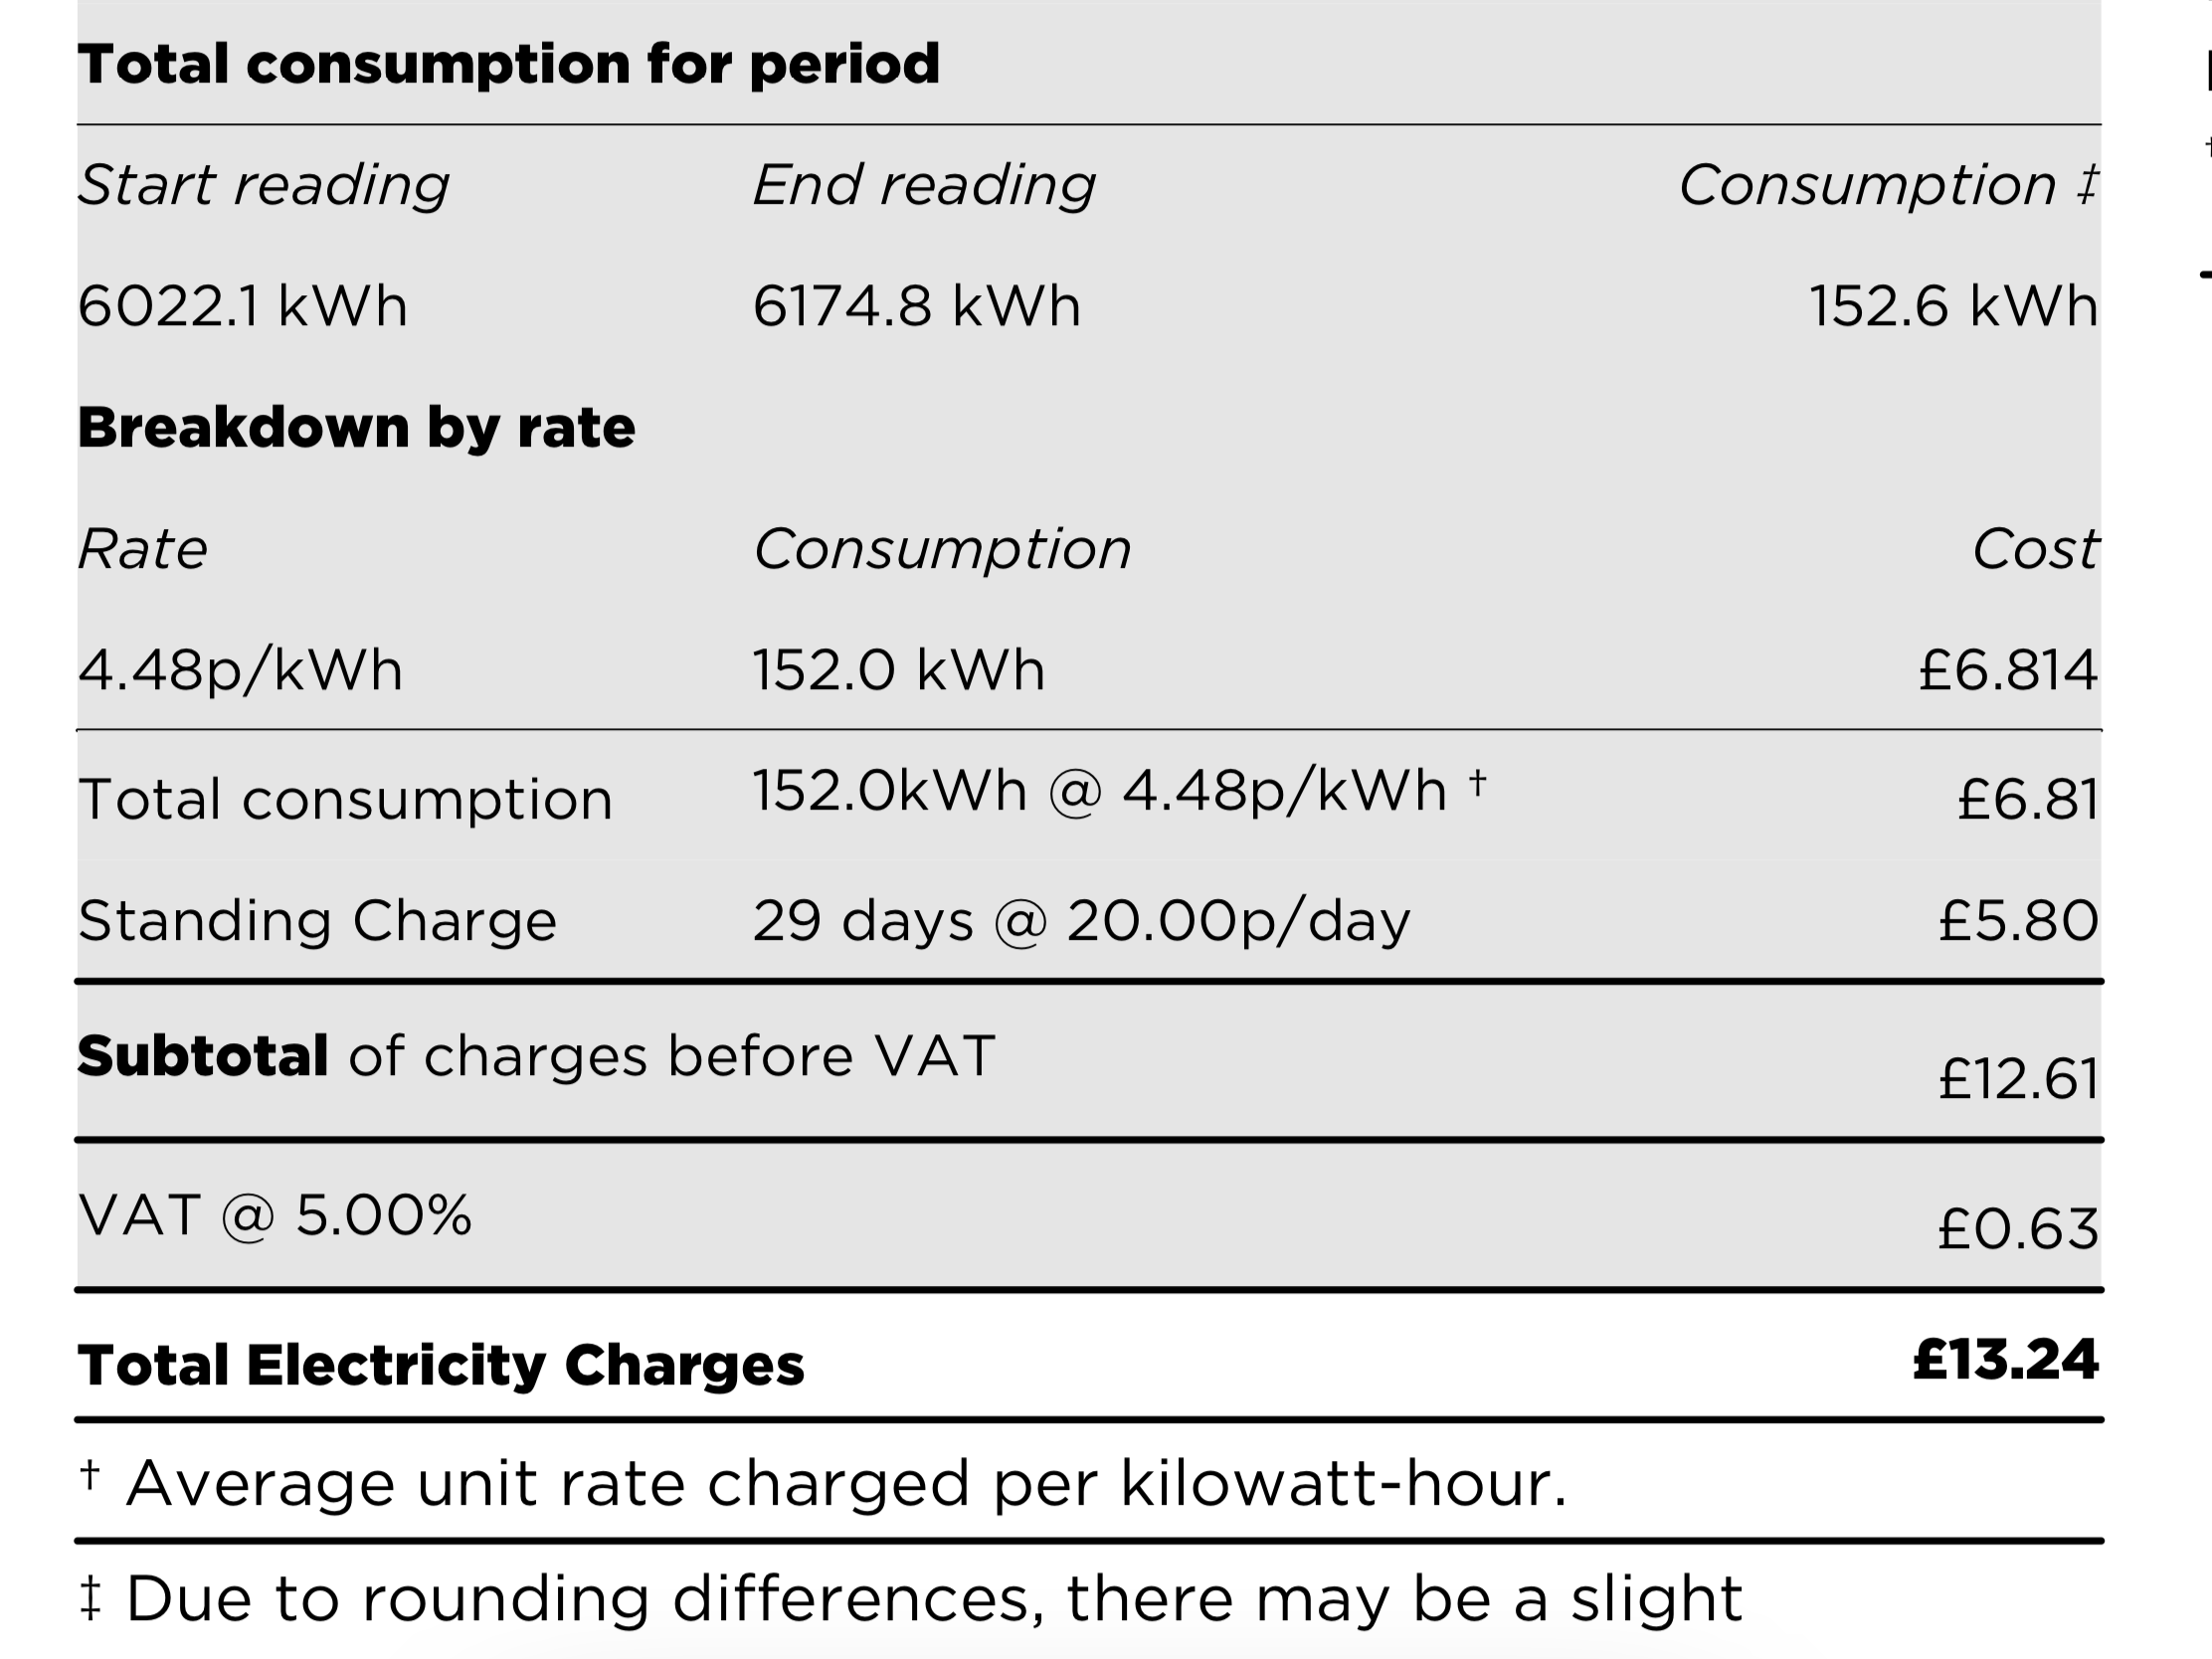
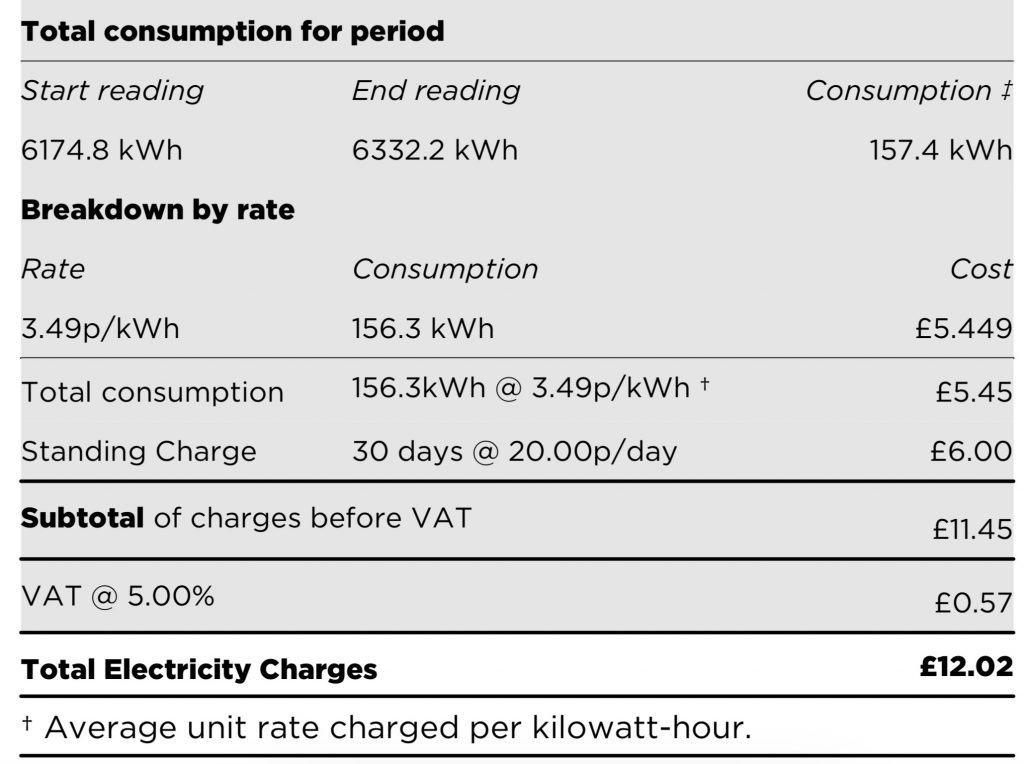
My electricity bill to May 2020
One of my recent electricity bills had an average of 3.49 p/kWh ex-VAT. Half-hourly rates varied between around minus 10 p/kWh (I.e. I was paid to use electricity) to plus 25 p/kWh. A low average price was achieved by shifting electricity consumption to when the price was lowest.
My next step is likely to be to use the API to get the real time household load for load management as an increasing number of electrical consumers (potentially a second car charger) risks overloading my supply fuse if all loads were on simultaneously.
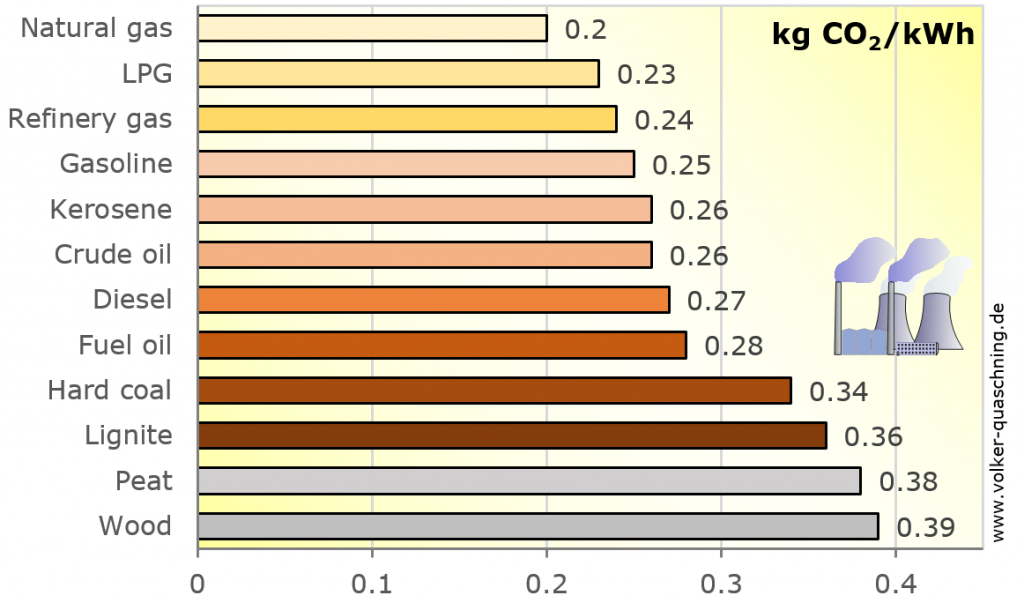
CO2 production is increasingly of interest as the world struggles to limit man-made climate change. As we use different energy sources each represents a certainly amount of CO2 reflecting a combination of the energy invested to create that power source (e.g. the wind turbine may generate wholly renewable power, but its construction created some CO2) and the CO2 created as it generates energy once constructed (nothing for renewables but relatively high for fossil-fuelled generation).
I’ve previously shared this table showing the IPCC’s view of the embedded CO2 in different sources of electricity generation.
IPCC’s view of embedded CO2 in different sources of electricity generation
A recent question and resulting discussion in an on-line forum prompted me to think more about the area of embedded CO2.
My first observation would be that my rooftop solar panels do quite well on this scale with a CO2 figure of 41 gCO2/kWh.
The second observation would be regarding energy storage. My view would be that any energy storage device from a small scale domestic battery like my own to a large pump storage scheme can never deliver better embedded CO2 that the source of its energy. So, for example, if I charge my battery from my own solar at 41 gCO2/kWh with a cycle efficiency of 80% (the maker’s claim) then the embedded CO2 in the energy coming out of the battery cannot be better than 41 gCO2/kWh / 80% = 51 gCO2/kWh. Indeed it would be worse than that as this doesn’t account for the CO2 generated in creating the battery nor its operational life, but I don’t have figures for those.
Example of UK grid CO2 intensity
Thirdly, as my own embedded CO2 is relatively low whether exported directly from my panels or indirectly via the storage battery, then the CO2 intensity of the grid always benefits from my export. The 116 gCO2/kWh illustrated above is pretty low for the UK grid which varies widely but is still more than my solar PV directly or stored solar PV. Indeed had I exported onto the grid at the time illustrated above then my 41 gCO2/kWh versus the grid’s 116 gCO2/kWh would have saved 75 gCO2 for each kWh that I exported.
However if, for example, I export electricity but need to then buy more gas to make hot water then that too has a CO2 impact.
If I need to buy a kWh of gas to make hot water that’s 0.2 kgCO2/kWh or 200 gCO2/kWh even before I’ve accounted for the relative inefficiency of the gas boiler versus my electric immersion heater. If I assume that the gas boiler is 90% efficient then I will be responsible for 200 gCO2/kWh / 90% = 222 gCO2/kWh for a kWh used to make hot water. Thus, while exporting 1 kWh of solar PV may save the electricity grid 75 gCO2/kWh, it’s added 222 gCO2/kWh to gas consumption – a net deterioration of 147 gCO2/kWh.
Natural gas of course is the lowest CO2 of the fossil fuels listed above – if your home is heated by oil, coal or wood then the analysis is further skewed towards using your own self-generated power rather than exporting electricity and importing another fuel for heating.
The electricity grid’s carbon intensity also varies. In 2019 the UK average was 256 gCO2/kWh (a little higher than my estimate for gas) however this varies considerably through the year with the highest embedded CO2 in early winter evenings when I have little if any solar PV to contribute to the grid, and may well be lowest when I and others have surplus solar PV. My understanding is that the lowest grid CO2 occurs with a combination of high renewables (such as particularly windy weather) coupled with low demand (such as summer nights).
Thus my own strategy is to:
Maximise self-consumption of my own solar PV as my energy source with the lowest embedded CO2 (except in the event of an extreme plunge pricing event when the grid is under highest stress)
Make best use of storage to minimise consumption from the grid in the evening peaks when embedded CO2 is likely to be highest.
When a solar-shortfall is anticipated then buy electricity selectively from the grid at lowest CO2 (using Agile electricity price as a surrogate for CO2).
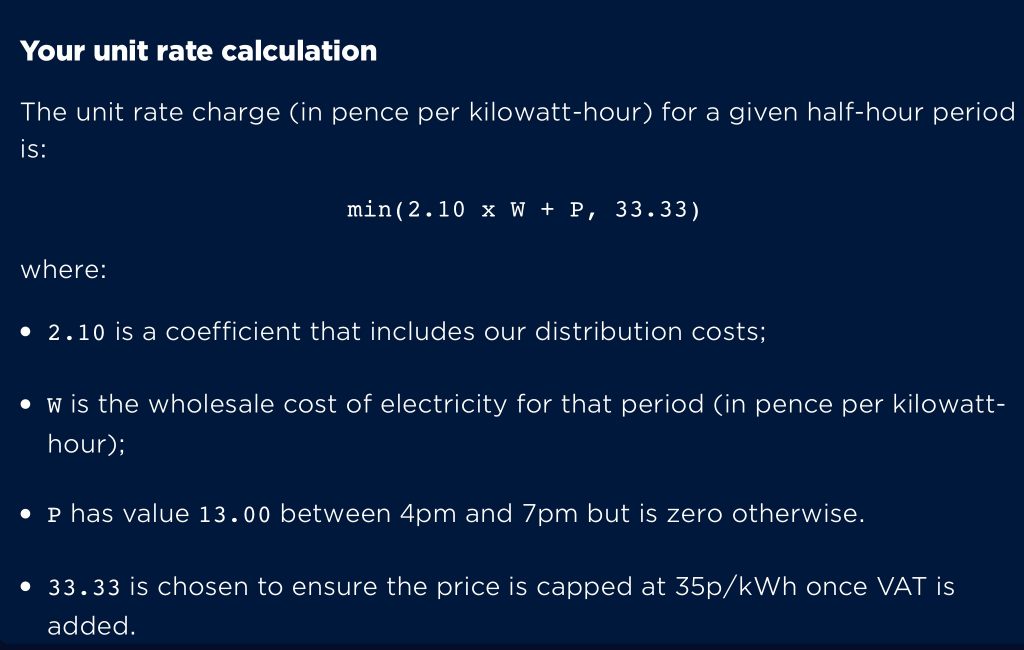
Much of the optimisation of my home exploits the cost-saving potential of the Octopus Agile electricity tariff. This tariff is a radical departure from a typical UK tariff. Rather than a fixed unit price that applies 24/7, the Agile tariff exploits the smart meter to provide up to 48 different half-hourly prices per day which change day-to-day according to a formula linked to daily electricity auctions in an absolutely transparent manner.
Octopus’ transparent pricing
The prices can vary from several pence per kWh negative (i.e. being paid to use electricity) to a cap at 35 p/kWh which might apply in the early evening. That therefore places a some risk on the consumer, but equally can provide significant benefit. There are regional differences in the equation reflecting variation in the costs to distribute electricity in different parts of the country, so your formula might not be exactly the same as mine, but will be very similar.
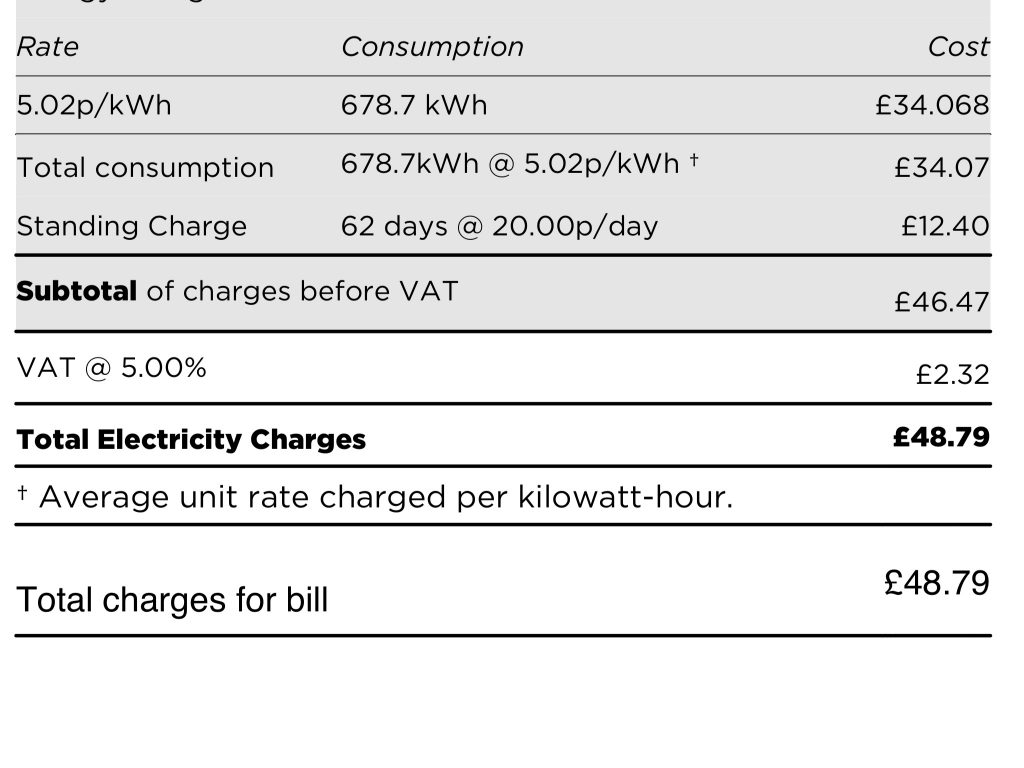
Agile bill summary for two months ending mid-April 2020.
That average 5.02 p/kWh is not just competitive versus other tariffs – it tramples all over them. Personally I’m continually plagued by advertising claiming to save me £100s versus existing tariffs, but none ever comes remotely close to this rate. Thus, with my consumption pattern, I think that this is an unrivalled tariff. The Energy Saving Trust has calculated the average UK electricity cost at 15.75 p/kWh as at March 2019 (their latest analysis at the time of writing), so I’m currently paying a third of that average rate.
Of course you won’t ever see this tariff recommended on a switching website. Indeed, I’ve never seen any smart tariff recommended on a switching website, because they only ever seem to offer the choice between flat rate tariffs and Economy 7. In my opinion the lack of smart tariffs always denies consumers access to what may genuinely be the cheapest tariff for them by short term switches between tariffs that are pretty much alike. Those switching sites don’t want consumers to find long-term value, instead they want consumers to keep switching so that they keep earning commission.
However for me, not only have Octopus demonstrated long-term value, but they provide 100% renewable power, and are the only electricity company to be Which? recommended for 3 consecutive years. For you there’s a further £50 to be saved if you click on the image below and sign-up for any one of Octopus’ tariffs.
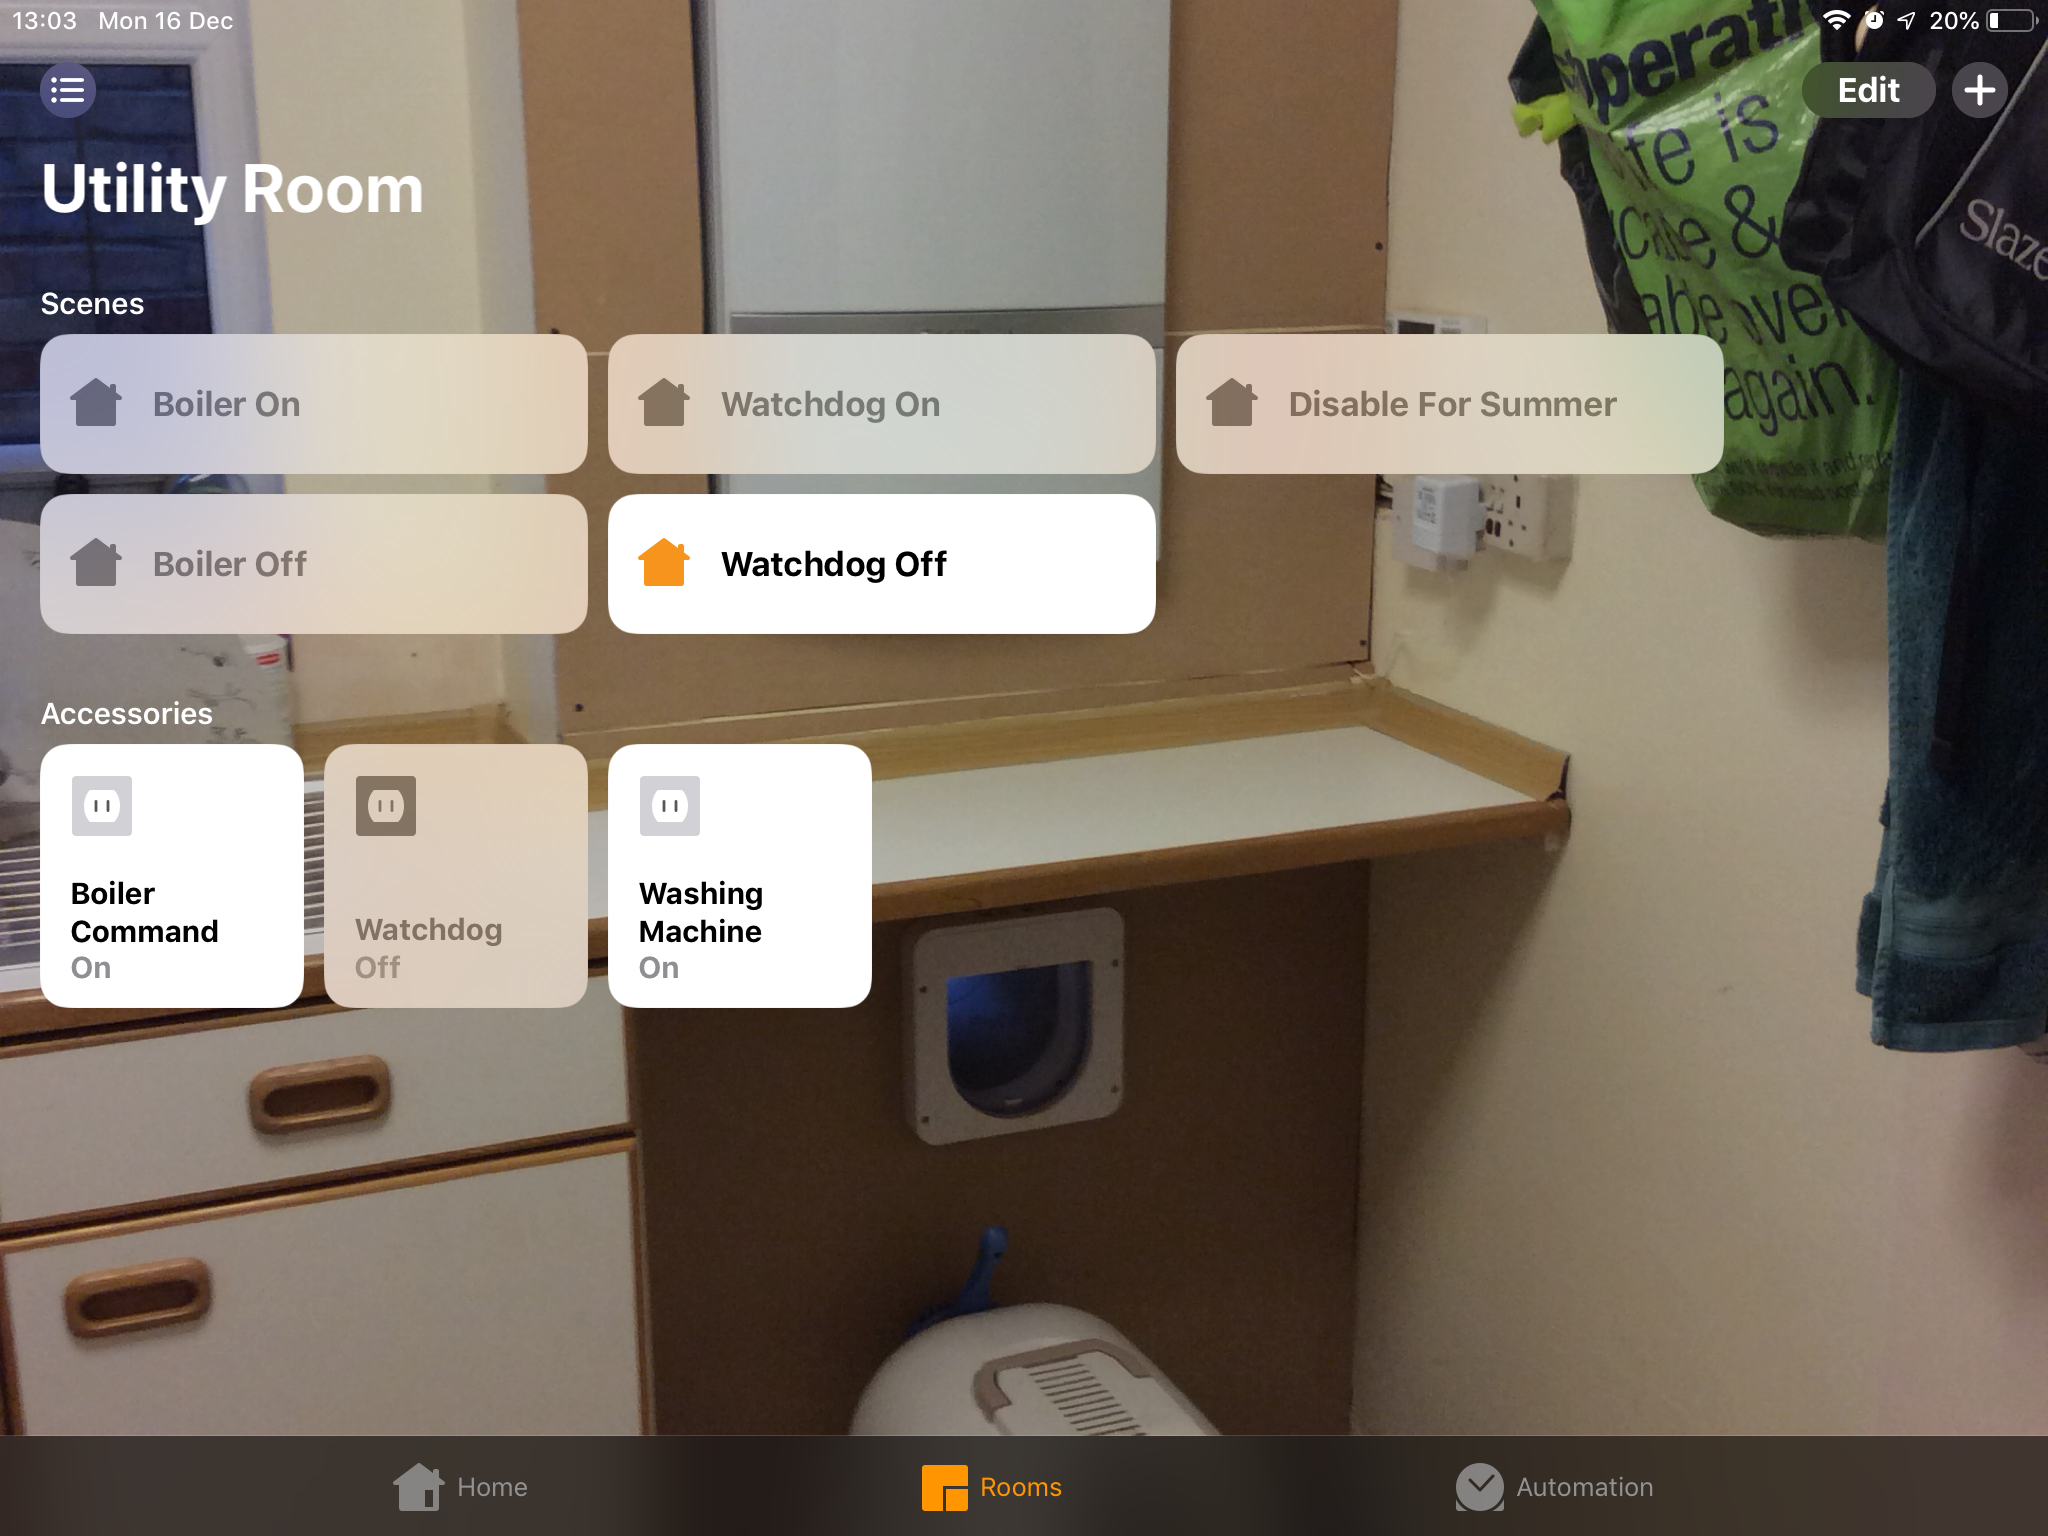
One of the consequences of integrating a smart home is the large number of different apps, web portals and potentially sources of APIs involved. The ones I use include:
Bright
Eve
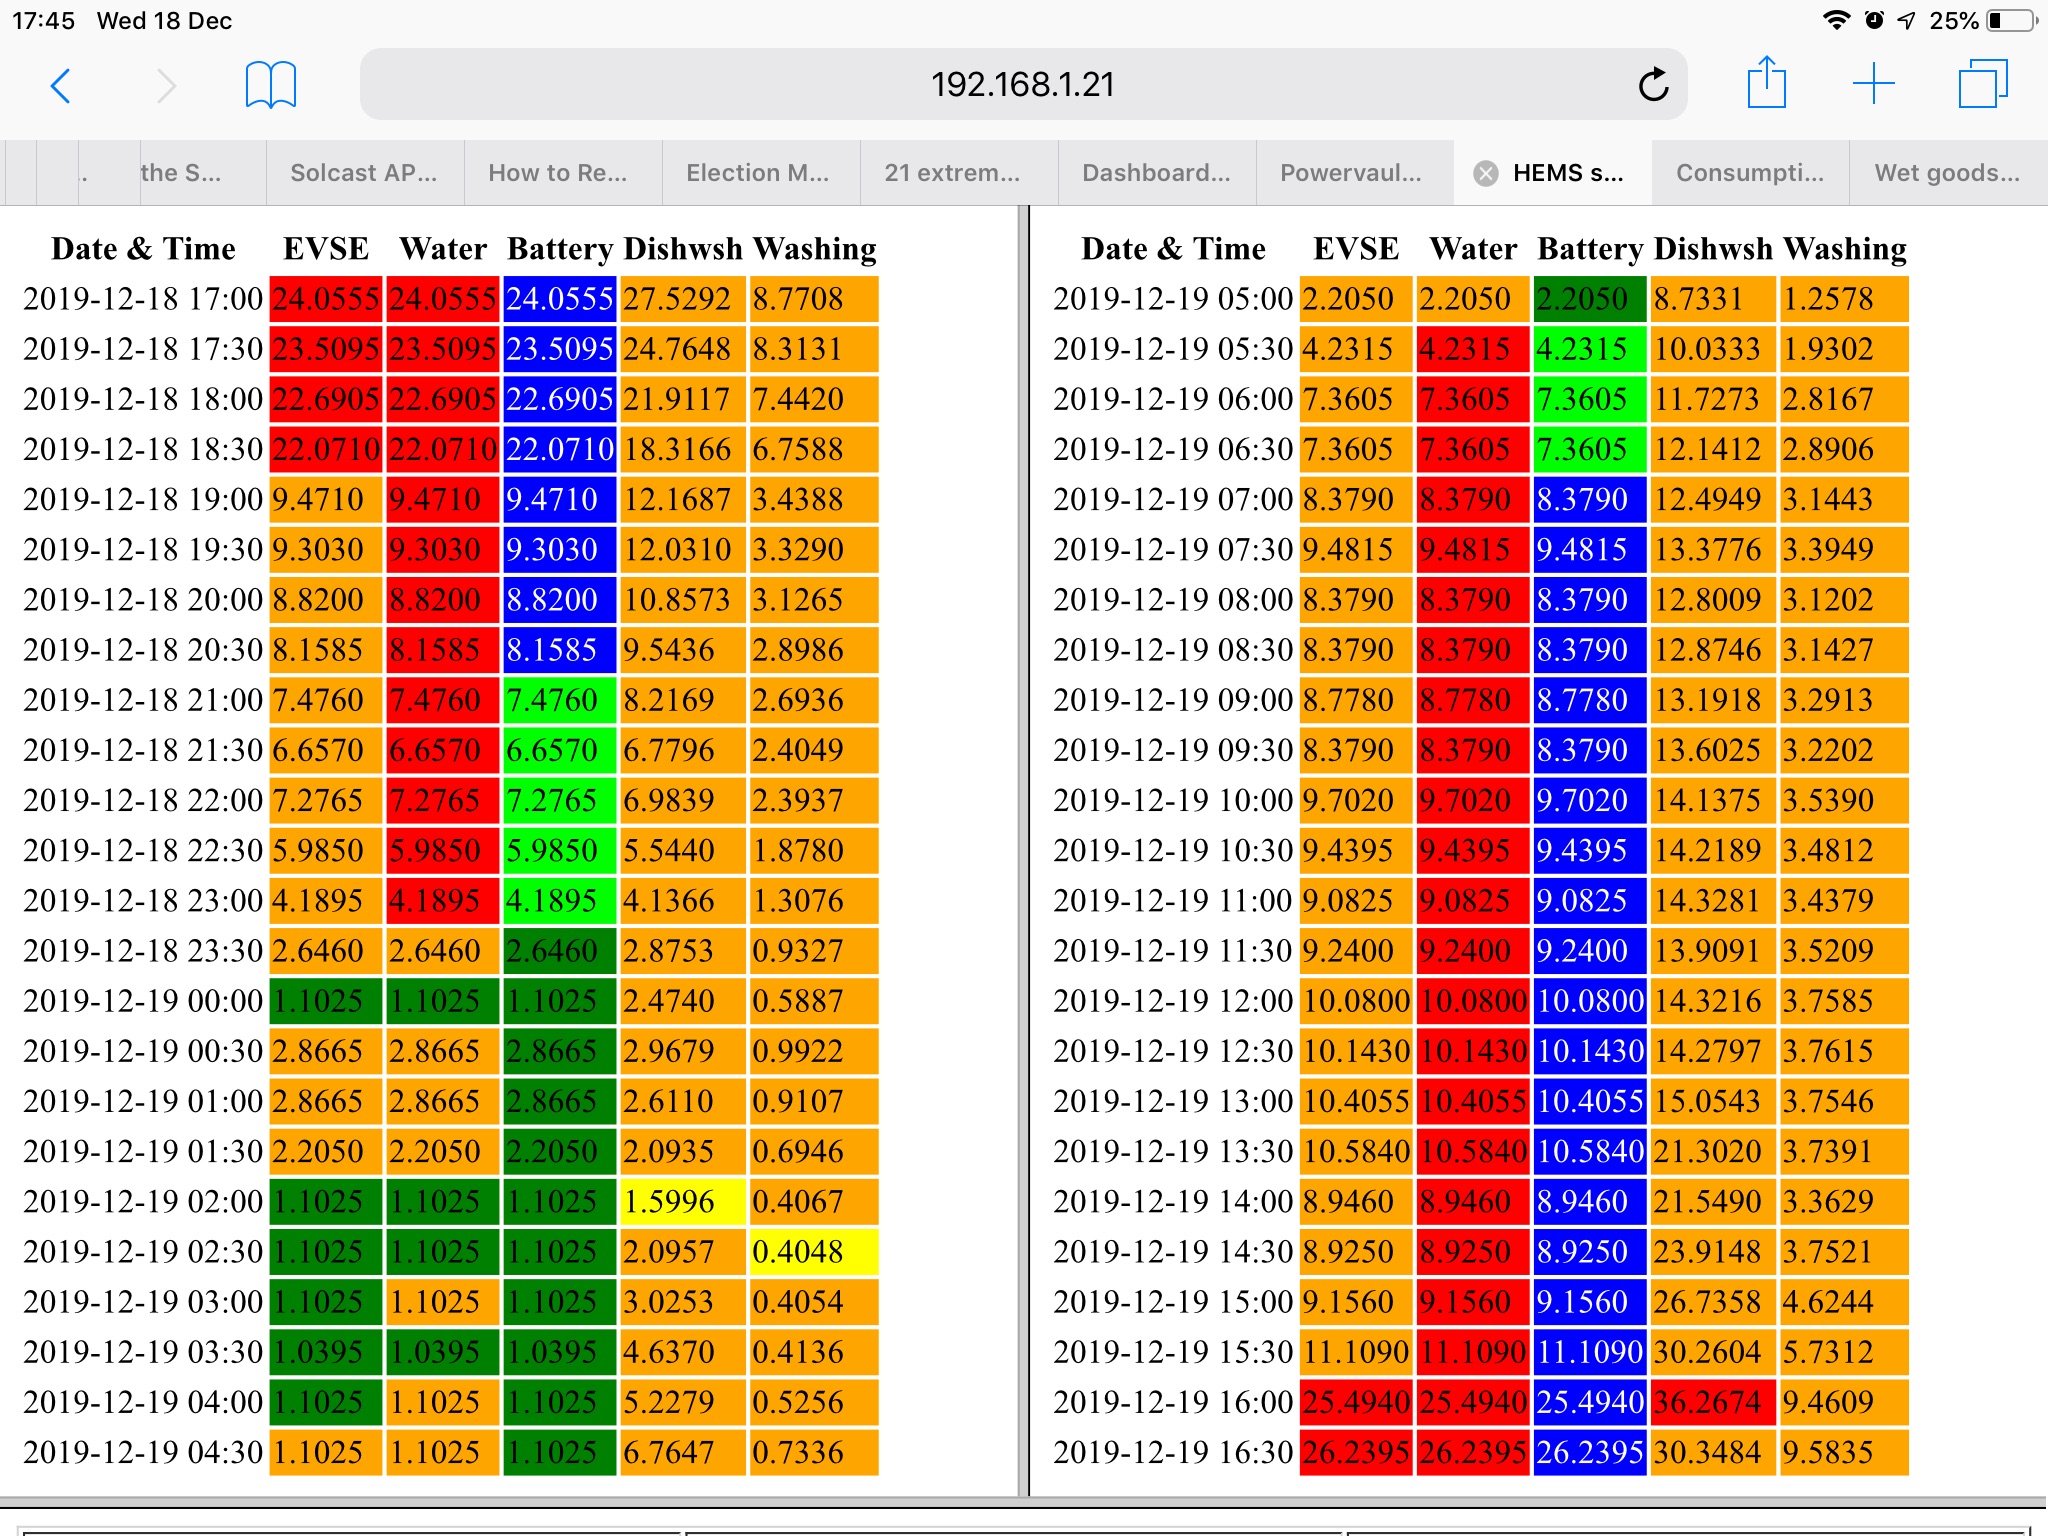
HEMS
Home
Immersun
OctoWatchdog
Powervault
WIFIPLUG
Title
App
Portal
API
Purpose
Comment
Bright
Y
N
Y
Reads and stores consumption from smart meter.
No price data for my tariff due to smart meter limitations.
Eve
Y /3
N
N
Eve’s alternative to Home for all HomeKit accessories with additional functionality for Eve’s own devices.
I prefer this to Home for editing rules. I use Eve products mostly for central heating control.
Home
Y /3
N
N
Apple’s own app for the HomeKit smart home ecosystem.
Need to refer to device manufacturers own apps (such as Eve or WIFIPLUG) for some configuration and data.
HEMS
N
Y
N
My own web portal to view HEMS schedule and status via Apache web-server on Raspberry Pi.
MyImmersun
Y
Y
Y /1
Control of ImmerSUN power diverter.
Available API provides some measurement and status data as per main screen of the app.
Powervault
N
Y
Y /2
Control of Powervault storage system.
Available APIs provide some user scheduling and status capability.
OctoWatchdog
Y /3
Y
Y
Future cost, and historic costs and consumption (30 prior days) from Octopus (electricity supplier).
APIs provided by Octopus. App developed by an enthusiast using Octopus APIs. Octopus’s own web portal provides historic consumption but does not pair this with cost. Monthly statements show graph of consumption and cost for each day.
WIFIPLUG
Y
N
Y
Control and measurements from own brand smart plugs.
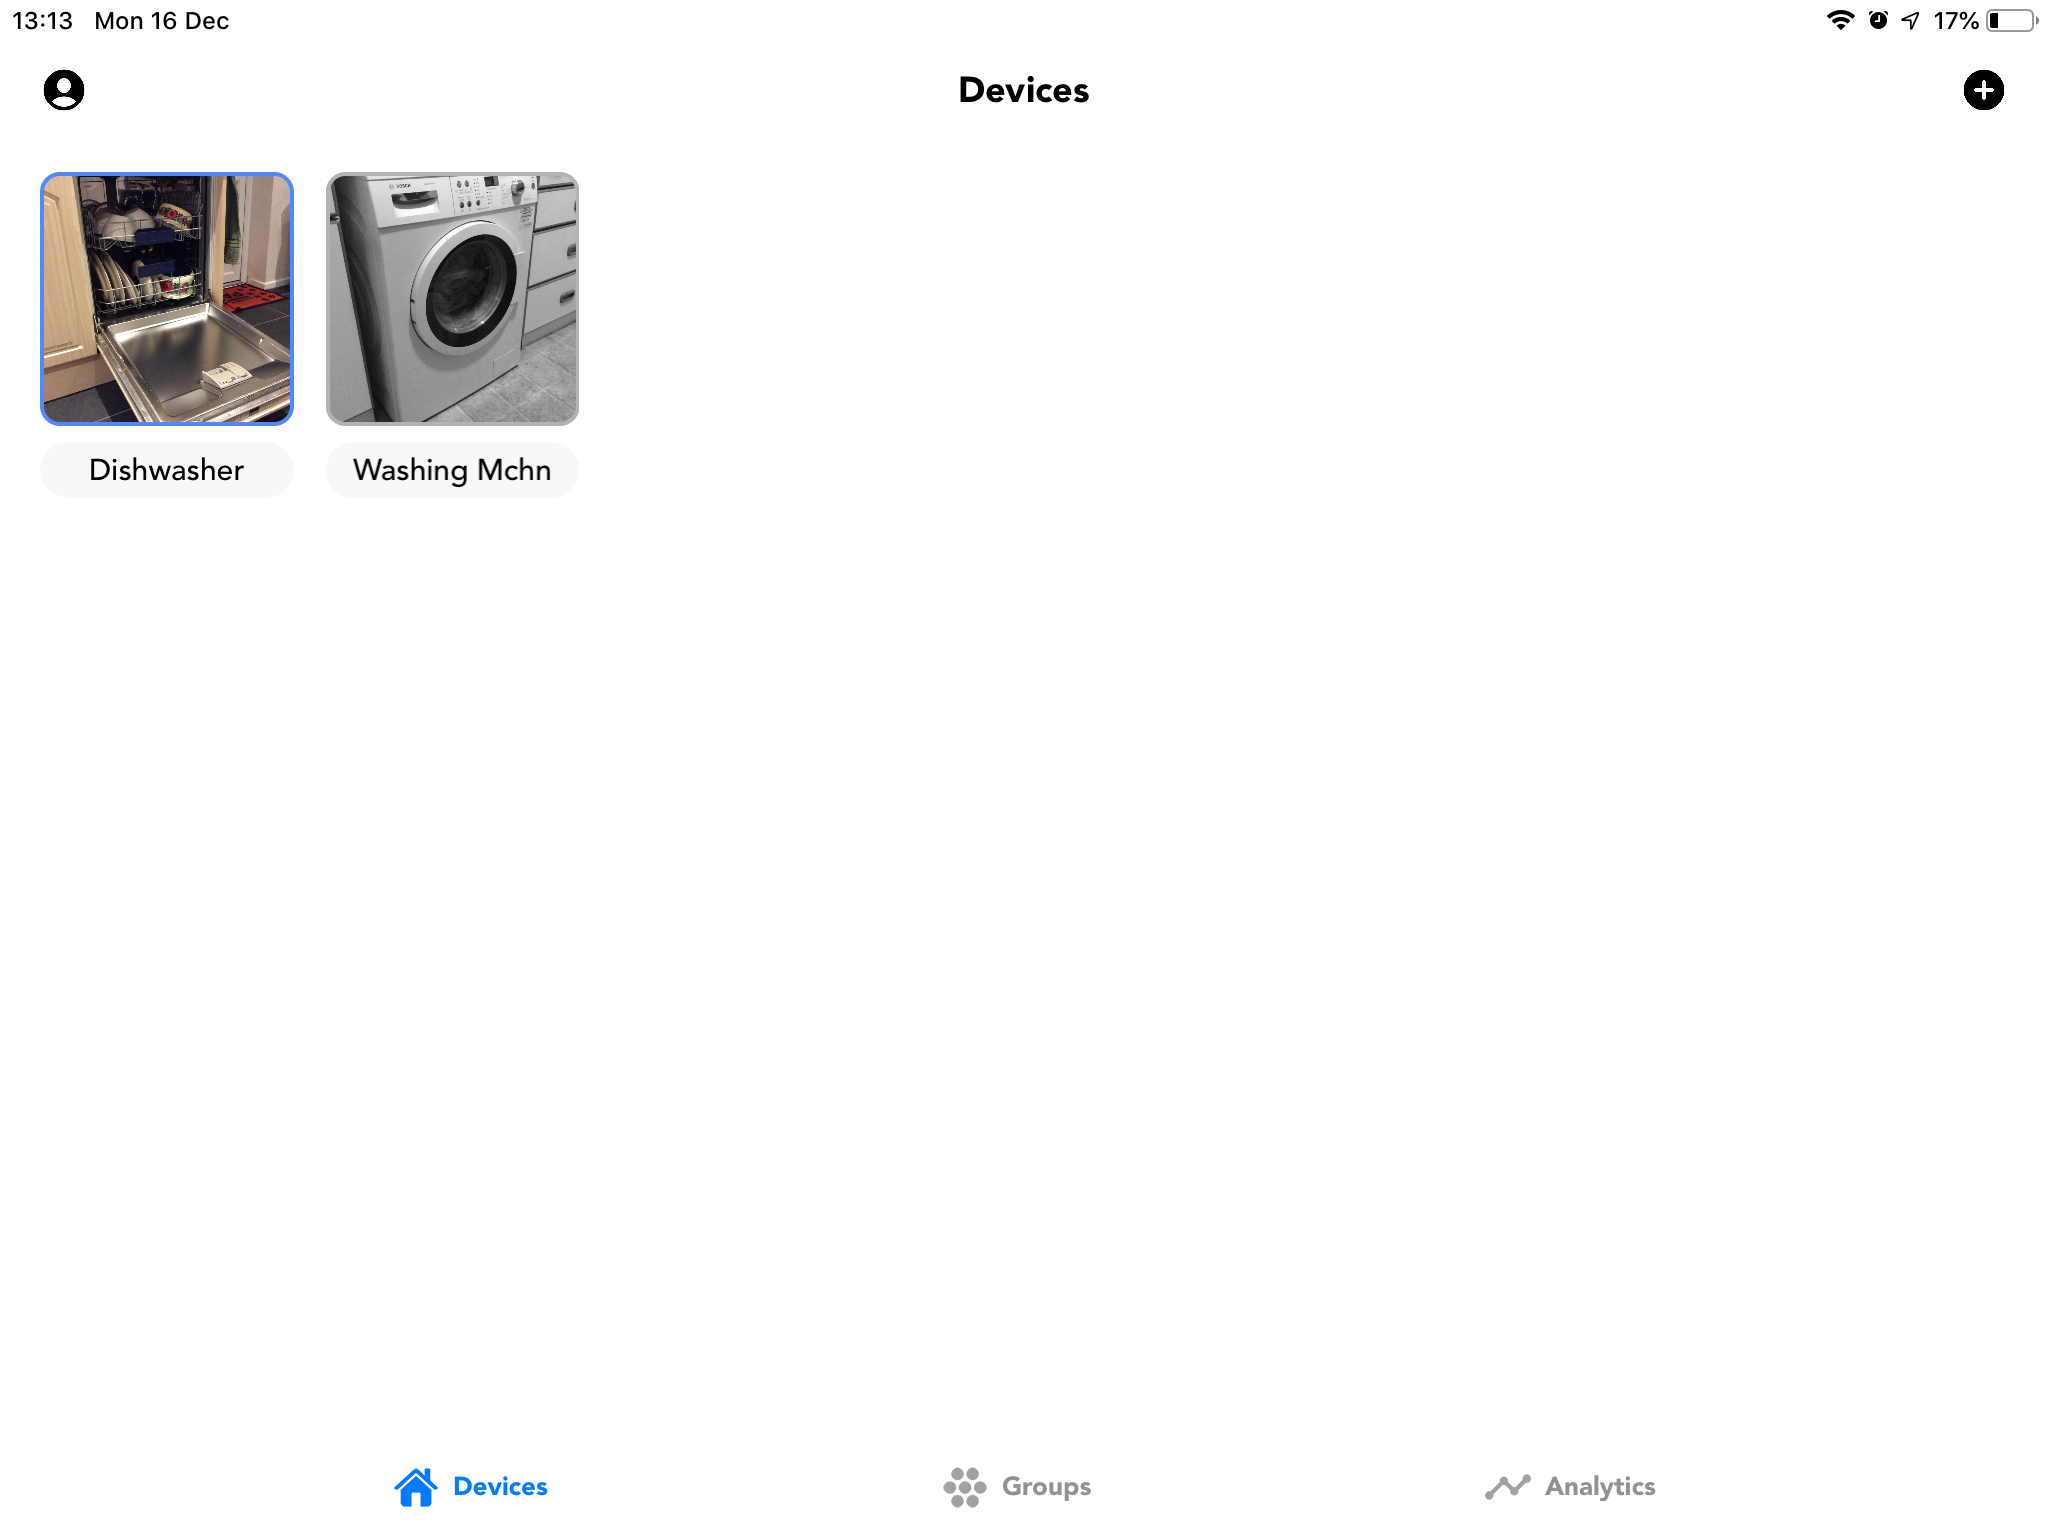
Plugs also appear in Home and Eve apps. I use for dishwasher and washing machine.
Notes to table:
APIs not officially released. Reverse-engineered by an enthusiast and available on line.
APIs not officially released. Used as part of a sponsored trial when I first got the battery and re-used by myself with some manufacturer support.
iOS only. Not available for Android.
Some of these apps have similarities:
Both Bright and OctoWatchdog show whole of house energy consumption (and potentially cost) derived from the smart meter. However they have differences too. A smart meter sits on two networks: (i) the Wide Area Network (WAN) via which the meter communicates with the energy supplier and (ii) the Home Area Network (HAN) which links the devices in the home (electricity meter, gas meter, CADs/IHD and gateway). Bright connects to the HAN via small piece of hardware called a Glow Stick Wi-Fi CAD and collects its own data in real time and stores its own records of energy consumption in the cloud; while OctoWatchdog involves no extra in-home hardware, and takes data a day in arrears from Octopus not storing anything in the cloud itself. Bright’s USP is the real time consumption and current day’s data (neither of which OctoWatchdog supports), while OctoWatchdog’s USP is the availability of electricity price which isn’t available from the meter.
Both Eve and Home interact with all devices in the whole HomeKit ecosystem. Eve is best for creating rules and has more ability to configure Eve’s own devices, while Home is best for sharing access with family members. WIFIPLUG’s app is more limited only interacting with their own devices, and thus cannot see Eve or other HomeKit devices.
Both MyImmersun and WIFIPLUG apps, and the Powervault portal, allow configuration of their own manufacturer devices. They all have, for example, timer capability and data logging. MyImmersun is better for giving a whole-of-home view showing solar panel output and net input to house (so provides a more comprehensive energy monitor), Powervault shows no solar panel output but does give a view of whole-of-home, while WIFIPLUG provides only a view of the energy consumption of devices plugged in to the WIFIPLUGs.
After a series of quite detailed posts, I think that the time has come for an updated high level overview of what we have.
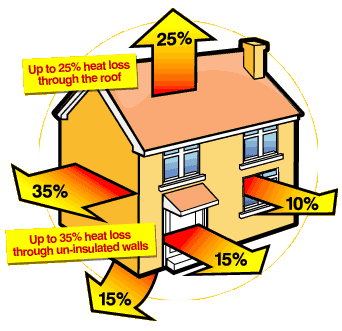
Heat loss from the home
We moved to our early 1970s house almost 4 years ago bringing with us our electric vehicle. The house had already been refurbished with new double-glazed windows, had cavity insulation (although that wasn’t recorded on EPC so must have predated the prior owners), and a token level of loft insulation. The existing gas boiler was arthritic, couldn’t heat the whole house, but was quite good at heating the header tanks in the loft! We had gravity-fed gas hot water (i.e. no thermostat or pump on the cylinder) which was completely obsolete, the cylinder dated back to the building of the house and had no immersion heater (although we had the wiring for one). So what did we do?
Space heating:
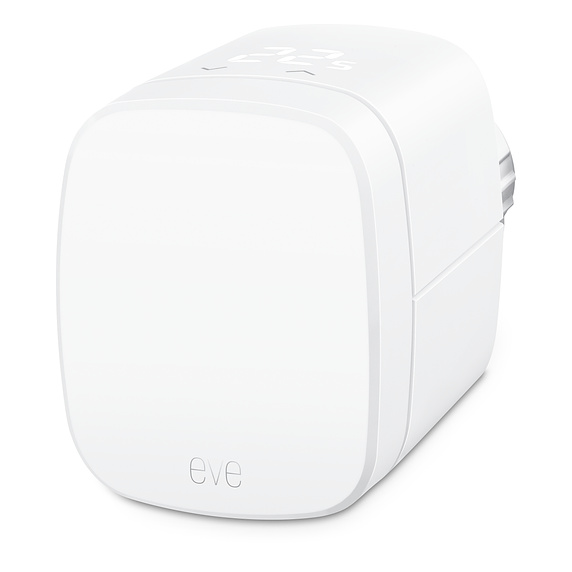
Eve Thermo eTRV
We substantially increased the loft insulation to reduce heat loss.
We had a modern condensing gas boiler installed to improve efficiency.
We updated to smart controls using eTRVs to set both temperature set points and schedules at room level. I built a smart interface to the boiler so that heating can be enabled remotely. I programmed a series of rules into Apple Home allowing the smart thermostats to enable the boiler when any thermostat wants heat and disable it when no thermostat wants heat. Some rooms also have additional rules linking heating to open windows or movement sensors. All of this reduces heat losses by only heating rooms that are (or will be shortly be) in use.
Electricity supply:
Solar panels
We installed our own solar panels given 4 kWp generation. (I also own a small share of a solar farm although there’s no contract that I’m aware of between that farm and my home energy supplier)
I invested in an immerSUN to maximise self-use of our own solar by enabling loads when surplus solar is available.
We switched to a green electricity supplier so when we need to buy electricity it comes from renewable sources.
We bought a small storage battery 4 kWh to store some of our solar production for use later in the day. Subsequently I can also use it in winter to buy when the electricity price is relatively low to avoid buying when the price is relatively high.
We chose a dynamic smart tariff to buy electricity at the lowest price based on market prices established the day before. The prices change each half hour and are established in the late afternoon on the day before.
Water heating:
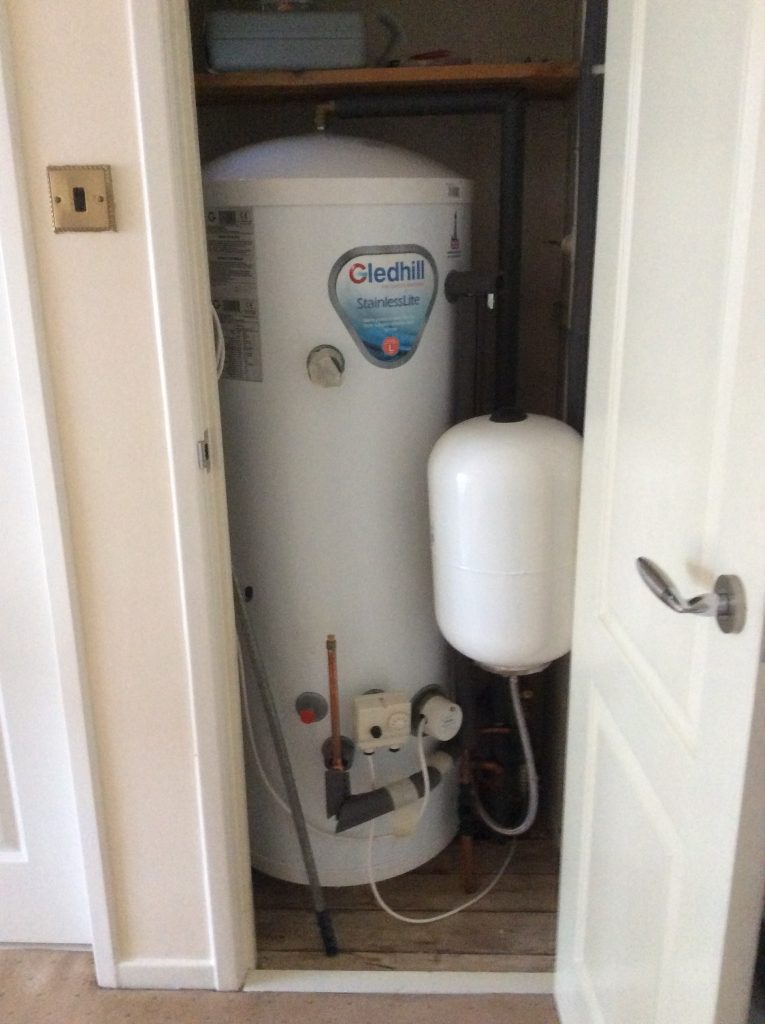
Hot water cylinder
We replaced the old hot water cylinder with a modern insulated one (to reduce heat loss) with a low immersion heater (to allow more of the water volume to be heated).
Our principal water heating is now by diverting surplus solar electricity proportionately to the immersion heater, that’s backed up by the gas boiler which is enabled briefly in the evening for water heating in case the water isn’t yet up to temperature, and when the electricity price falls below the gas price I can enable the immersion heater on full power.
All accessible hot water pipes are insulated.
Electric car charger:
Electric car charger.
I built my own electric car charger that takes an external radio signal to switch between four settings 0, 6, 10 and 16 Amps to help me adjust consumption to match to availability of output from my solar panels. (Subsequently such products were developed commercially with continuously variable current limits, but the limitations of my immersun and on/off radio signal don’t allow me to go quite that far. Having said that my car only does 0, 6, 10 and 14 Amps so I would gain no benefit from a continuously-variable charger paired with a 4-level car).
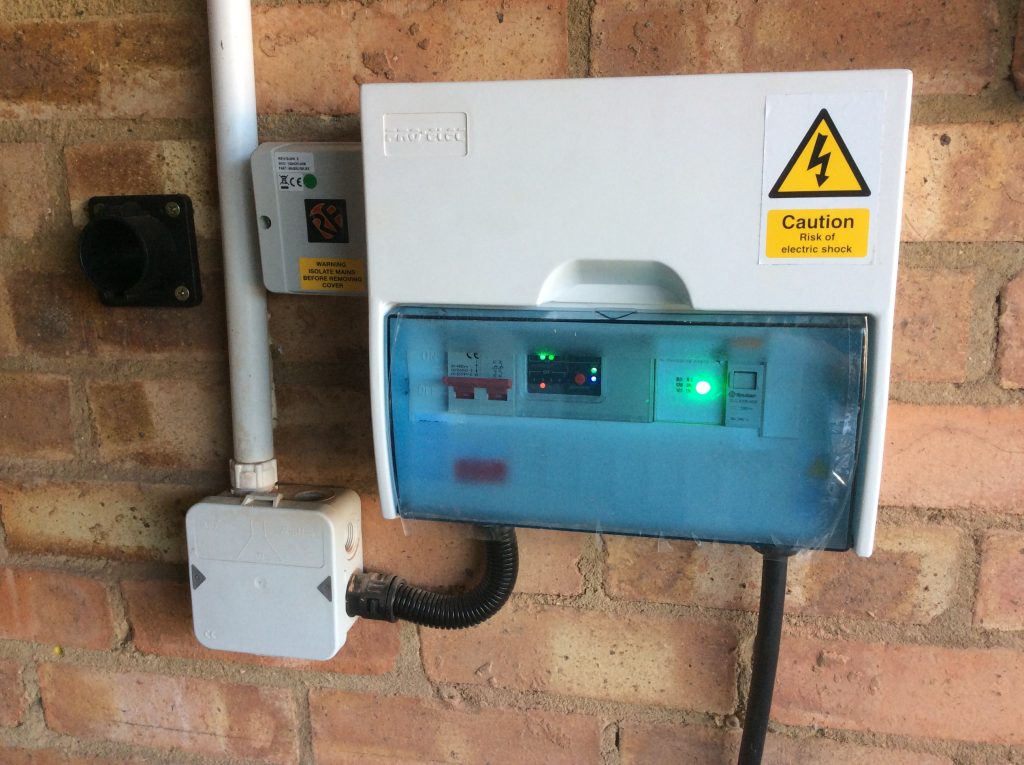
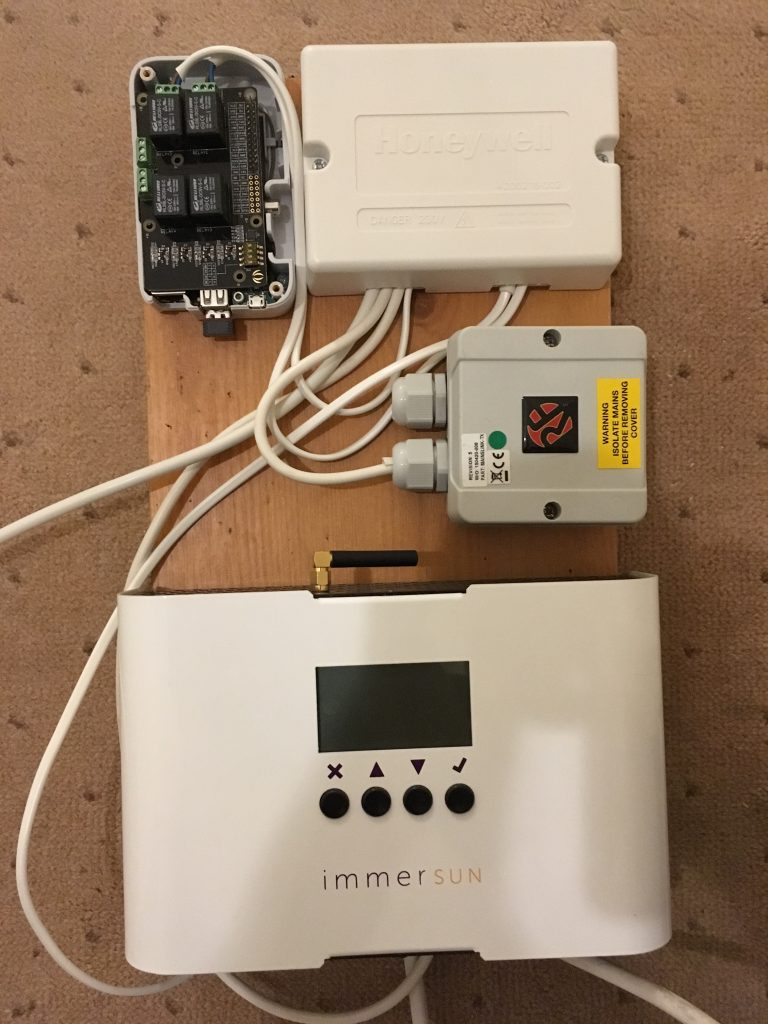
Smart electricity controls:
Smart controls top: HEMS (to manage bought electricity) and junction box mid: radio transmitter (to car charger) bottom: immersun (to manage self-consumption)
We have two systems for smart control of electricity:
The immersun to maximise self-use of our solar electricity by proportional control of loads.
A HEMS to manage the purchase of electricity (when necessary) at the lowest price by maximising consumption when the price is lowest.
When both systems want to enable loads (because the bought price is low and we have a surplus from our own panels) then cost is prioritised, so we’ll buy from the grid any demand not being met from our own panels.
Both systems are linked to 3 devices:
Battery storage. The immersun is configured to work alongside the battery storage with the battery storage as the top priority to receive surplus solar PV. The HEMS can switch the status of the battery as required to charge from the grid when the price is lowest, or to discharge when the price is highest, or indeed to revert to default behaviour.
Car charger. Second priority for the immersun after battery storage.
Immersion heater. Third priority for the immersun after car charging.
The future
I have no firm plans for the future. I’m toying with adding to the HEMS various features including:
Making the display switch between GMS and BST as appropriate (it’s all UTC at the moment).
Edit configuration via the web interface rather than a virtual terminal.
Control a domestic appliance. Our washing machine was replaced relatively recently, but the dishwasher is playing up a little and may be a candidate for HEMS integration where the optimum start time is selected to deliver lowest energy price.
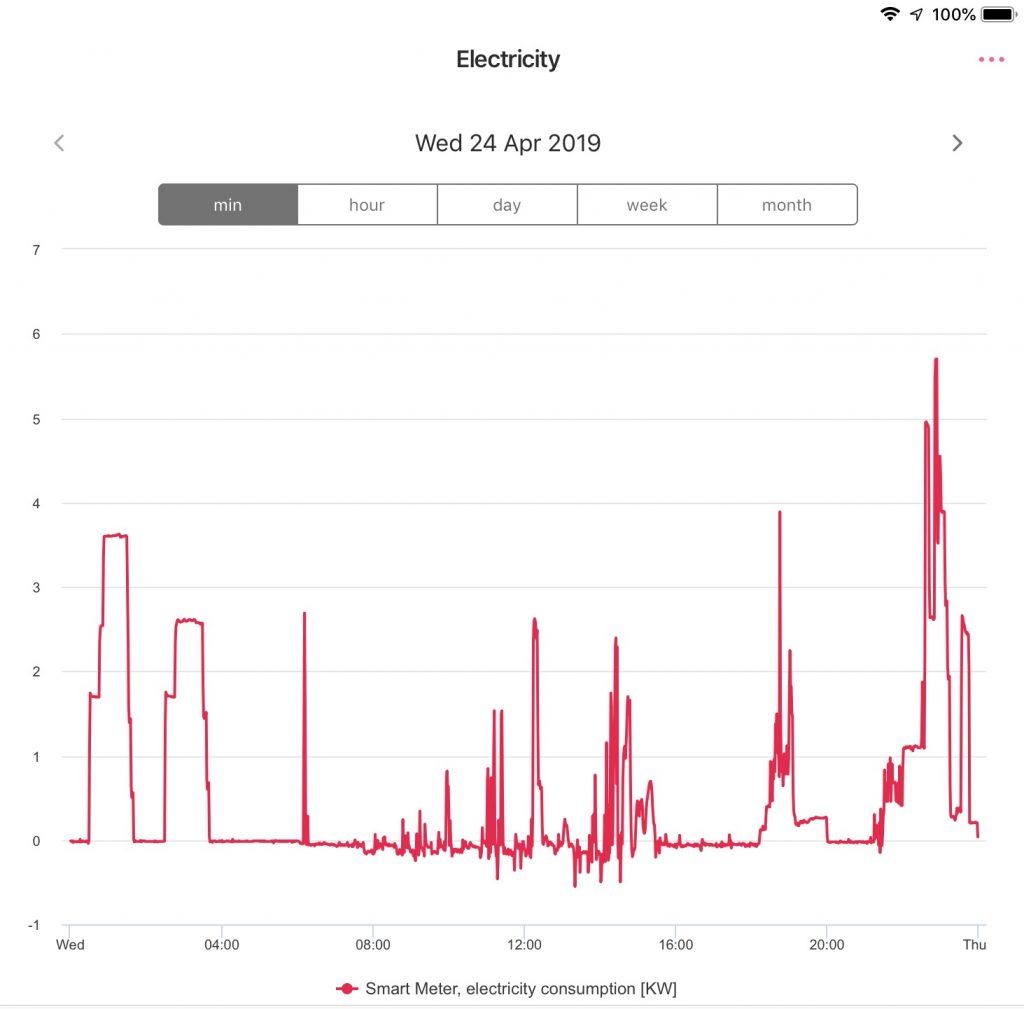
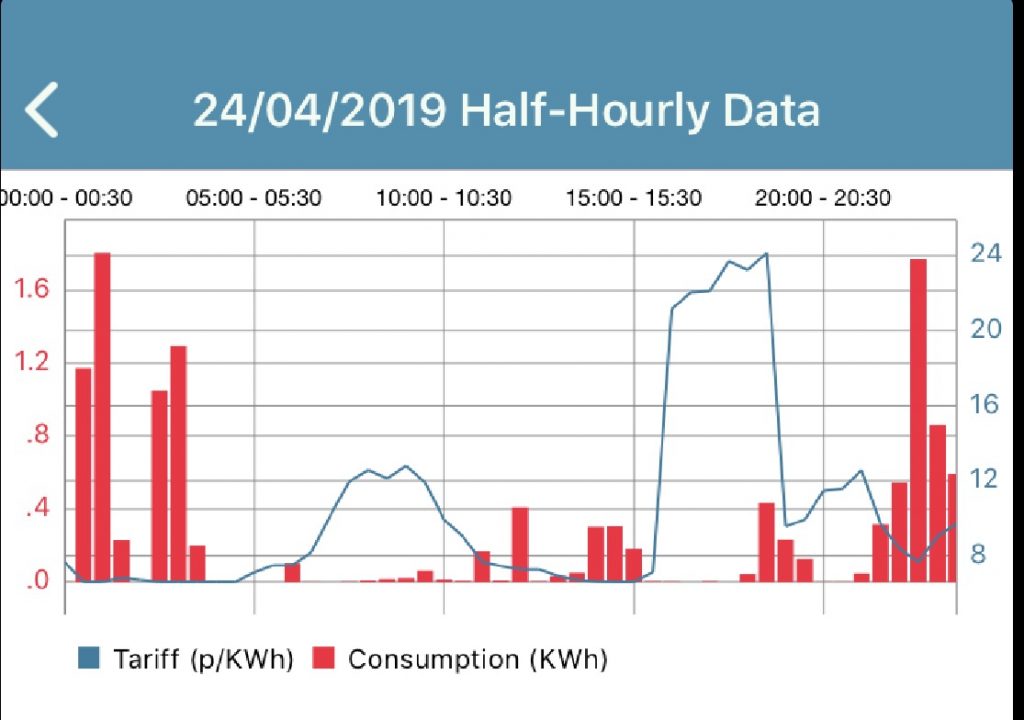
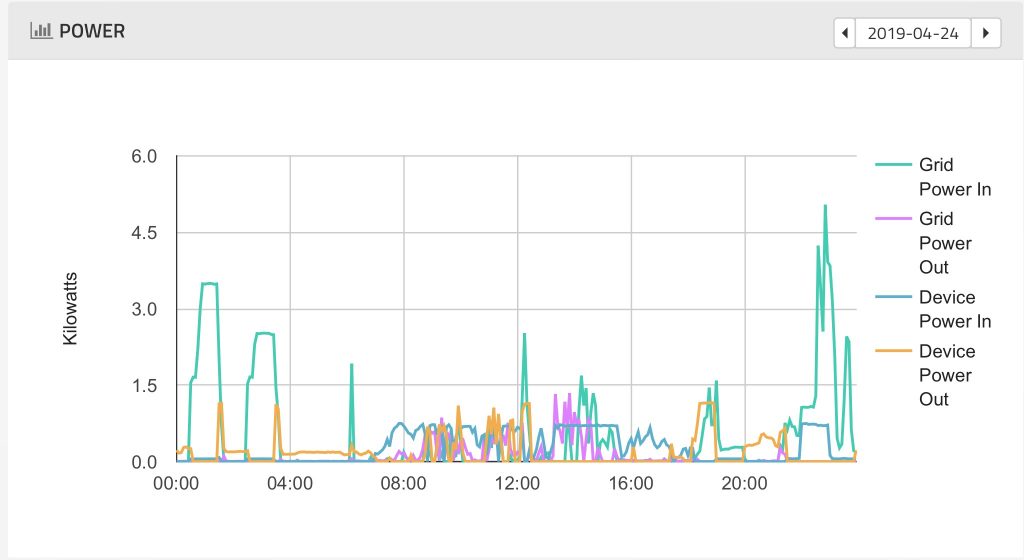
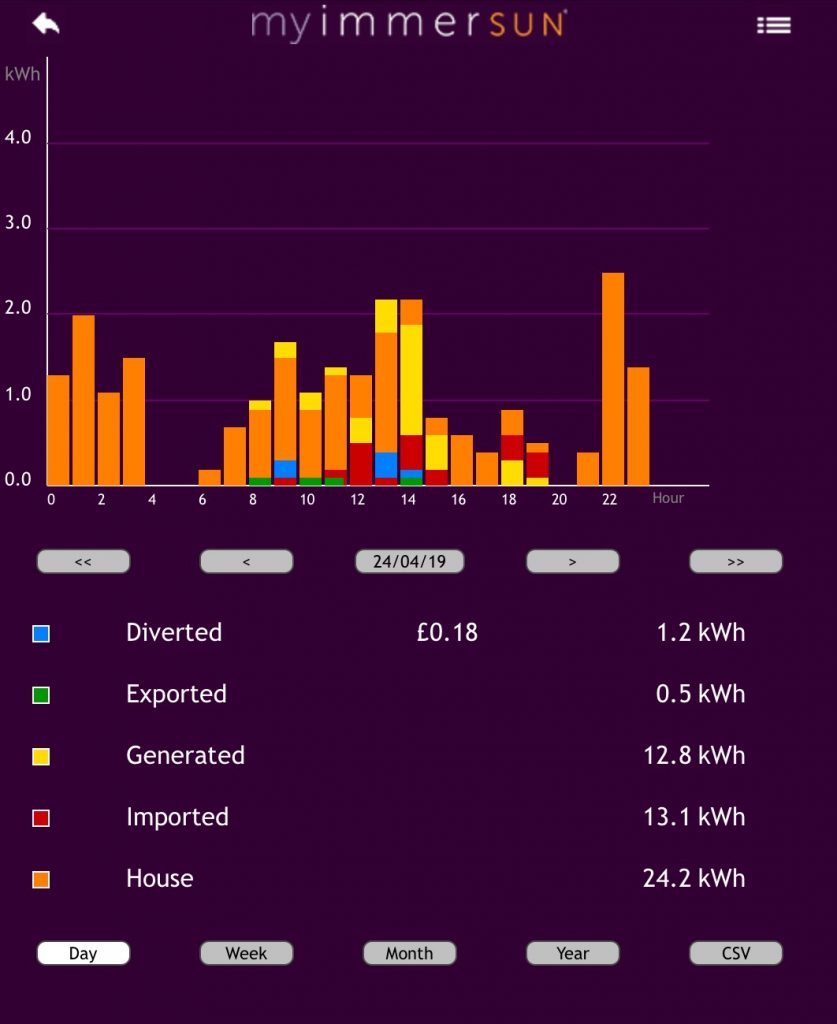
The above images show four different perspectives on the same day of data (April 24th) from different sources within the home.
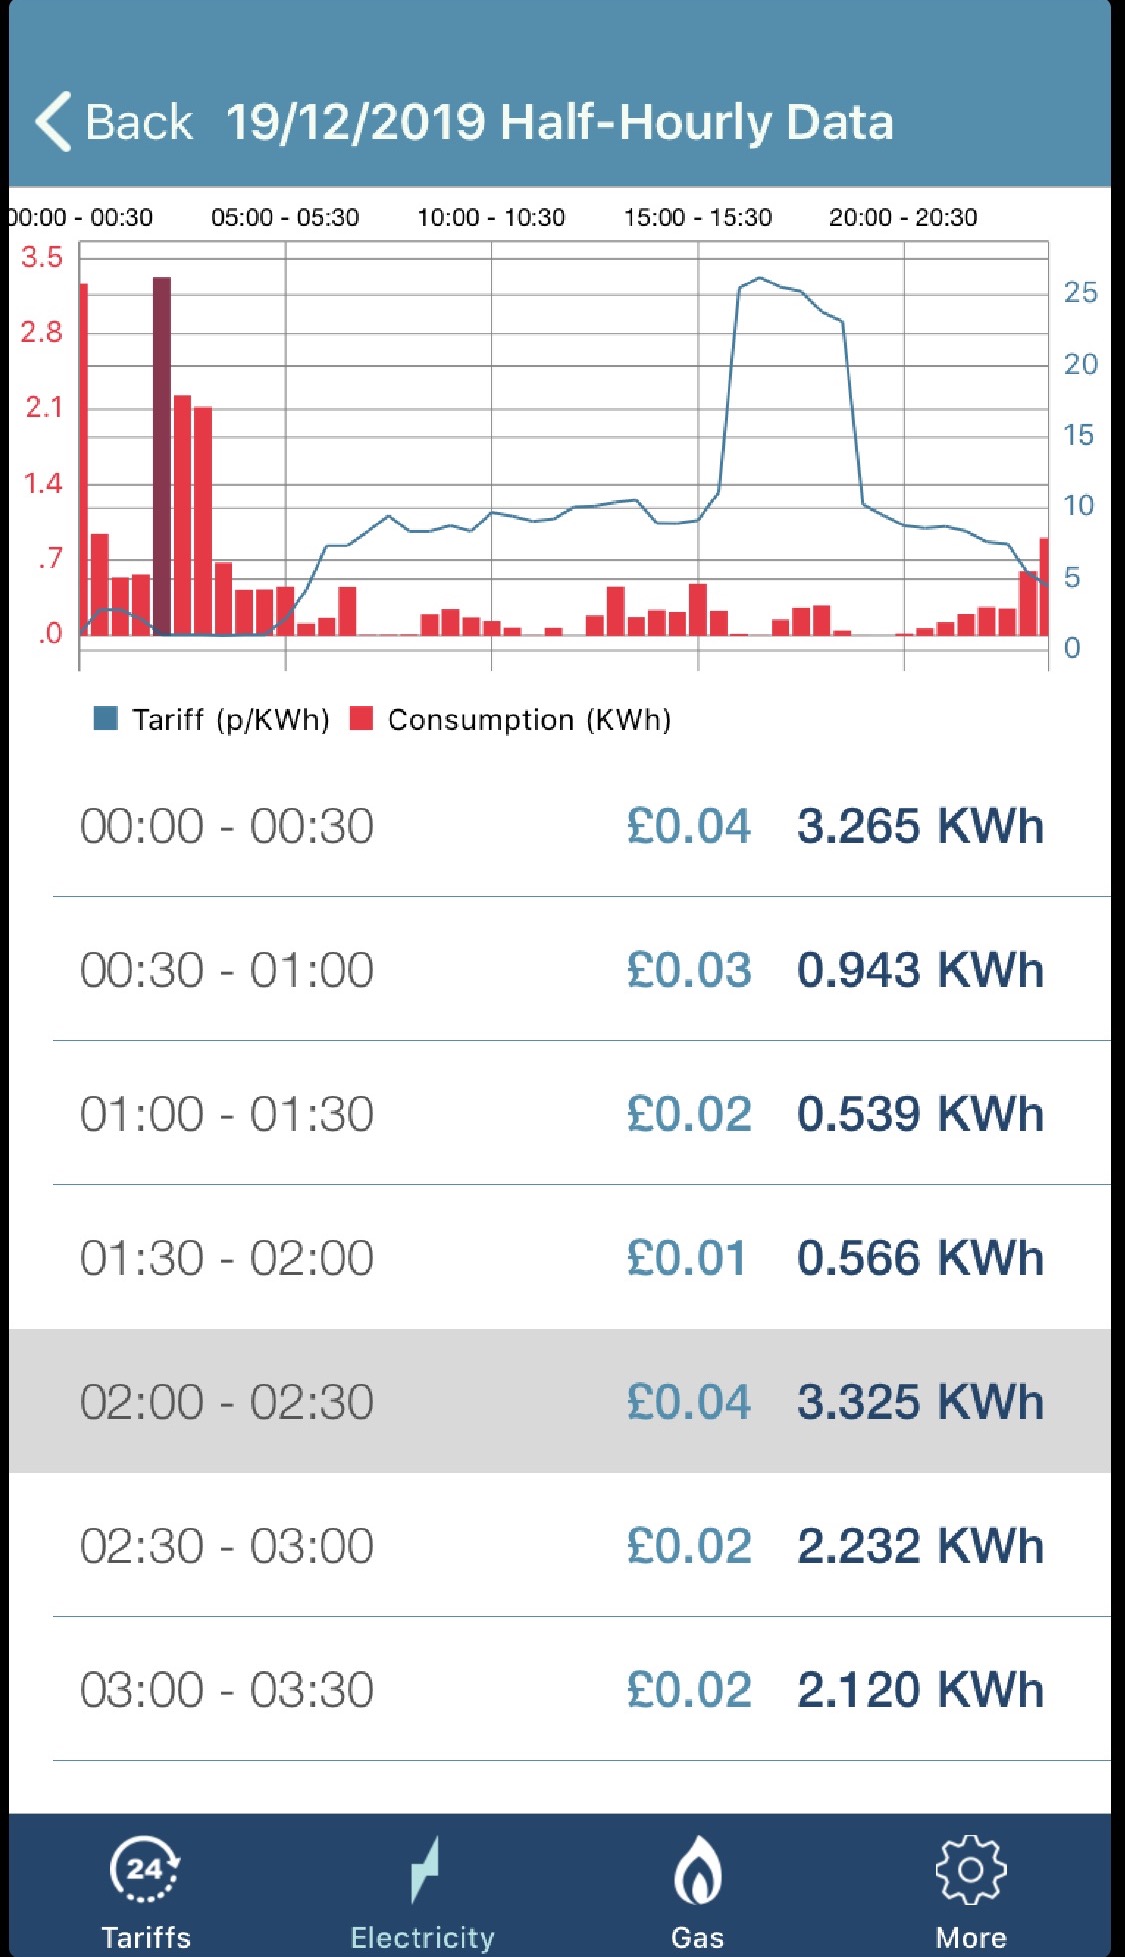
Smart Meter HAN
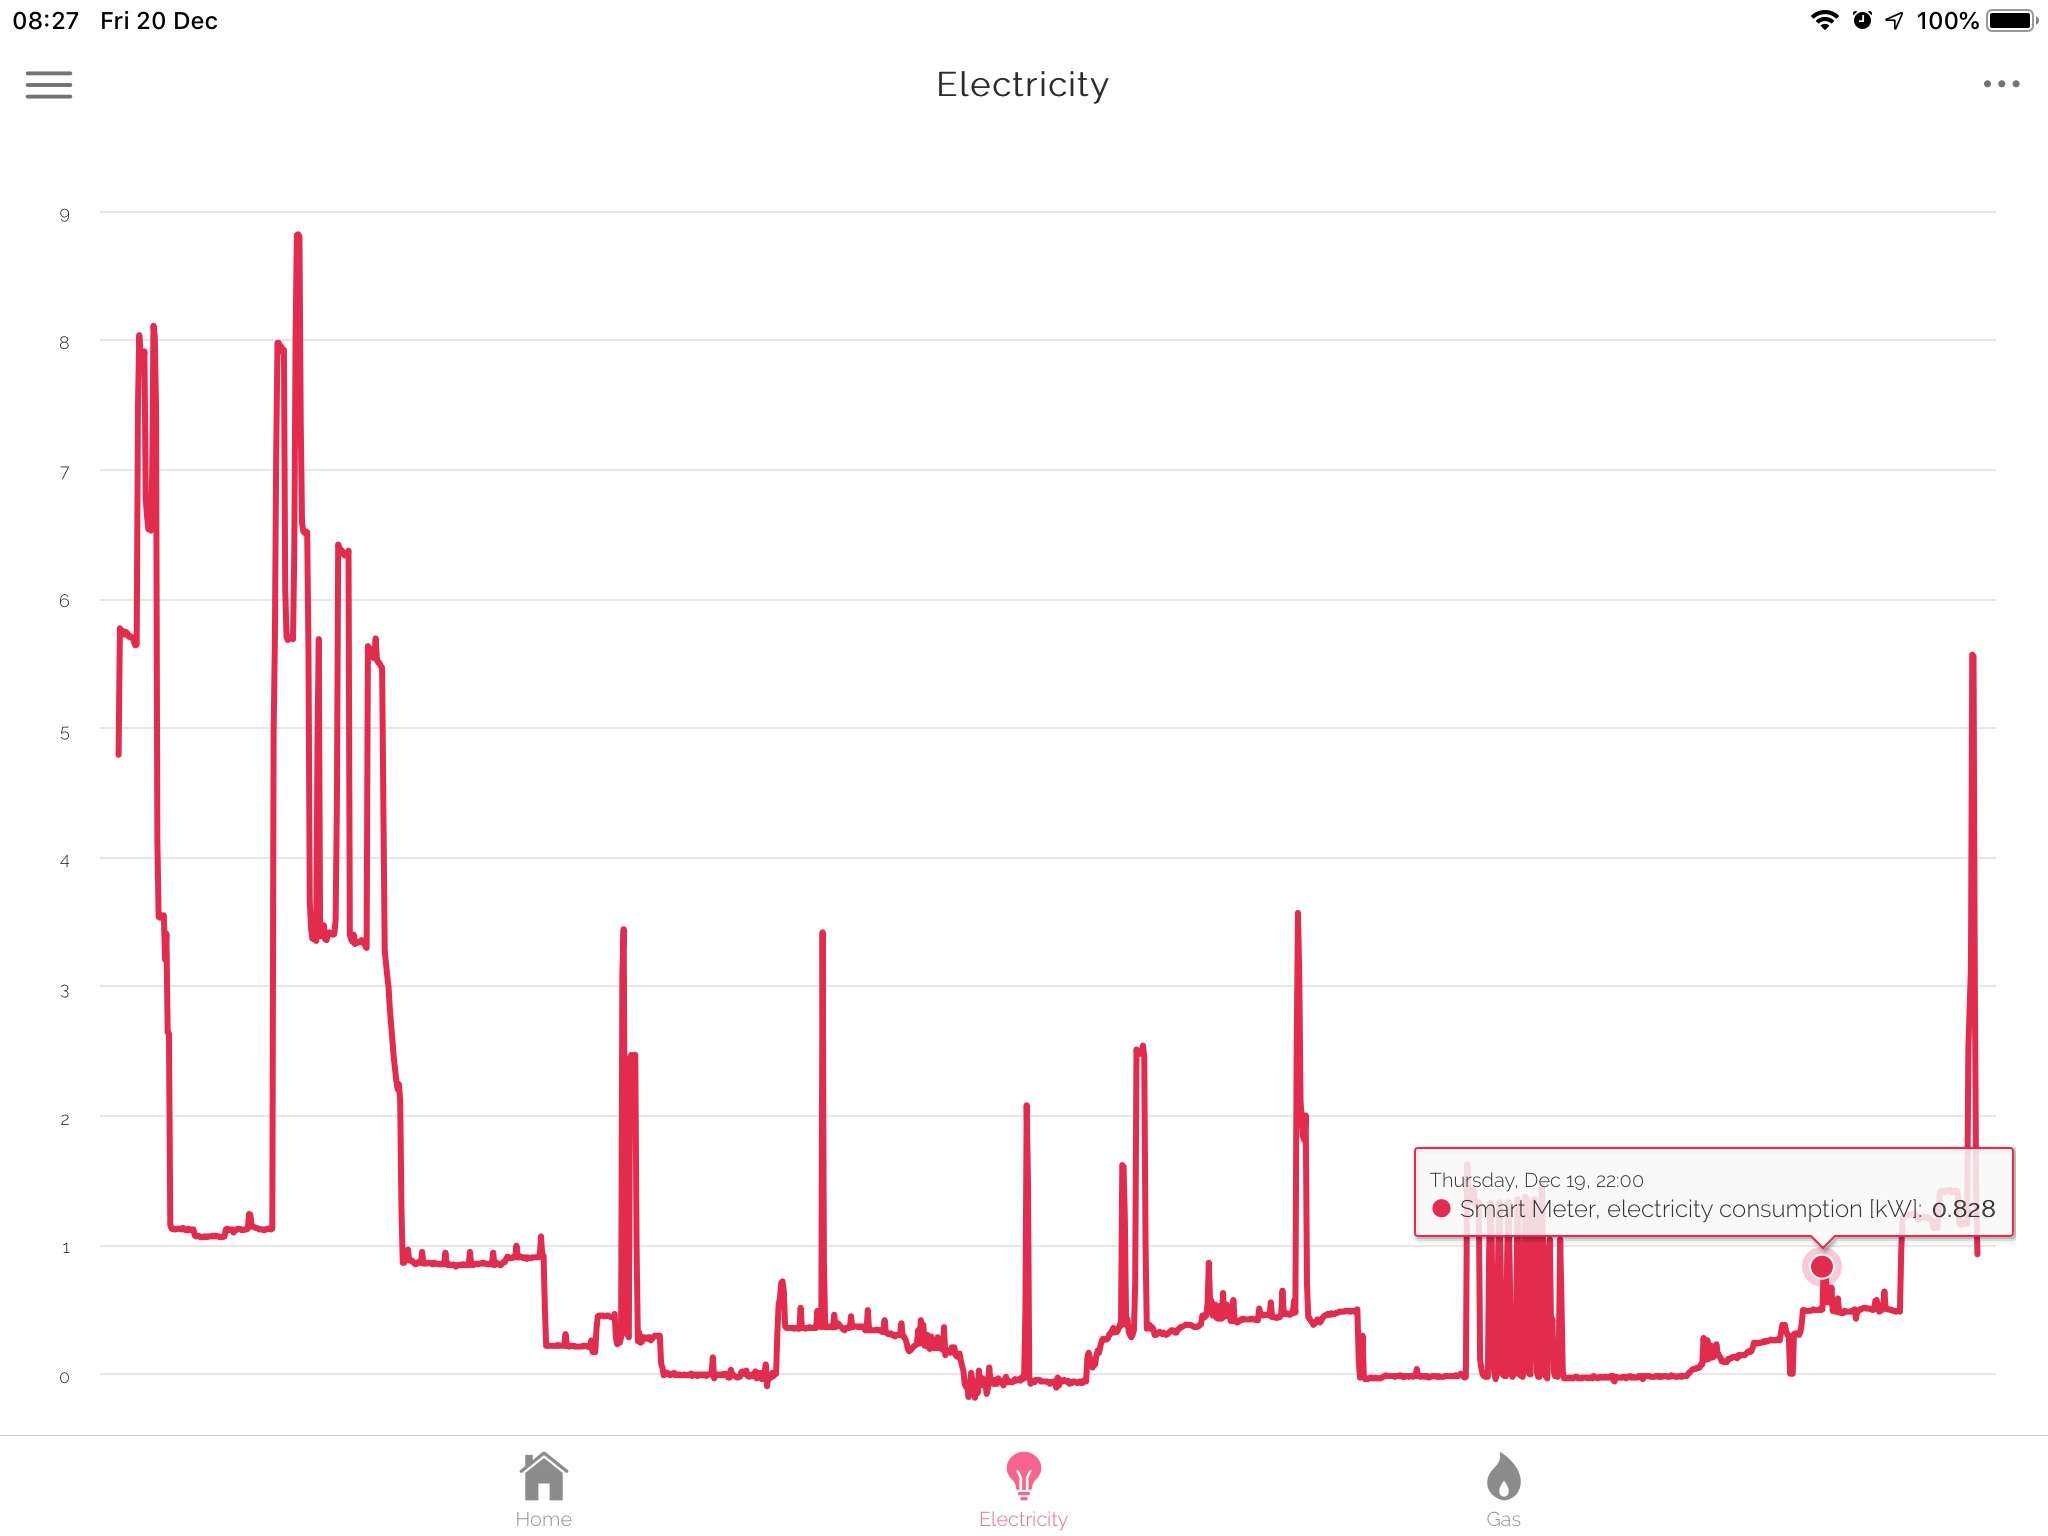
Firstly, the Smart Meter HAN image shows bought electricity to the home. Each smart meter sits on a Home Area Network (HAN) which is how the In-home display provided with the meter gets its data. The in-home display is an example of a Consumer Access Device (CAD). In my case I also have a Hildebrand Glow Stick as a CAD. The Glow Stick, which looks something like an oversized USB stick, also connects as a CAD to the smart meter allowing the meter to be read. An associated app, Hildebrand’s Bright, allows the Glow Stick to be read via the cloud. In principle the Bright app can display either energy in kWh or cost, but in my case can only display energy in kWh as Octopus don’t push the price data into the smart meter so energy cost always reports as zero. The data is presented by the minute.
Smart Meter WAN
Secondly, the Smart Meter WAN image shows the same data but from the perspective of the Wide Area Network (WAN) whch connects the smart meter to the energy retailer (Octopus for me). This half-hourly data is reported via the Octo Watchdog app. The data reported is cost per kWh (the blue line) and energy consumer / kWh (the red columns). The energy data in the red columns follows that of the red line in the prior illustration but in lower resolution (half-hourly versus minute-by-minute). You can clearly see most energy being bought when the price is lowest.
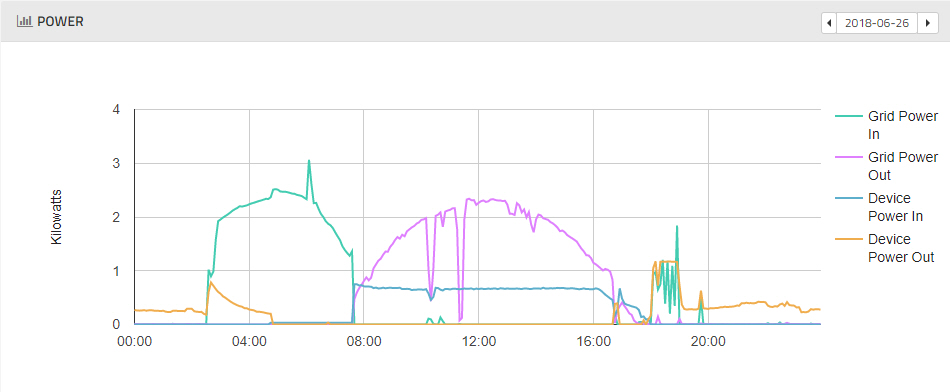
Powervault
Thirdly, the Powervault image shows grid in/out and battery in/out. The green grid-in line mimics the red data from the above images. The battery in/out data is solely visible in this image. The resolution is good enough to see shorter events like kettle boil cycles.
Immersun
The final image, from the Immerun, is probably the most useful although it lacks energy price and hides battery in/out within the House data (hence ‘House’ being zero at times). The immersun alone reports output data from the solar panels and diversion to the immersion heater. It also lumps the car charger energy within ‘House’, indeed none of these views can directly report the car charger behaviour although its the dominant energy consumer here.
I’m planning to construct my own view showing all the different prices of data together in one place. I already have access to:
The Immersun data via the same API called by their app. I came across a blog post that described how to do this.
The Powervault data API (I only have a control API at the moment) which should give me battery in/out (at least I’m on a promise of the API at the moment).
The Hilbebrand data which duplicates the Powervault Import/Export at the moment, but has the potential to provide independent monitoring of my car charger.
In principle then that would leave me able to report 3 x energy sources (grid, panels and battery; of which grid and battery would be bi-directional) and report 3 x energy consumers (car, water heating and home).
A recent discussion centred on whether, as someone in receipt of UK feed-in tariff (FiT) and having a smart meter, I should be on metered export or deemed export. I had previously been advised that my smart meter did not have an export register, but playing with the buttons revealed an active export register.
There could be an opportunity to use the export meter as part of an export tariff instead of the FiT export component, which wouldn’t have a restriction on buying and exporting grid power, but my high levels of self-use make this unattractive compared to deemed export at 50% of generation.