The end of 2017 sees 2 full calendar years of output completed (plus a few months at the end of the prior year) so it seemed like a good time to assess performance and return. Return comprises two parts – firstly the payments received for electricity generation (and export) the so-called feed-in tariff or FiT and secondly the savings obtained from using that free energy myself instead of buying it from the grid. In my case I can use and store my solar electricity directly, or use it to heat water via the immersion heater thus replacing gas.
I’ve summarised the status in the following table:
| Nominal | 2016 | 2017 | ||
|---|---|---|---|---|
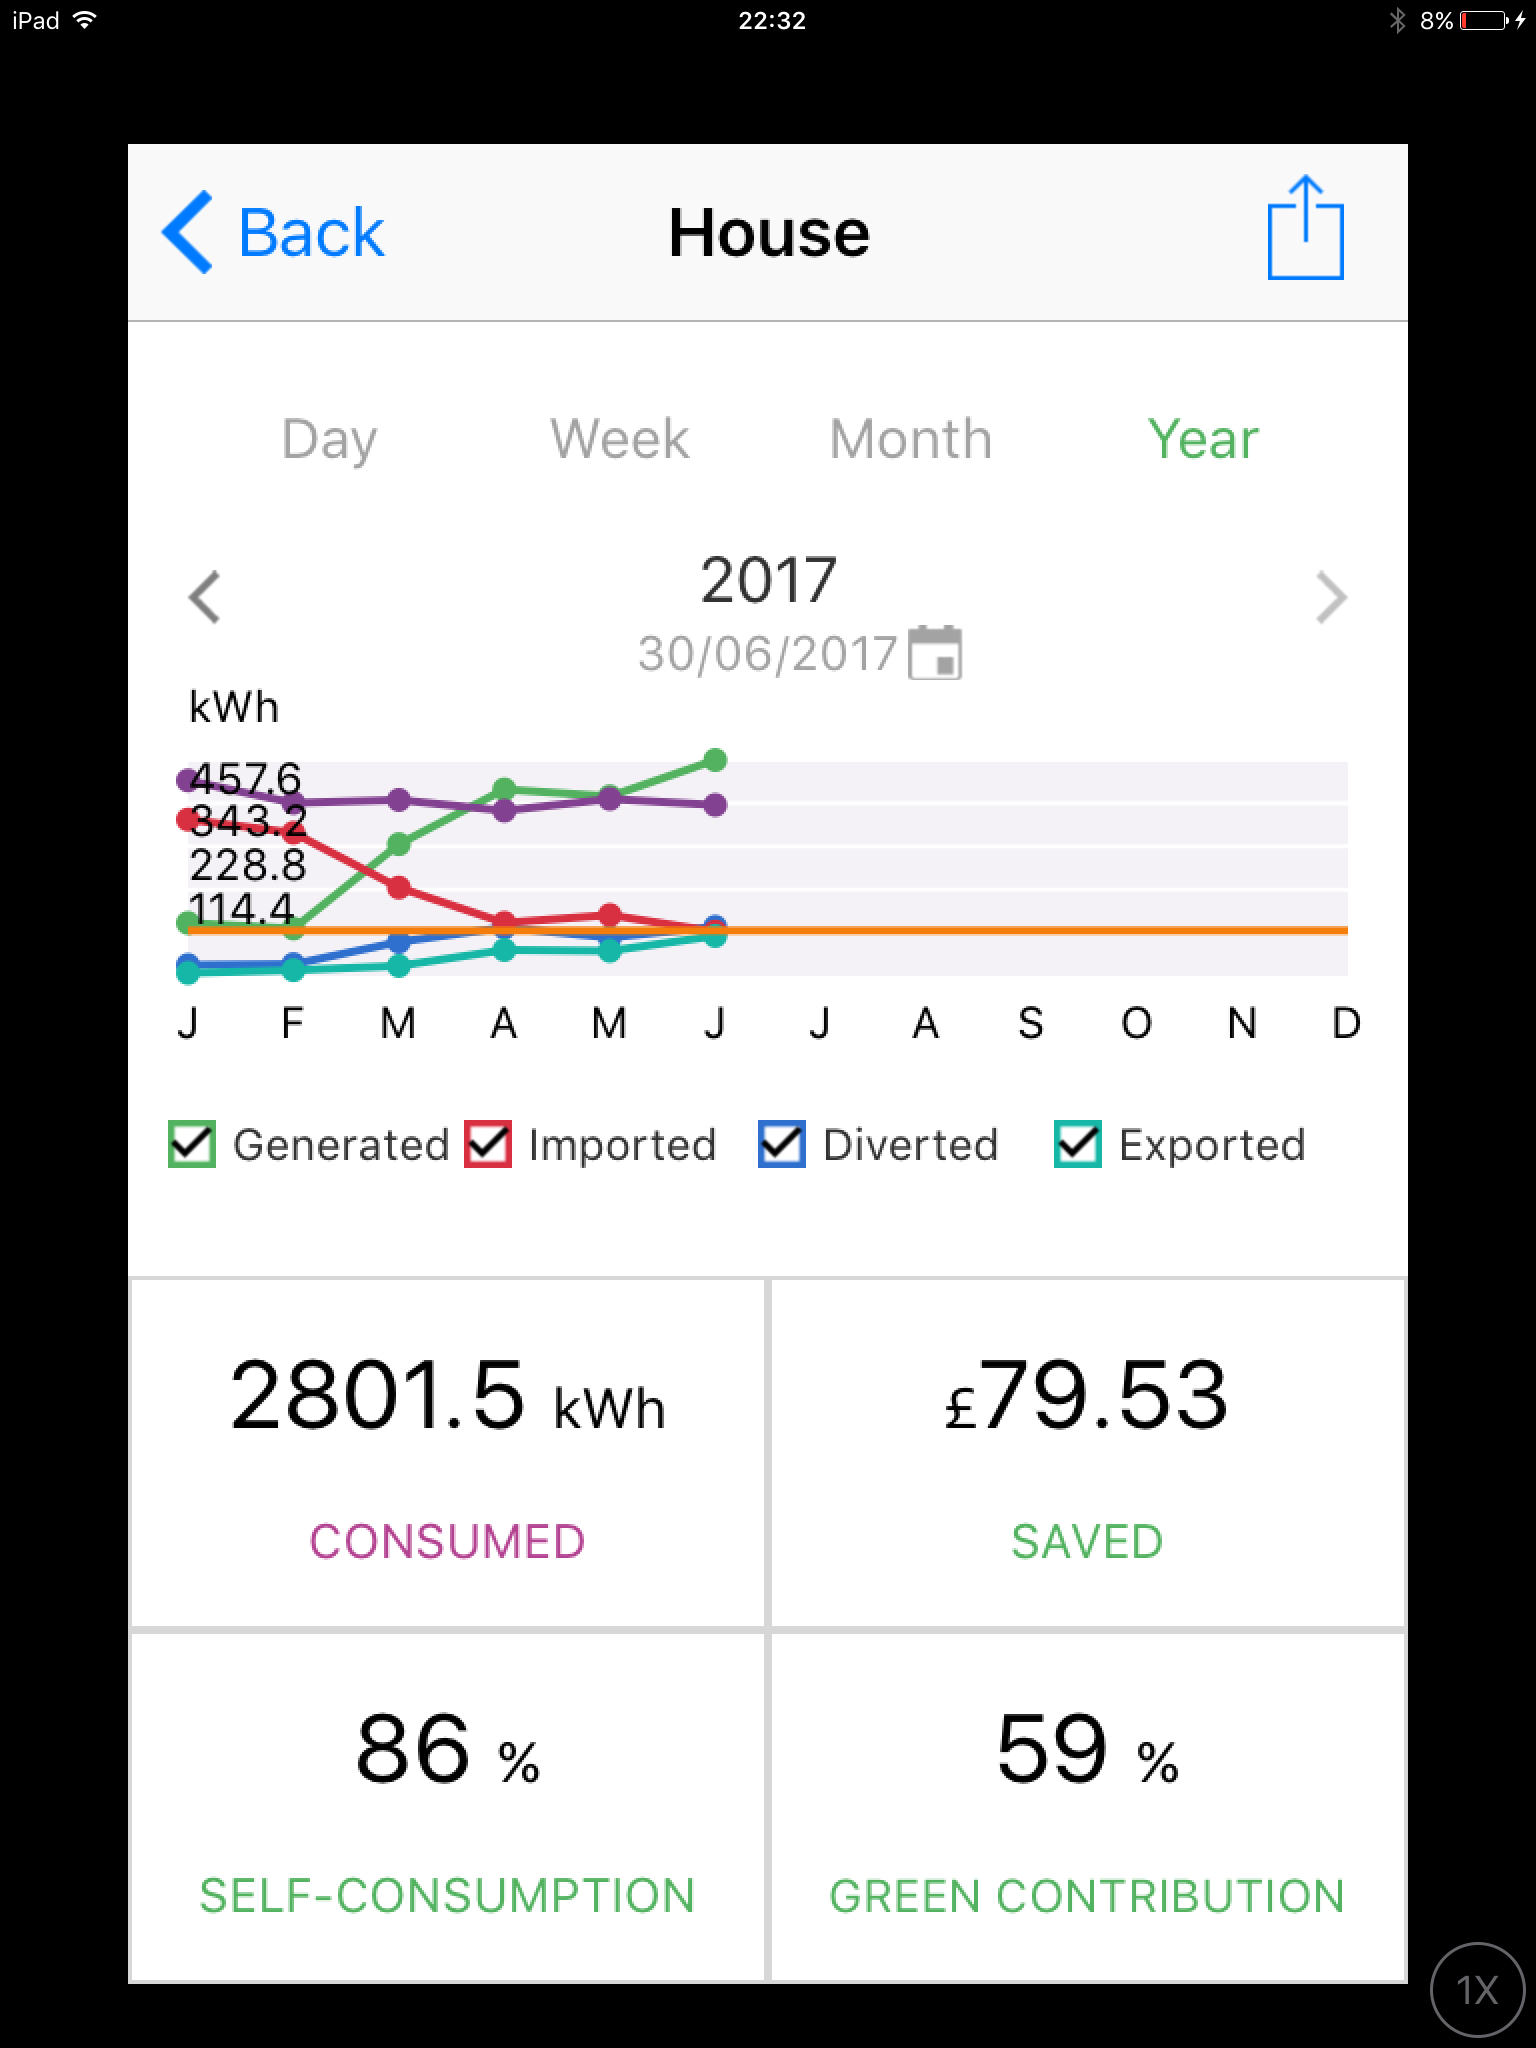
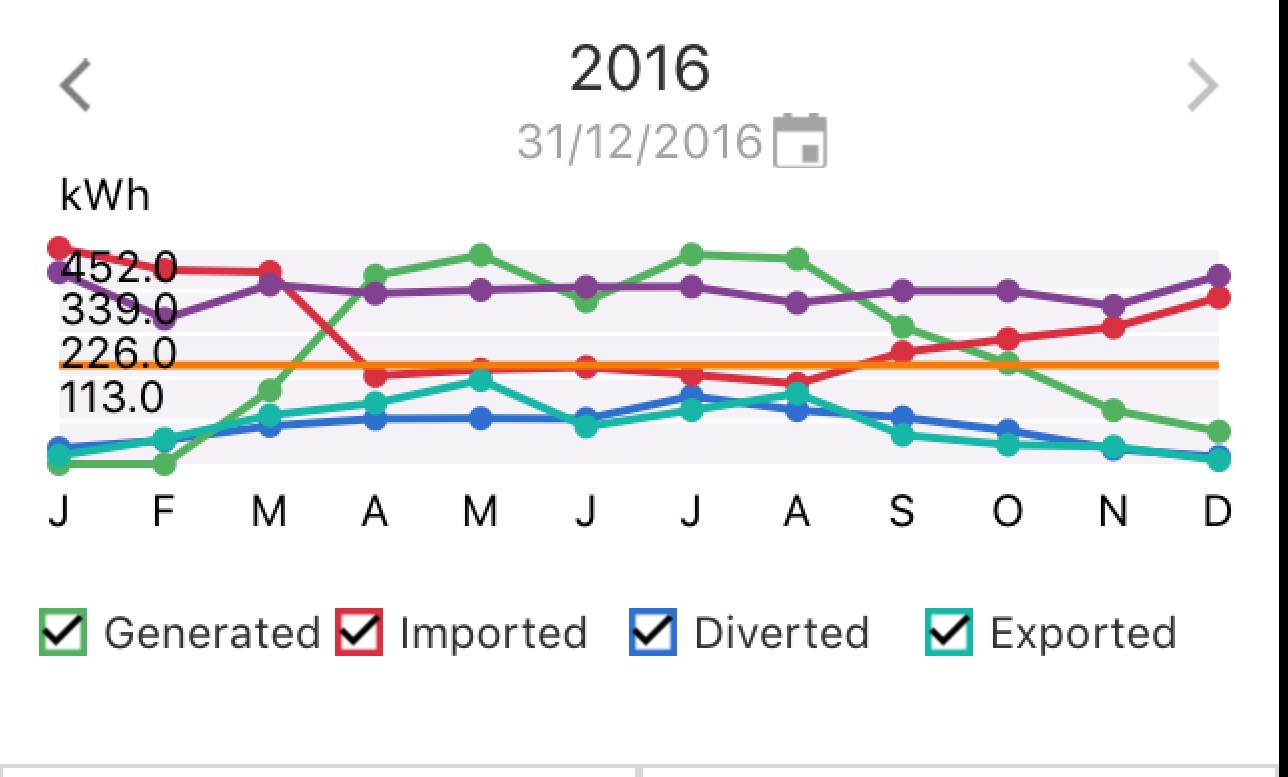
| Generated | 3668 | 4056 | 4033 | kWh |
| FIT | £629.36 | £639.61 | ||
| Electricity self-use | 50% | 41% | 64% | of Generated |
| 1834 | 1663 | 2596 | kWh | |
| £159.65 | £251.12 | |||
| Gas replacement | 27% | 23% | of Generated | |
| 1095 | 941 | kWh | ||
| £41.20 | £27.66 | |||
| Export | 50% | 32% | 12% | of Generated |
| Return in calendar year | £830.46 | £918.40 | ||
| 13.6% | 15.1% | of PV cost | ||
| Return cumulative | £830.46 | £1748.86 | ||
| 13.6% | 28.7% | of PV cost |
Summary:
- Output from the panels was slightly reduced in 2017 versus 2016, but still significantly above the performance projected in the quotation. I put the slight reduction down to year-to-year differences in the weather. Over time I would expect panel output to decline, but I think it’s too soon to attribute any decline to this.
- Income from FIT was slightly higher as inflation on the price / kWh has overcome the slight output reduction.
- Electricity self-use is up considerably from 41% to 64% due to my 4 kWh storage battery. The costs of that battery are not reflected in the table. Return would have been 8.8% in 2017 (rather than 15.1%) if the cost of the battery was included.
- Gas replacement is down from 27 to 23% versus 2016 as more of the electricity from the panels is used for high value activities like charging the storage battery or my electric car, and less is left over for water heating. The low price of gas per kWh makes gas replacement my lowest priority for self-use.
- Exported electricity (i.e. what’s left-over that I cannot use myself) is considerably reduced from 32 to 12% largely as a result of increased electricity self-use.
- Financial return in calendar year 2017 is improved from 13.6 to 15.1% neglecting the costs of the battery, or reduced from 15.1 to 8.8% taking into account capital costs of the battery.
- It will take approximately 7 years (i.e. 2 past + 5 future years) for the combination of the solar panels and battery storage to pay for the solar panels (neglecting the battery costs), and a further 2 years of system savings to pay for the storage battery.