Multiple commentators have discussed the importance of knowing the Agile price at all times in order to optimise electricity costs and have developed a series of tools to enable that including phone apps, monitor screens, web pages etc.
Agile price visualisation via web page
However I think that the solution that I’m about to outline is easily the most sophisticated solution that I’ve seen.
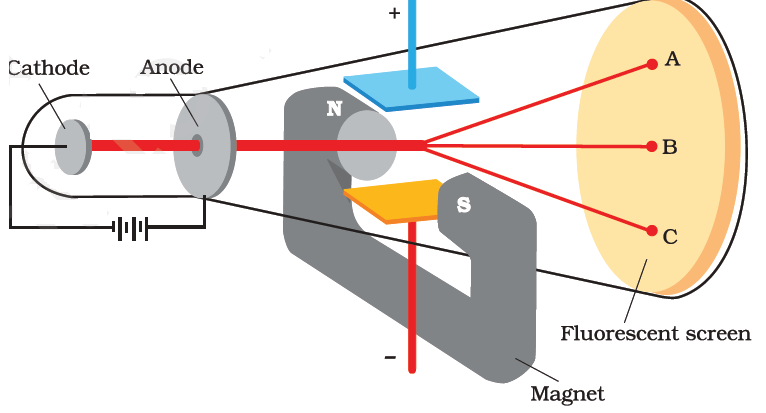
The proposal takes automotive and aeronautical head-up-display capability and traditional cathode ray tube technology and integrates that combination in a whole new way.
Eyeball with integrated cathode ray projector.
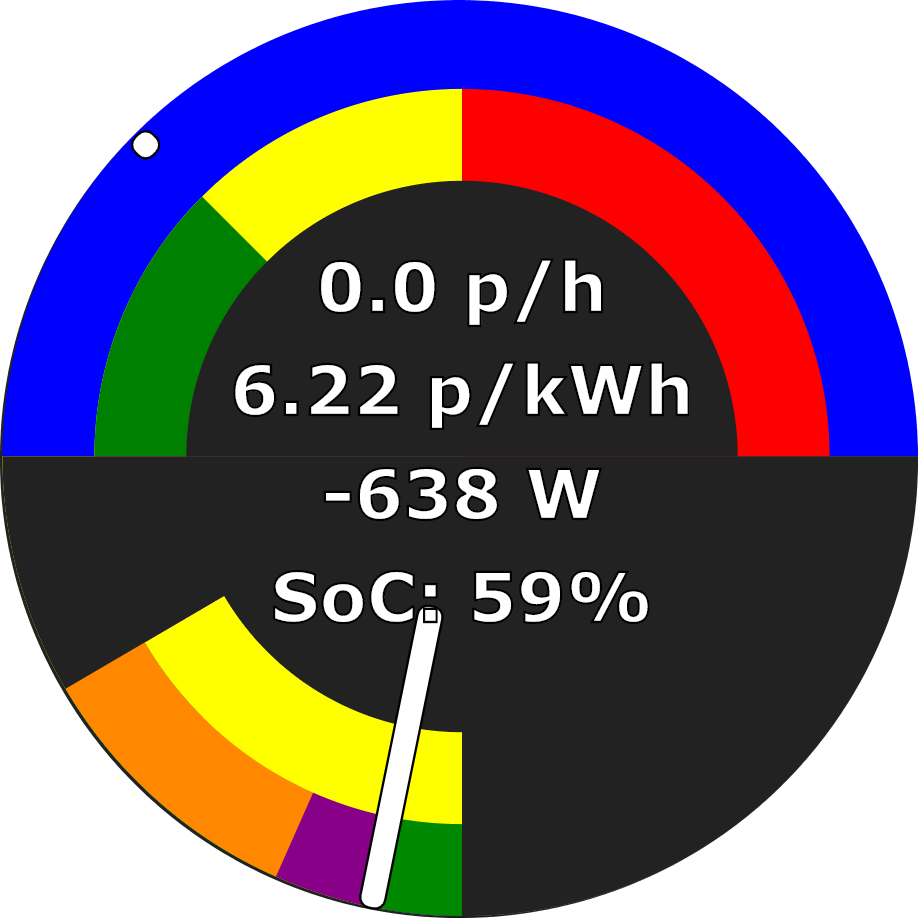
The integrated projector shines the required price data onto the back of the cornea to give the recipient of the implant a continuous view of Agile pricing in a similar way to a head-up display. The copper band is used to modulate an electromagnetic field to deflect a cathode ray across the surface of the cornea to superimpose the future electricity prices on the user’s field of view.
Deflection of cathode ray by electromagnetic field to create image on back of cornea
The recipient of the implant receives a continuous graphical display of Agile pricing even when the eye is closed In a similar way to a head-up display. This round-the-clock price awareness is ideal to ensure optimal electricity costs.
Sophisticated graphics provide a continuous visualisation
Efforts to commercialise this technology are currently underway with launch anticipated on the thirteenth Thursday of 2021 as Oculus Agile.
As winter turned to spring my thoughts for my HEMS turned to thinking about how to adjust the operation of the HEMS in managing battery charging to account for anticipated solar production. Previously the HEMS was configured to buy a preset number of hours of charge from the grid each day, typically overnight when the power tends to be cheapest. Through 2019 as the seasons changed I periodically adjusted this figure to create headroom to store charge from the solar panels later in the day. However I would like to make this adjustment automatically day by day.
Late last year I came across solcast a website that predicts the output of solar panels. The user creates an account, describes their PV array (location, capacity and orientation), and can then download predictions via API.
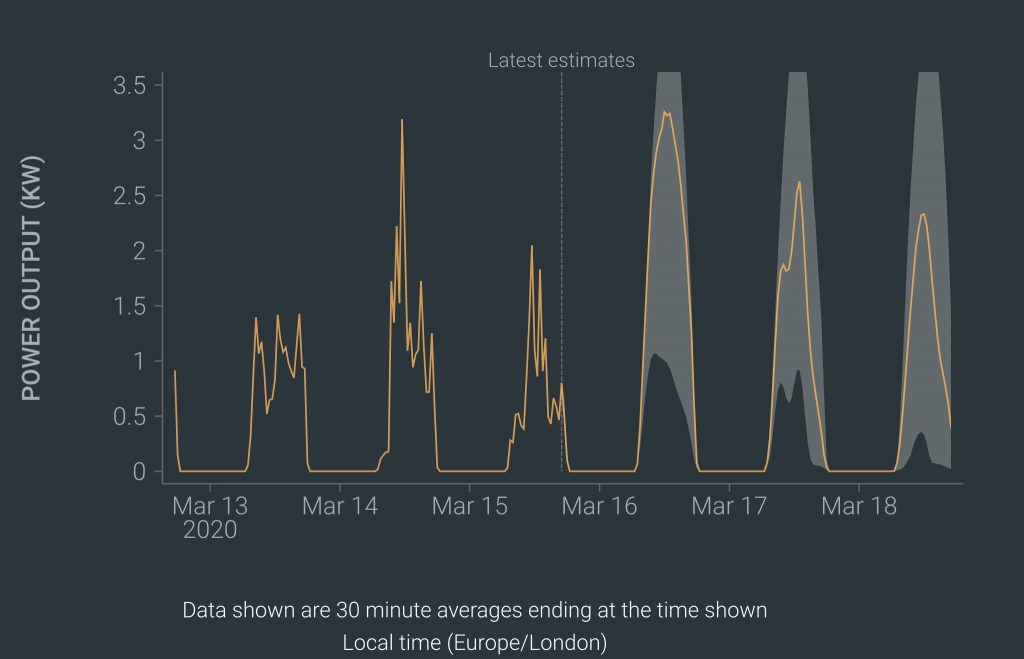
Solar prediction for the next three days
The orange line shows the predicted output for the next few days, with the light grey area showing the confidence interval from 10 to 90%. As a prediction there’s a degree of uncertainty associated with the prediction as there is with a weather forecast. The 10% line shows that 1 day in 10 the output will be lower than the grey area, while the 90% line shows that 1 day in 10 then output will be higher than the grey area.
My original prediction were based on the orange line (the 50th percentile) where output was equally likely to be above or below this amount. However my risk on an incorrect prediction is not even. If I fail to buy enough power from the grid when the price is low then I risk paying up to 35p/kWh to buy when the price is high, whereas if I buy an unnecessary cheap kWh from the grid I may spend an unnecessary 5p/kWh on average. Thus I decided to take a more conservative position on risk to obtain the lowest cost position. I opted for a 20% risk, so 1 day in 5 I might underestimate my purchase from the grid reflecting the ratio of grid prices high:low. I estimated this 20th percentile assuming a normal distribution on the low side where the 20th percentile = 0.34 * 50th percentile + 0.66 * 10th percentile.
The process is as follows:
download the data in a half-hourly format to be comparable to the half-hourly Agile electricity price data,
calculate the 20th percentile from the 10th and 50th percentiles,
count the number of half-hours in the 20th percentile data above a threshold that provides for charging the battery at full power,
establish the earliest half hour when solar would charge the battery at full power,
adjust the period for buying power from the grid by the period anticipated for solar charging (tomorrow a total of 7 hours is to be achieved by 6.5 hours from solar leaving 0.5 hours from the grid),
adjust the end time for buying power from the grid to align with the earliest hour when the battery can charge at full power from solar.
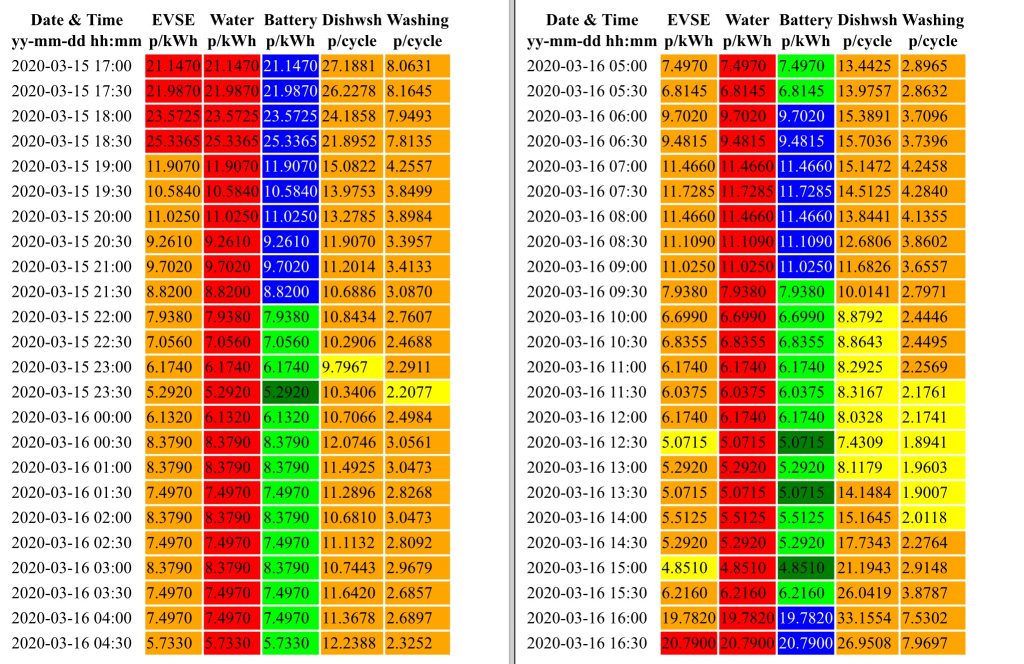
HEMS schedule with battery behaviour modified for predicted solar generation
The result of these calculations can be seen above. One half-hour of lowest price battery charging has been identified overnight to meet the requirement for charging from the grid. Normal HEMS behaviour has also identified several other periods of grid charging at lower cost during the day, but these are not counted towards the target for buying from the grid due to the potential for a double count of solar and grid charging during the day. (In a similar manner there are multiple start times during the afternoon when the dishwasher or washing machine can be run on grid power more cheaply than the optimal overnight start time.)
No explicit command from the HEMS is required to enable proportional charging of the battery from the solar panels when there is a solar surplus as 2 of the 3 used battery operating modes (normal and charge-only) have this capability, and the third mode force charges the battery. If the battery is force charged during solar surplus then the source of the energy will of course be the solar panels, but any shortfall will be met from the grid.
mode
charge behaviour
discharge behaviour
comment
Normal
Proportional to solar surplus
Proportional to shortfall
Used at high grid prices (today discharging enabled at > 8 p/kWh)
Charge only
Proportional to solar surplus
No discharge
Used at mid grid price to save stored energy for period of higher grid price (between 5 and 8 p/kWh today)
Force charge
Full power
No discharge
Used at lower grid price to buy from grid (today buying at < 5p/kWh). If low price occurs at time with reasonable solar generation then use of solar output will happen automatically, with only any shortfall coming from the grid.
Solar PV installations like mine that are a few years old generally qualify for the UK’s Feed-in Tariff (FiT) which pays both for generation and notionally for export, while newer installations are covered by the Smart Export Guarantee (SEG). The older FiT scheme was universal in the sense that all larger electricity companies had to participate and they all paid the same rates, while with the newer scheme there’s still an obligation for larger companies to participate but the rates are all different. Older installations like mine can optionally swap the export component of the FiT for the SEG, but is that an attractive option?
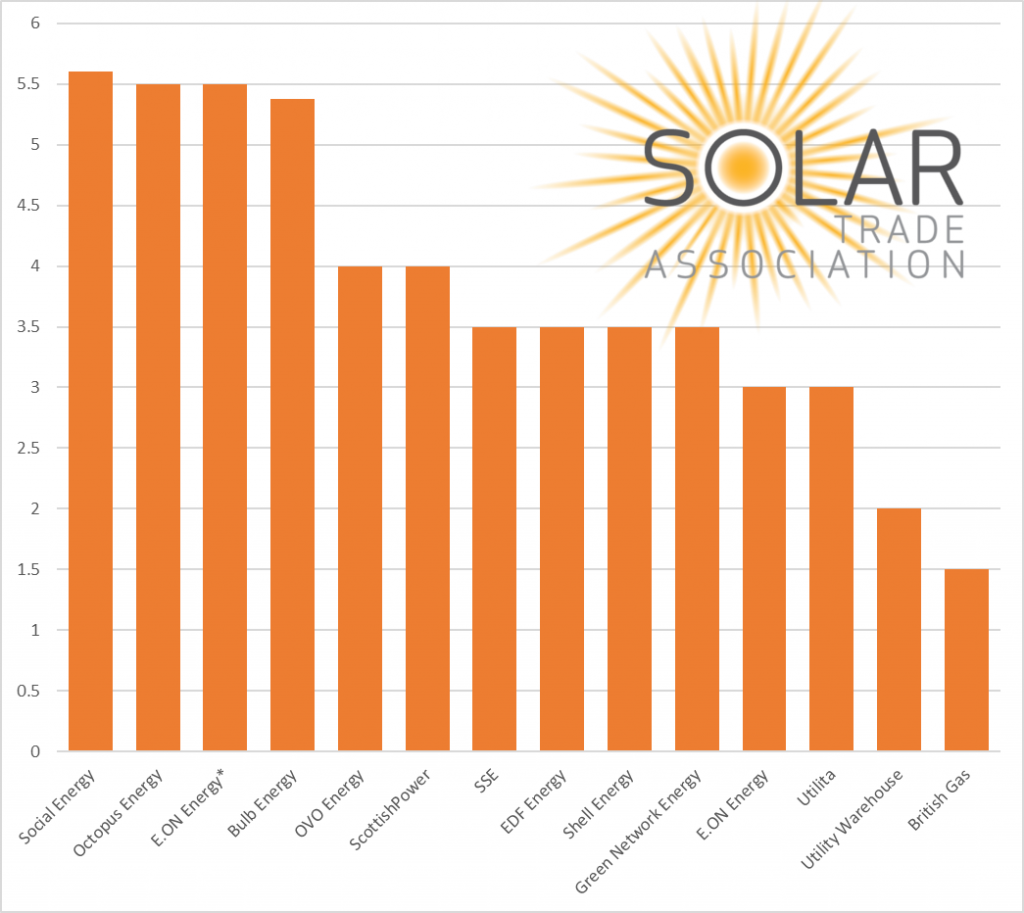
SEG Payments by provider
SEG payments differ widely between providers so it’s worth shopping around.
My FiT export payment is currently 5.38 p/kWh on a deemed export basis, which means that, rather than measure actual export, it is assumed that half of my generation is exported. My electricity supplier Octopus offerers one of the best SEG rates at 5.5 p/kWh but that’s on the actual export, not the deemed export.
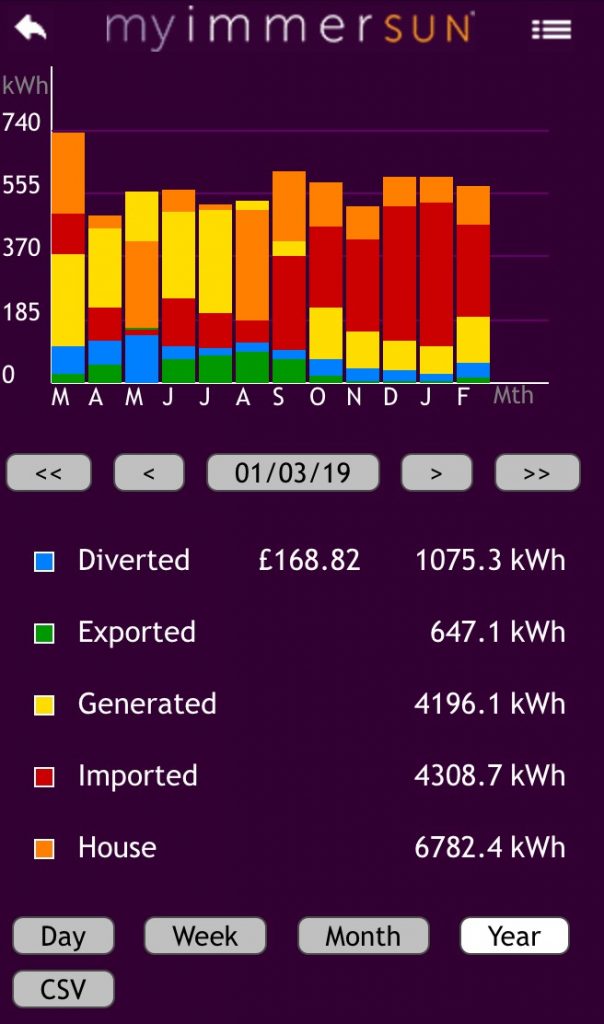
Monitoring data March 2019 – February 2020
Alternative
Description
Energy exported
Rate paid
Total
Comment
Baseline FiT
2,098 kWh (50% of 4,196.1 kWh)
5.38 p/kWh
£112.87
Scenario #1
Switch to SEG without other changes
647.1 kWh
5.50 p/kWh
£35.59
68% reduction
Scenario #2
Add disable water heating from solar to above.
1,722.4 kWh (1,075.3 + 647.1 kWh)
5.50 p/kWh
£94.75
Provide equivalent water heating from gas
1,075.3 kWh
3.2 p/kWh / 90%
(£38.23)
Total
£56.52
50% reduction
Octopus Energy does also offer the alternative of a variable export rate based on wholesale prices, akin to their Octopus Agile import tariff, but for export. However it’s my belief that I would need a much larger battery than I have now (4 kWh) in order to benefit from this as it will always be generally better value to use that stored energy to avoid the early evening peak price period (up to 35 p/kWh) than to sell it back to the grid at a lower price and then need to buy more energy myself. If I had a bigger battery (both in terms of energy and power) then I could both meet my own needs and sell back to the grid.
Overall however I think that it’s clear that, with my current relatively small battery and deemed export tariff, I’m better off on the older FiT scheme than the newer SEG scheme even with one of the better-paying SEG providers.
I’ve been seeing a few online advertisements recently touting 70% savings on electricity through a combination of solar panels and battery storage. I’ve also been looking for a way to express my savings through my smart tariff so this seemed like a opportunity to try that.
My start point is a years data from my monitoring system..
Monitoring data for March 2019 to February 2020
I also went through a year of electricity bills (with slightly different start and end dates) concluding that my average purchased electricity cost was 7.08 p/kWh. Thus my average electricity costs (including solar) are on the right of the table below:
source
quantity
est unit price
Est total
my uniT price
mY total
my saving v. Est
Bought
4,309 kWh
15.75 p/kWh
£678.67
7.08 p/kWh
£305.08
£373.59
Generated
2,473 kWh
15.75 pkWh
£389.50
0.00 p/kWh
£0.00
£389.50
Total / Average
6,783 kWh
15.75 p/kWh
£1,068.32
4.5 p/kWh
£305.23
£763.09
Comparison between my electricity cost and the UK average
If I look at the Energy Saving Trust’s assumptions as a baseline, they have the average UK cost of electricity as 15.75 p/kWh. If I’m paying an average 4.5 p/kWh for each kWh used with my combination of solar PV, storage battery and smart tariff then I’m paying 28.6% of the cost of someone who used the same amount of electricity bought at the average UK rate or saving 71.4% of electricity cost. To put it another way, I’m paying £305.23 for electricity that would have cost the average UK consumer £1,068.32 (on the left of the table above) – a saving of £763.09.
(The baseline assumption that someone would have used the same amount of electricity as me without my level of technology is a slight over-estimate as I flex water heating between gas and electricity since my bought electricity price is sometimes lower than my bought gas price causing me to substitute electricity for gas. Someone on a conventional electricity tariff and gas would never make that substitution as their gas would always be cheaper than their electricity, hence my electricity consumption is a little higher than someone who would be on a conventional electricity tariff.)
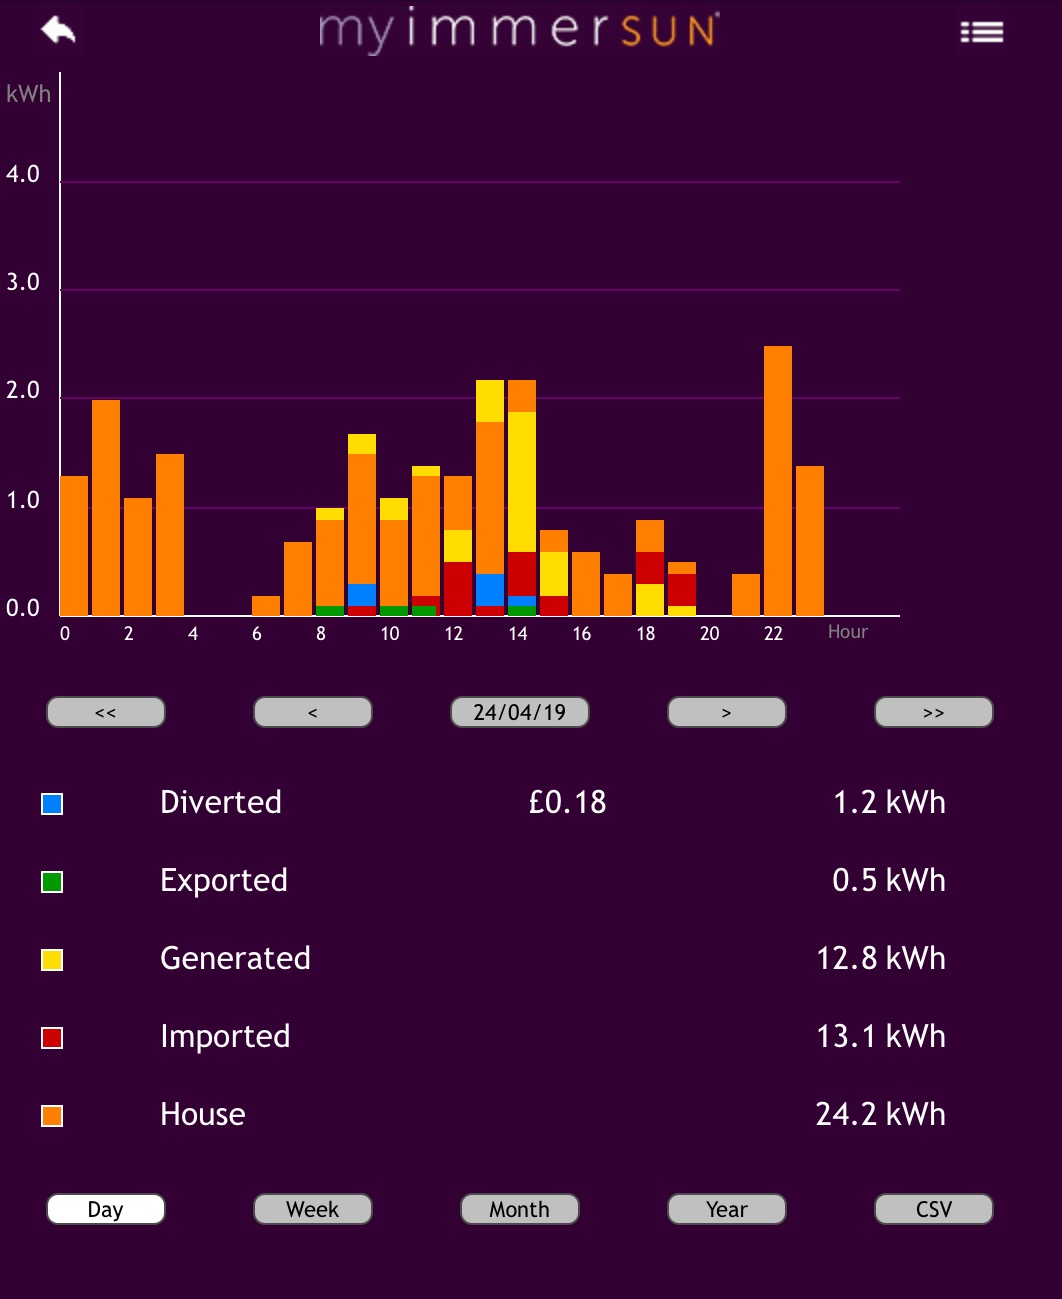
I’m also generating feed-in tariff due to the age of my system (approximately 4.5 years old) which would be £714.59 per annum at current rates, and making 1,075 kWh of hot water from surplus solar electricity which saves £38.22 in gas (the diverted / hot water saving in the screenshot above is based on a notional electricity price, not a gas price). Unless I’ve missed something that’s an annual return of £1,515.90 (£763.09 + £714.59 + £38.22).
In my previous post I estimated my investment at £8,670 so with an combined annual savings and revenue of £1,515.90 that’s a 17.5% return or a payback of 5.7 years. Previously I’d estimated 9 years including the battery, but this was without the benefit of the smart tariff. As we’ve now had the solar PV for 4.5 years that’s very promising, although as my return seems to be accelerating it will take more than 4.5 past years + 1.2 future years (total 5.7 years) to achieve payback.
The current 5.7 years to payback would have achieved payback in spring 2021 as the near bookend, while the prior 9 years would have been autumn 2024 as the far bookend. In practice I could not have achieved the lower bookend of 5.7 years, even had I invested in all the supporting technologies simultaneously, because I’m combining the legacy Feed-in Tariff (FiT) scheme for my solar PV with the Octopus Agile dynamic smart electricity tariff which started in February 2018,
Discussion elsewhere prompted me to look into what I spent on what you might term my energy smart systems relating to electricity consumption, so I thought I’d document it here.
Item
Description
Cost
Comment
1
Solar photovoltaic system (4kW)
£5,500
Bundled with ImmerSUN.
2
Powervault battery storage (4kWh)
£2,000
Free installation as part of UKPN trial.
3
ImmerSUN management system with monitoring.
£600
Estimate based on today’s pricing.
4
Remote-controlled car charger.
£300
Modified used charger from eBay. My own software.
5
Raspberry Pi items to make HEMS
£200
My own software.
6
Wet goods automation (WIFIPLUG x 2)
£70
TOTAL
£8,670
Prior analysis of items #1-#4 in pre-Agile days has suggested a total of 9 years to achieve payback on this investment through use of around 85% of the generated energy. Solar panels are potentially good for over 20 years operation, although I doubt the lead-acid batteries will still be operating for anything like that long.
The combination of item #5 with my Octopus Agile dynamic smart electricity tariff has resulted in my average bought electricity price being 7.75 p/kWh in 2019, about half the UK average. I suppose that I could make the same judgements and program items manually each day, but the HEMS significantly reduces my time commitment to achieve that.
Item #6 is my most recent addition. The sophistication of the algorithm combining the Agile tariff with a simple model of the cycle of each device is such that I would never achieve such a high quality result manually. However the saving is perhaps only a three pence each day so maybe £10 per year on my Agile tariff and thus 7 years to pay for the two smart plugs.
Much of this content is thus around 7 years to payback. The HEMS is potentially much quicker, but relies on having smart systems to control such as battery storage and car charger.
One of the consequences of integrating a smart home is the large number of different apps, web portals and potentially sources of APIs involved. The ones I use include:
Bright
Eve
HEMS
Home
Immersun
OctoWatchdog
Powervault
WIFIPLUG
Title
App
Portal
API
Purpose
Comment
Bright
Y
N
Y
Reads and stores consumption from smart meter.
No price data for my tariff due to smart meter limitations.
Eve
Y /3
N
N
Eve’s alternative to Home for all HomeKit accessories with additional functionality for Eve’s own devices.
I prefer this to Home for editing rules. I use Eve products mostly for central heating control.
Home
Y /3
N
N
Apple’s own app for the HomeKit smart home ecosystem.
Need to refer to device manufacturers own apps (such as Eve or WIFIPLUG) for some configuration and data.
HEMS
N
Y
N
My own web portal to view HEMS schedule and status via Apache web-server on Raspberry Pi.
MyImmersun
Y
Y
Y /1
Control of ImmerSUN power diverter.
Available API provides some measurement and status data as per main screen of the app.
Powervault
N
Y
Y /2
Control of Powervault storage system.
Available APIs provide some user scheduling and status capability.
OctoWatchdog
Y /3
Y
Y
Future cost, and historic costs and consumption (30 prior days) from Octopus (electricity supplier).
APIs provided by Octopus. App developed by an enthusiast using Octopus APIs. Octopus’s own web portal provides historic consumption but does not pair this with cost. Monthly statements show graph of consumption and cost for each day.
WIFIPLUG
Y
N
Y
Control and measurements from own brand smart plugs.
Plugs also appear in Home and Eve apps. I use for dishwasher and washing machine.
Notes to table:
APIs not officially released. Reverse-engineered by an enthusiast and available on line.
APIs not officially released. Used as part of a sponsored trial when I first got the battery and re-used by myself with some manufacturer support.
iOS only. Not available for Android.
Some of these apps have similarities:
Both Bright and OctoWatchdog show whole of house energy consumption (and potentially cost) derived from the smart meter. However they have differences too. A smart meter sits on two networks: (i) the Wide Area Network (WAN) via which the meter communicates with the energy supplier and (ii) the Home Area Network (HAN) which links the devices in the home (electricity meter, gas meter, CADs/IHD and gateway). Bright connects to the HAN via small piece of hardware called a Glow Stick Wi-Fi CAD and collects its own data in real time and stores its own records of energy consumption in the cloud; while OctoWatchdog involves no extra in-home hardware, and takes data a day in arrears from Octopus not storing anything in the cloud itself. Bright’s USP is the real time consumption and current day’s data (neither of which OctoWatchdog supports), while OctoWatchdog’s USP is the availability of electricity price which isn’t available from the meter.
Both Eve and Home interact with all devices in the whole HomeKit ecosystem. Eve is best for creating rules and has more ability to configure Eve’s own devices, while Home is best for sharing access with family members. WIFIPLUG’s app is more limited only interacting with their own devices, and thus cannot see Eve or other HomeKit devices.
Both MyImmersun and WIFIPLUG apps, and the Powervault portal, allow configuration of their own manufacturer devices. They all have, for example, timer capability and data logging. MyImmersun is better for giving a whole-of-home view showing solar panel output and net input to house (so provides a more comprehensive energy monitor), Powervault shows no solar panel output but does give a view of whole-of-home, while WIFIPLUG provides only a view of the energy consumption of devices plugged in to the WIFIPLUGs.
It’s now around a year since I first started with my HEMS. Initially it was managing just the charging of my electric car around the cheapest electricity prices, but subsequently I added water heating, storage battery control and, most recently, dish washer and washing machine.
That original HEMS was built around a used Raspberry Pi that I bought cheaply from a colleague but, while its processing power was perfectly adequate for the task (which isn’t at all demanding), it did have some mechanical issues. Firstly, the mounting holes for accessory cards (known as HATs – HArdware on Top) moved between generations of Raspberry Pi and the holes in my Pi for the standoffs did not align with those in the newer accessory card. Secondly, I never managed to find a case with the space for the HAT and the mains cables that it switches. The former resulted in the electrical connector between the Pi and the HAT taking much of the mechanical load, and an occasional loss of connectivity to the HAT.
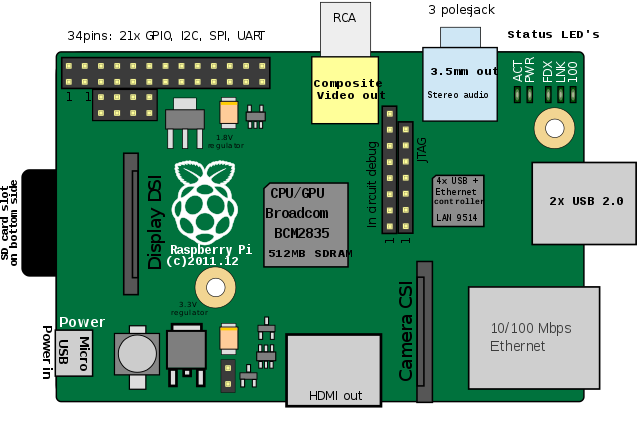
Old Raspberry Pi 1 Model B r 1.2 (mine is actually r 1.1 without the two holes)
New Raspberry Pi 3 Model B (with 4 standard holes for mounting HATs)
These mechanical issues are resolved by the new HEMS which uses a third generation Raspberry Pi allowing use of proper standoffs and a new case with the depth to enclose the HAT too.
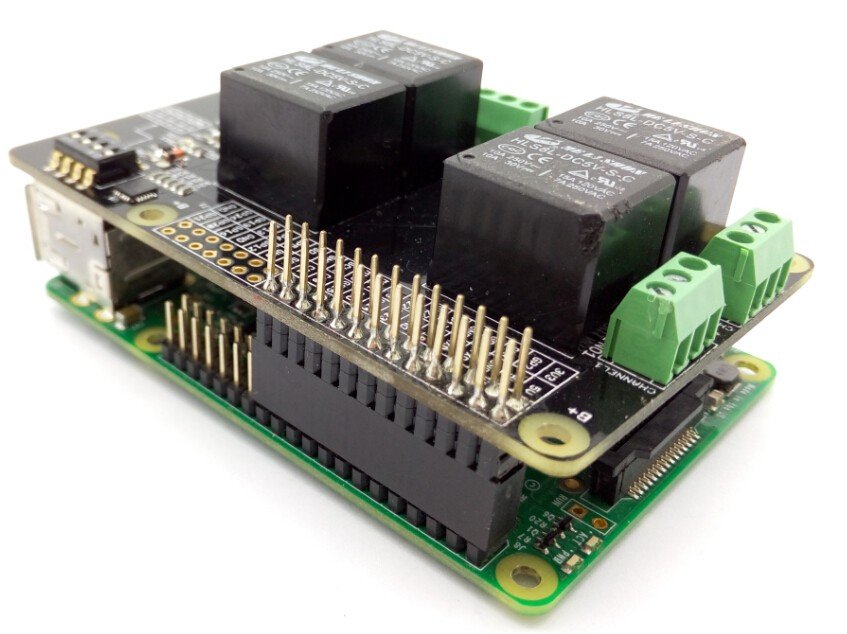
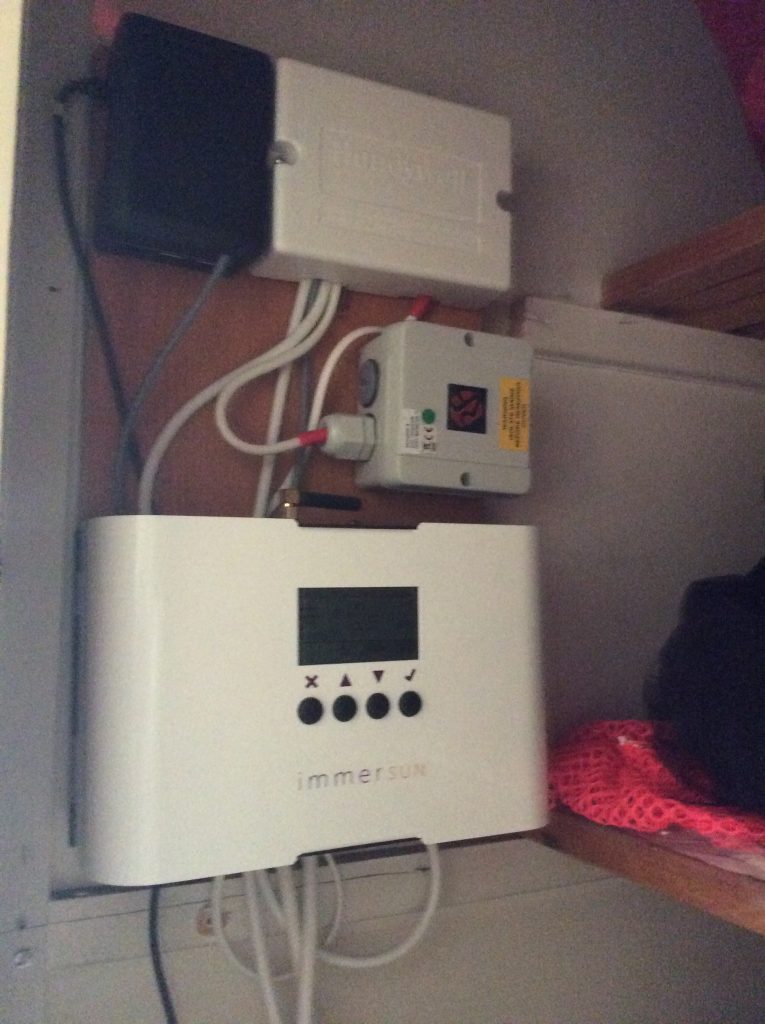
Relay HAT on Raspberry Pi 3 (without standoffs fitted or insulation layer).HEMS2 (the black box) replacing my original HEMS
As previously two cables connect to the HEMS – a black USB cable bringing 5V power and a grey multi core cable that brings a live mains feed to the relays with three switched lives returning to the adjacent junction box. The relays control my less intelligent loads – the ImmerSUN and the car charger – while other more intelligent loads are controlled via APIs via Wi-Fi and the cloud. The whole assembly continues to be mounted on a board on the side wall of the airing cupboard. When modification is required the assembly can be lifted off two screw heads and laid on the floor.
All the software on both generations of HEMS is the same except for the scripts that interact with the relays – either to set or read status. I assume that the pinouts on the Pi must have changed between generations as an identical HAT card moved from the ic0 to the ic1 bus requiring a single digit change to each interacting command.
Our local authority asks residents to separate a variety of materials for recycling (or landfill) as follows:
Glass in a dedicated plastic box.
Other recyclables (cardboard, metal, plastic etc) in disposable council-supplied pink sacks.
Kitchen waste (via a grey caddy) and garden waste in a green council-supplied wheelie bin.
Corrugated cardboard folded and packed in a corrugated cardboard box.
Textiles in a bag with a special council-supplied label.
Non-recyclables in a black bag.
It’s important to dispose of waste properly as some materials will take an extremely long time to break down naturally causing them to accumulate in the environment.
Decomposition times by material type.
Many of these things including steel and aluminium (or aluminum for our US readers) are not only greener but cheaper to recycle than make new ones.
So, over the last few days I’ve been adding control of my wet goods (dishwasher and washing machine) to my HEMS so that it can start washing loads at the optimum time – that is the times with the lowest projected electricity cost for a typical wash cycle.
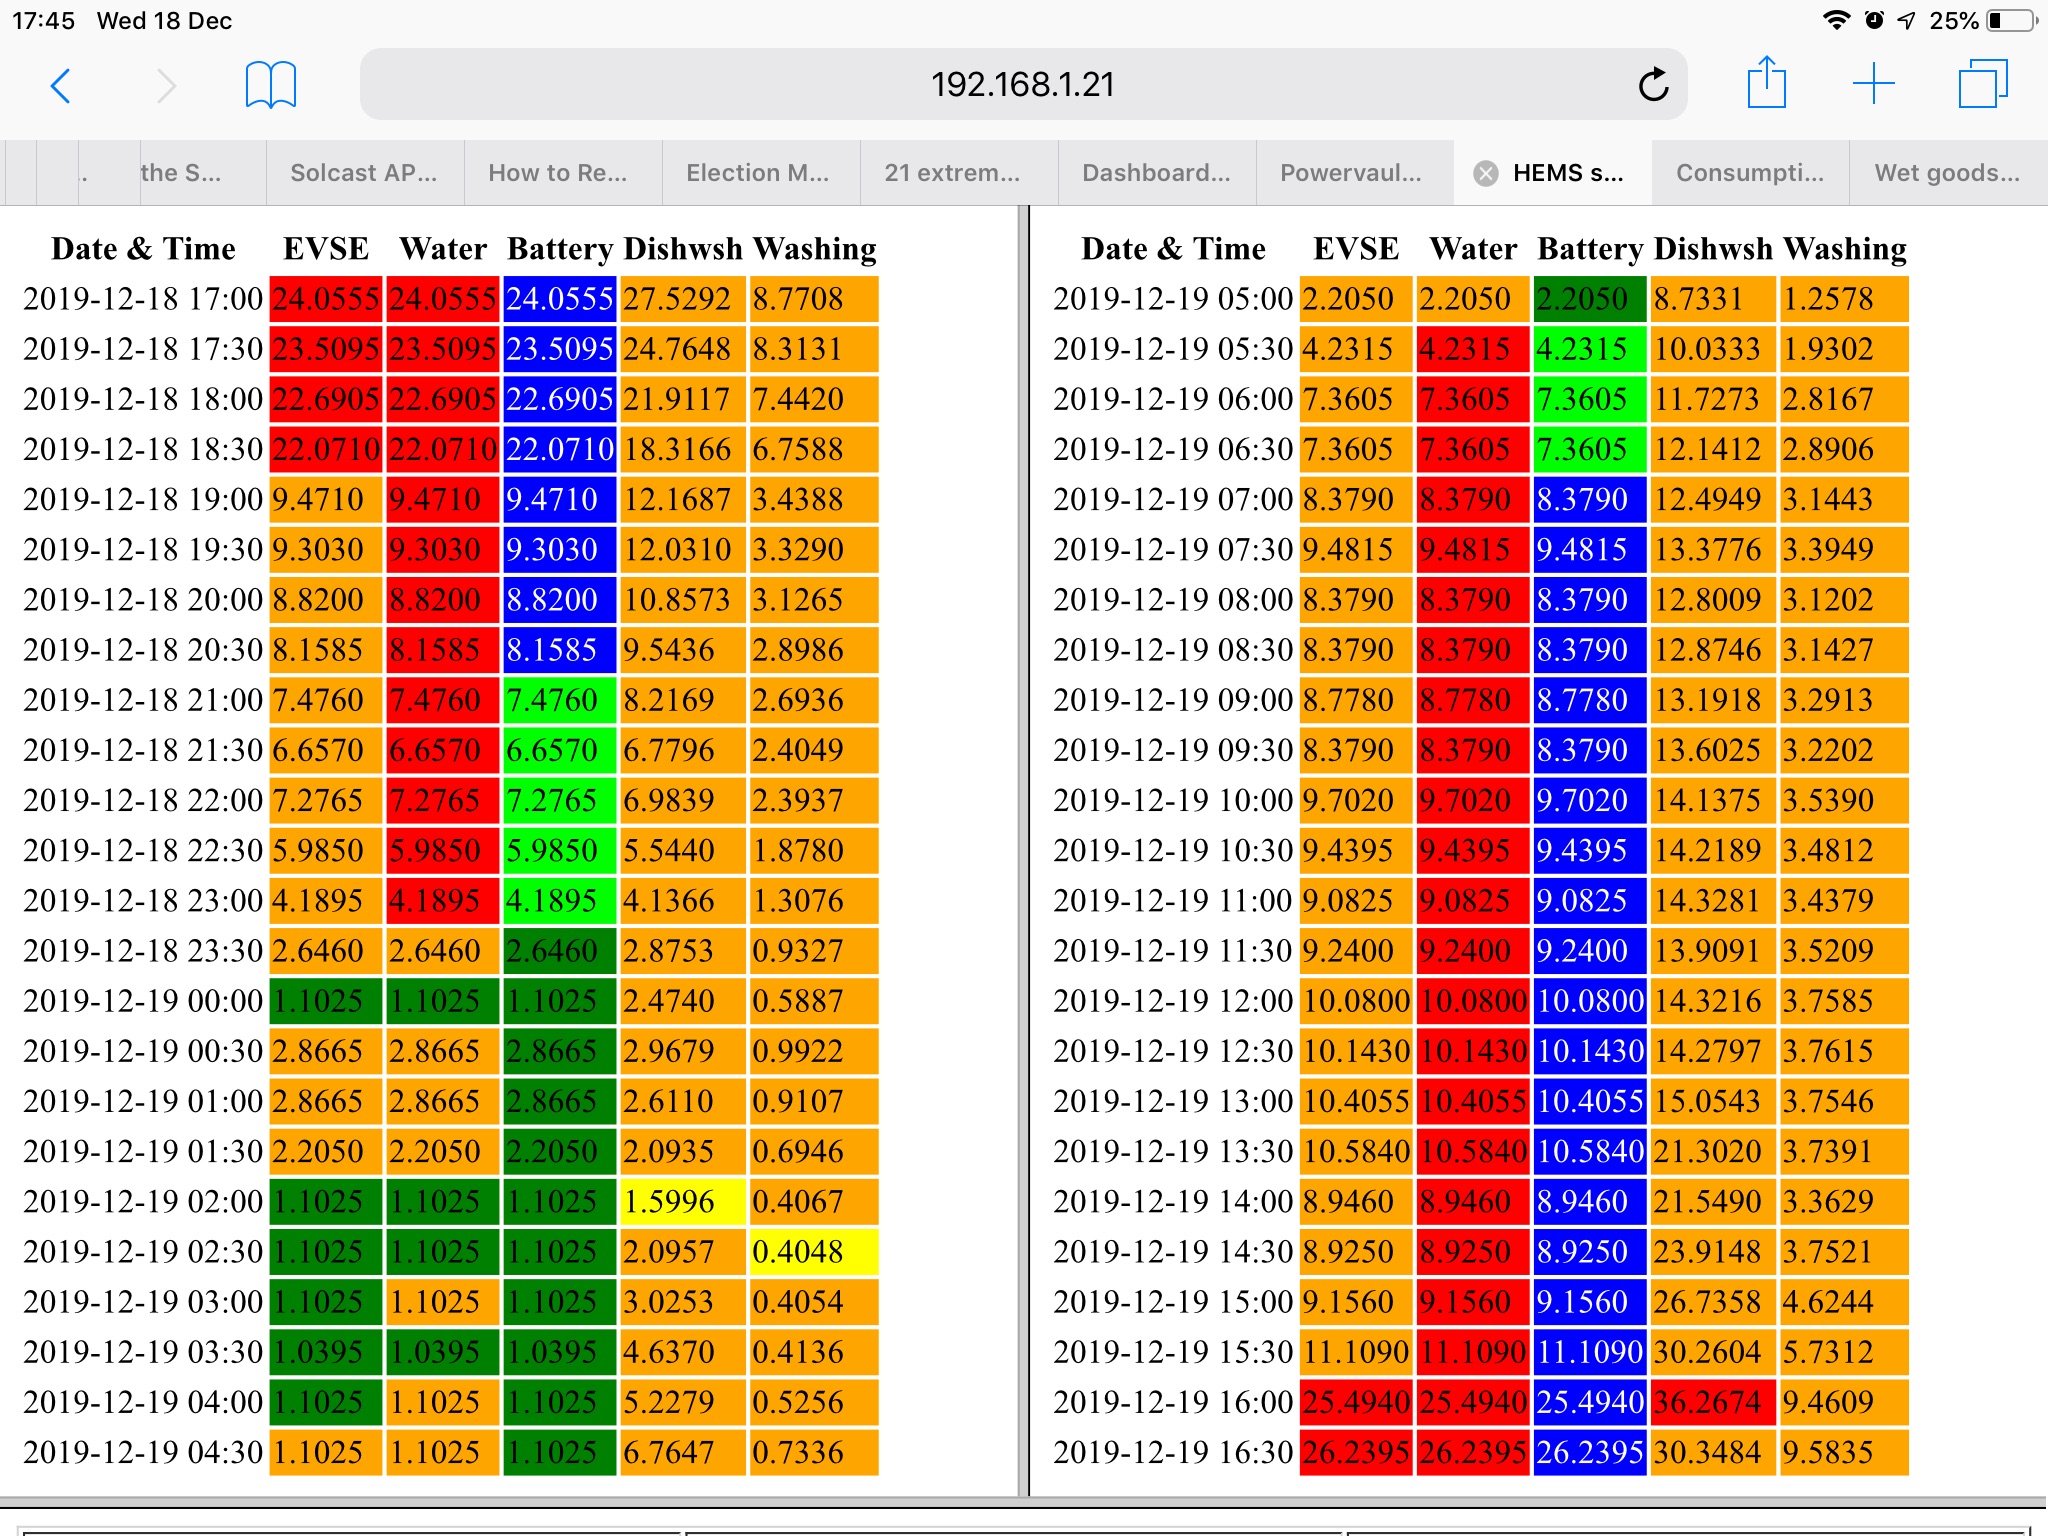
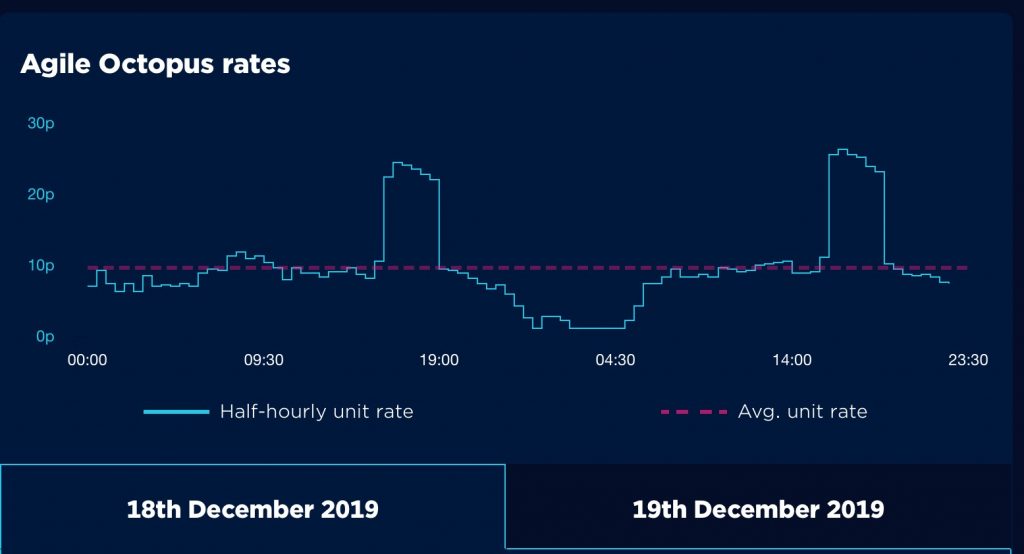
Electricity prices for 18th and 19th December.
The above image shows the prices for December 18th and 19th as downloaded by the HEMS at 16:45 on the 18th after publication of prices for the 19th. The HEMS then reviews this pricing against the need for electricity to determine when to use electricity and, in the case of the battery when to discharge the battery. I currently have the HEMS configured to provide:
3 hours of car charging
Not more than 2 hours of water heating (but only when electricity is cheaper than gas which can also heat water)
6 hours of fixed battery charging.
Best start time for dishwasher and washing machine.
HEMS plan for 18/12 17:00 to 19/12 17:00.
I’ve described the operation of car charger, water heating, and battery previously; the new content here is the two final columns on each side for dishwasher and washing machine. The numbers in the columns are the estimated cost of a washing cycle if started at the beginning of the corresponding half-hour. The yellow colouring reflects the selected half-hour to start the appliance i.e. the one with the lowest estimated cycle cost. There’s also the option to set a threshold above which one is not prepared to pay to wash today which has resulted in the red box. If the whole day was red then the washing cycle would be deferred for consideration the next day.
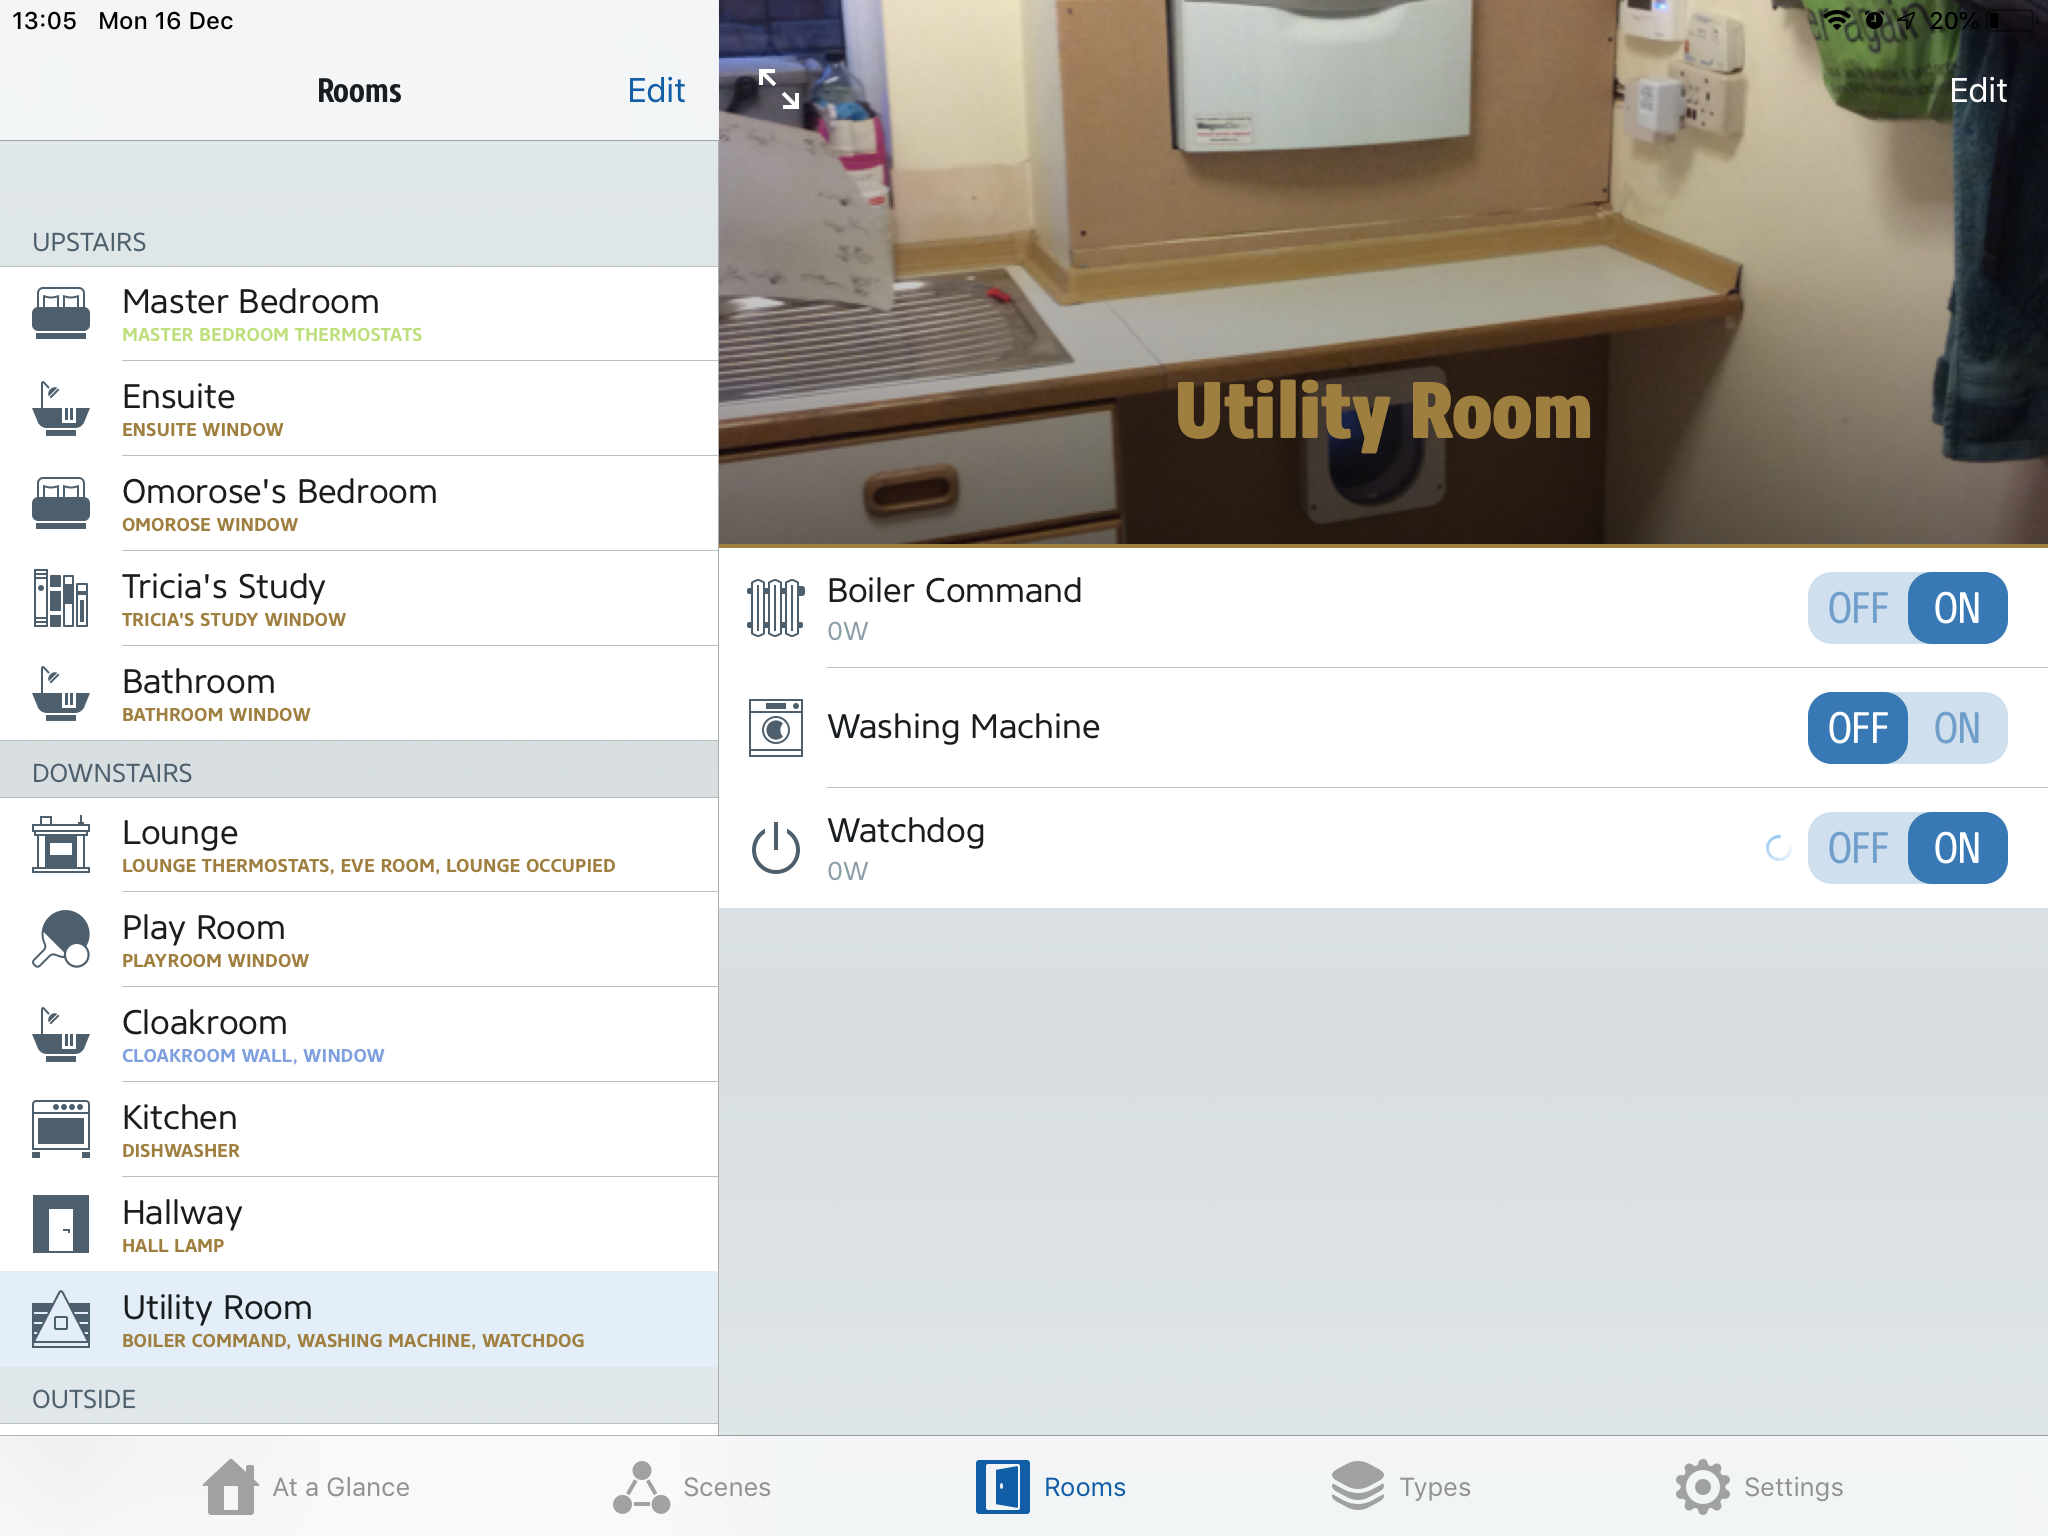
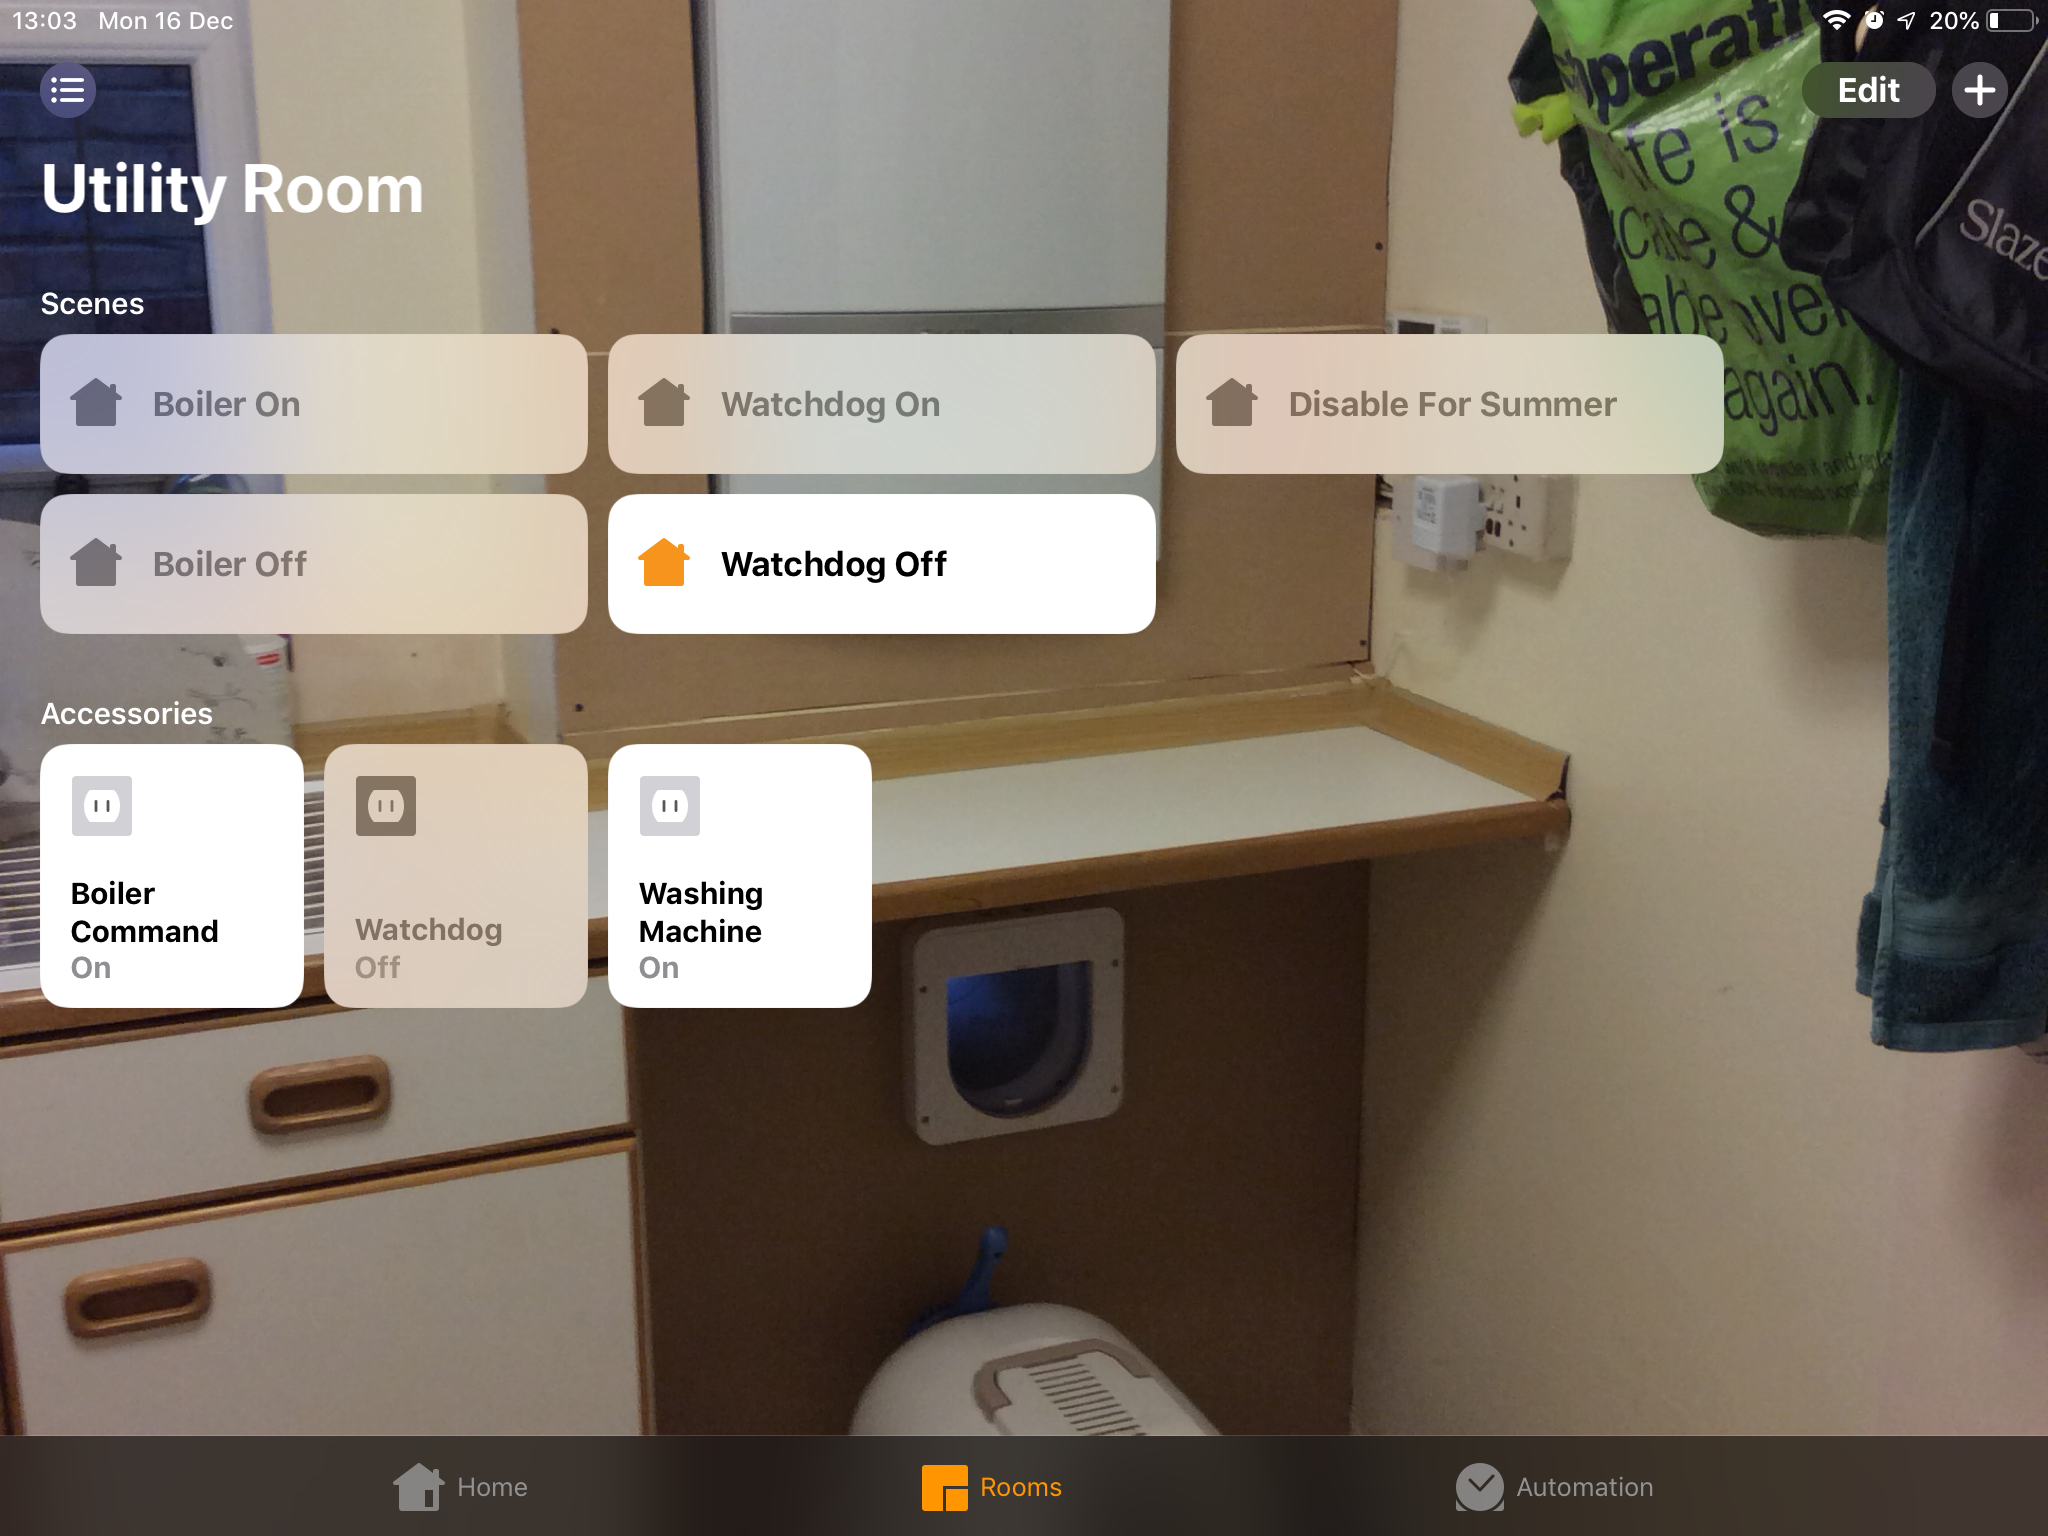
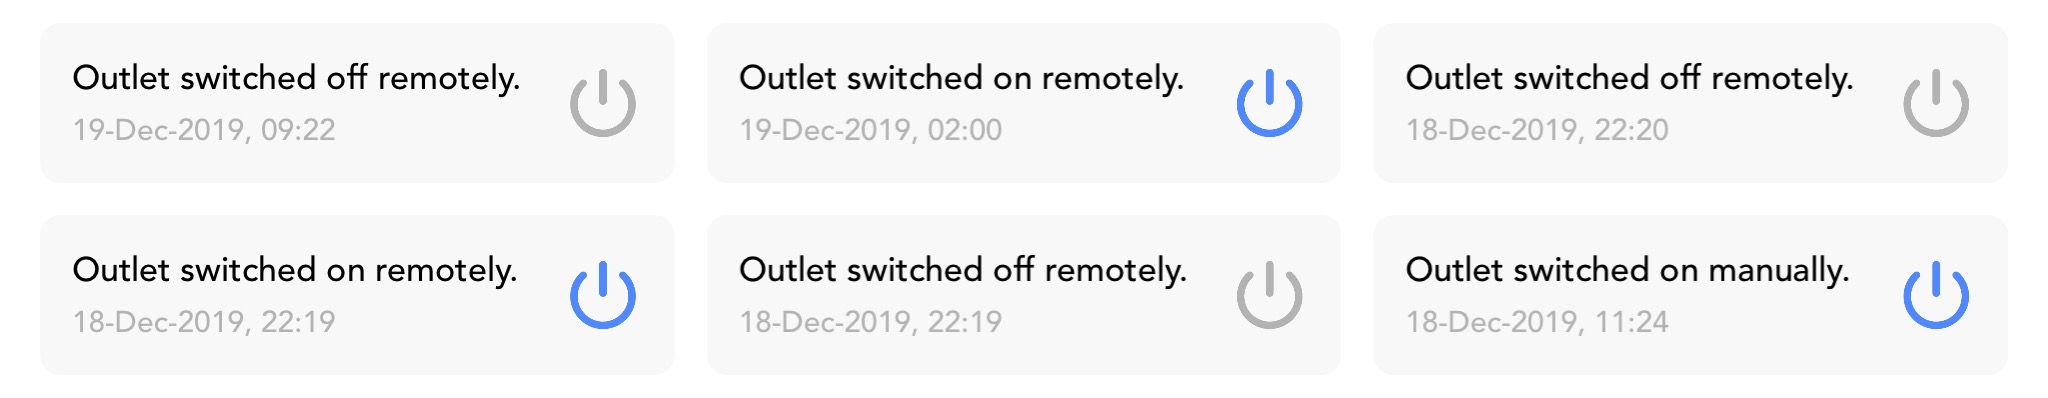
History from Dishwasher WIFIPLUG
The extract from the WIFIPLUG history for the dishwasher shows the typical operating sequence:
@22:19 I turn the WIFIPLUG on to enable the dishwasher to be programmed and the cycle started. The plug for the dishwasher is inconveniently at the back of a low kitchen cupboard so this was achieved via the WIFIPLUG app.
@20:20 I turn the WIFIPLUG off via the app suspending the cycle in its first moments.
@02:00 the HEMS turns the plug on remotely allowing the dishwasher cycle to continue.
The equivalents for the first two actions for the washing machine can more conveniently be achieved via the push button on the WIFIPLUG itself as the plug for the washing machine is above the counter.
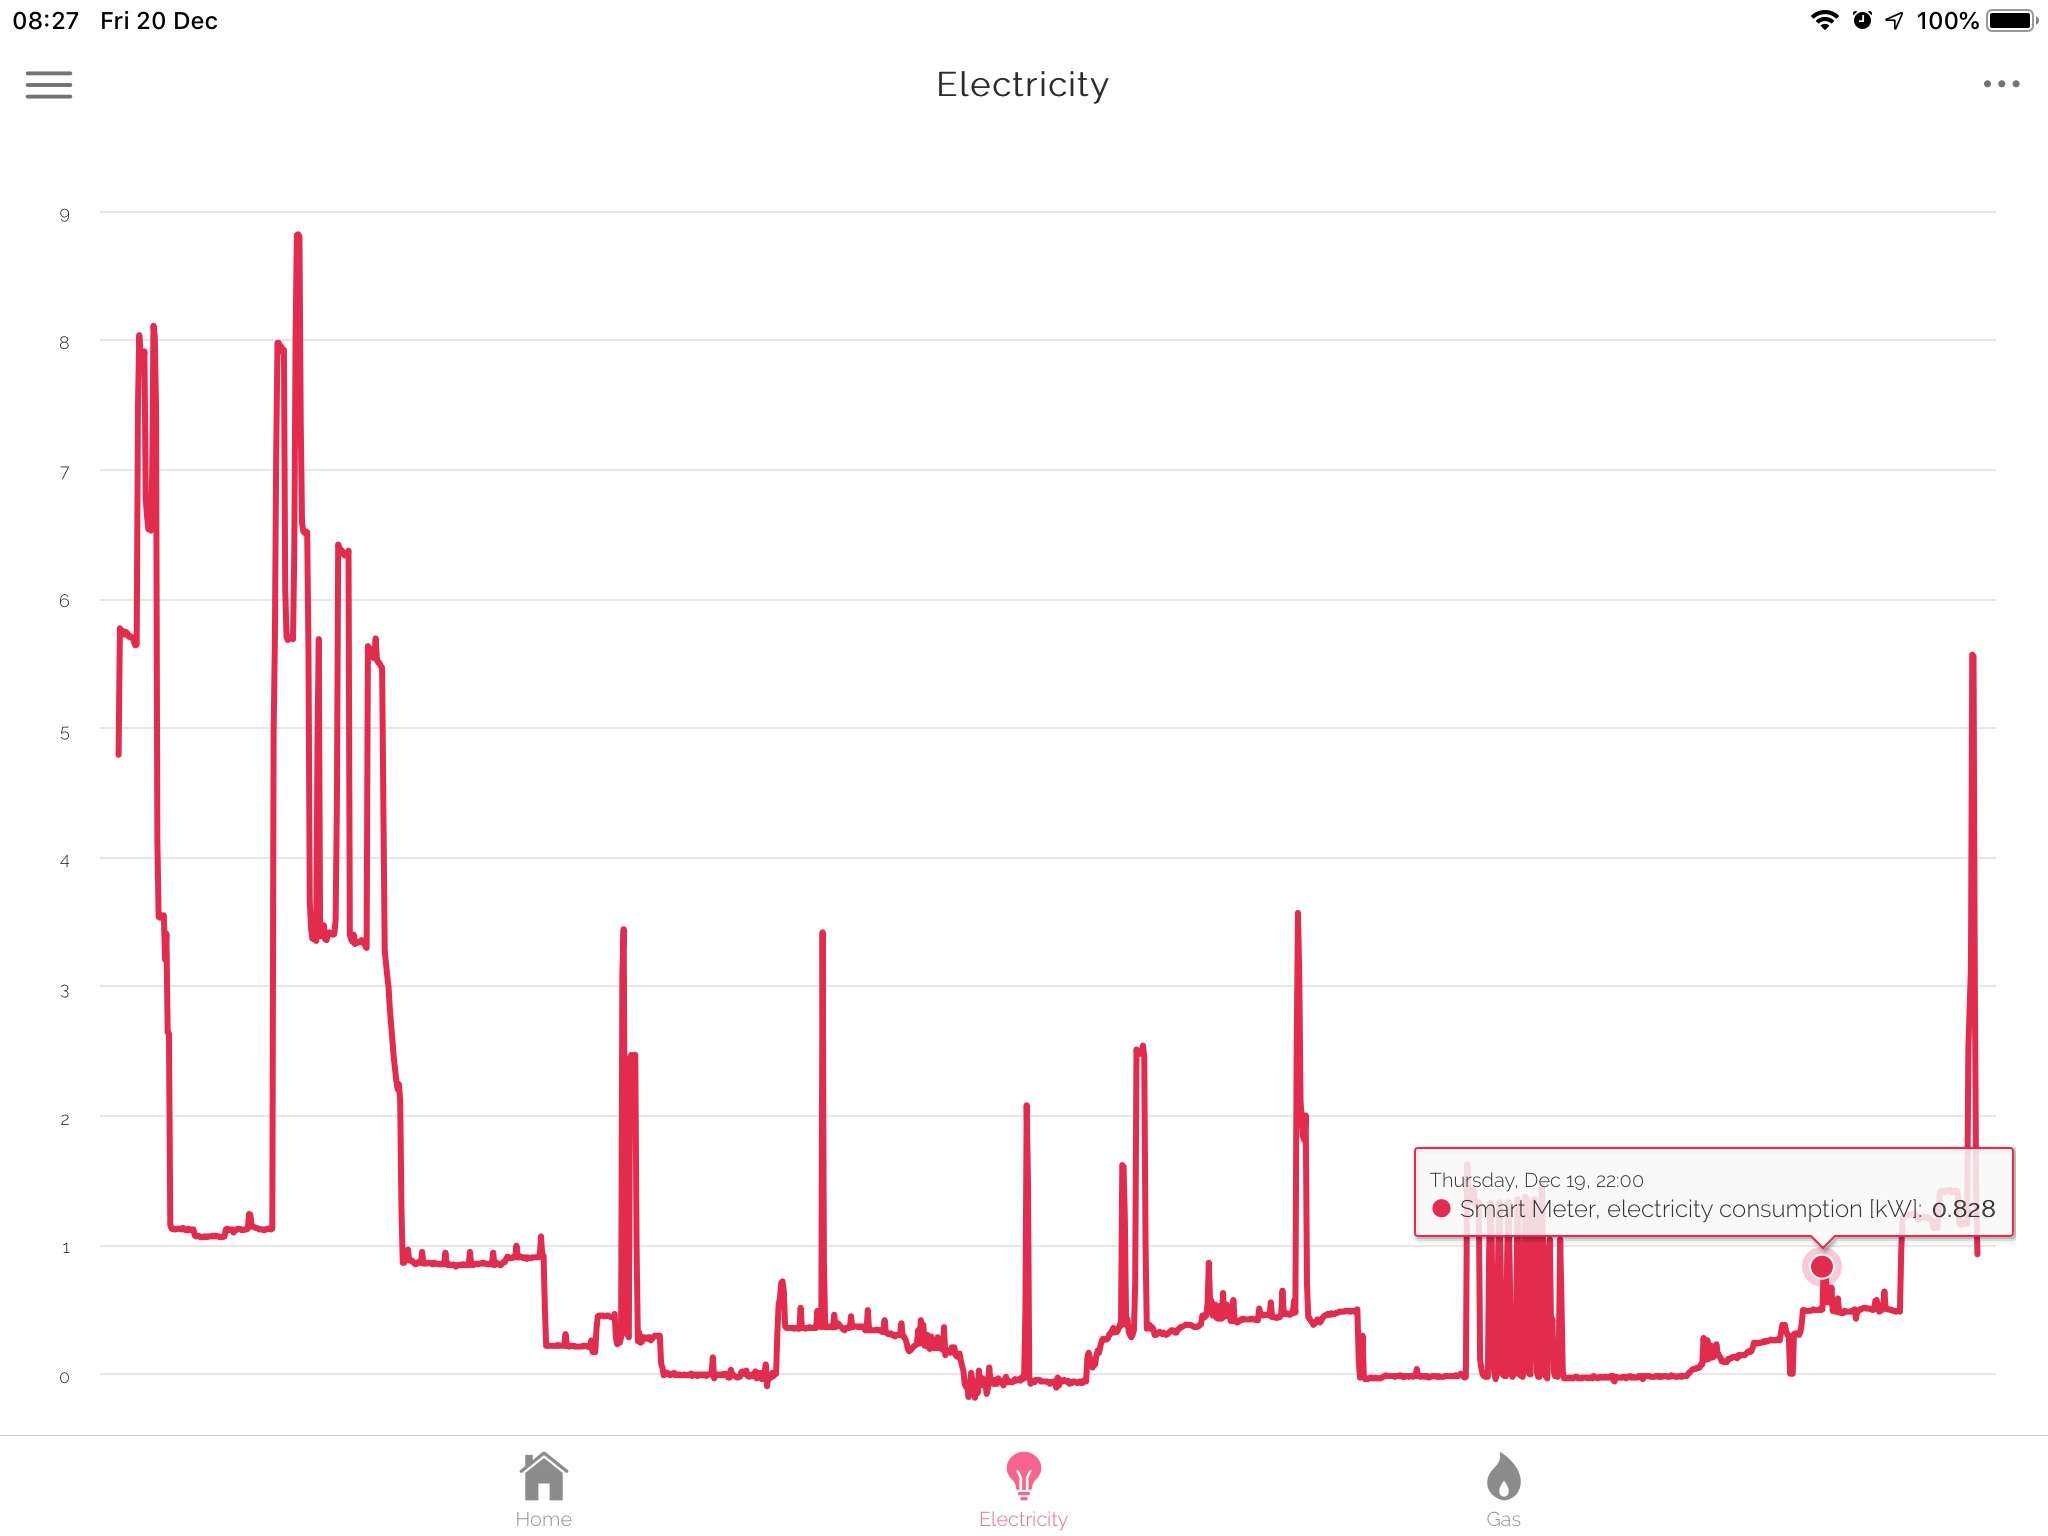
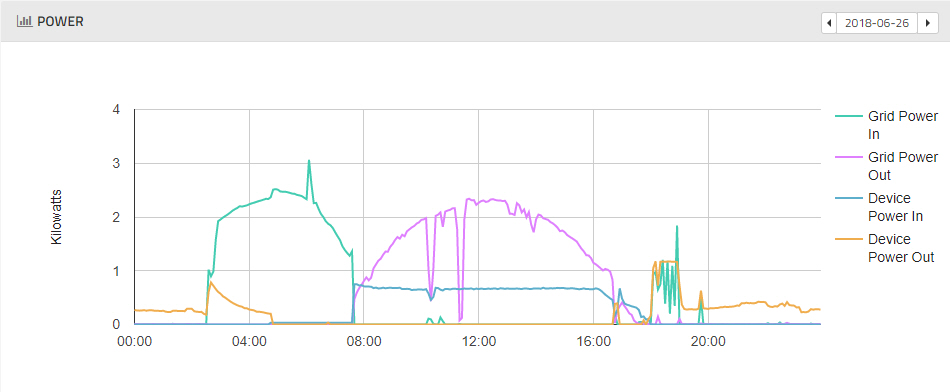
Electricity consumption 19/12.
The above image shows the measured power consumption from my smart meter. Almost 9 kW is being drawn at times under the action of the HEMS when the electricity price is cheapest, but also zero at times when the price is highest. The washing machine contributes to the peak spike around 02:00 when both it and the car charger are enabled. The later spiking during the peak period is the electric oven cycling on and off under control of its thermostat as the battery isn’t powerful enough to run the oven, so the excess power is drawn from the mains.
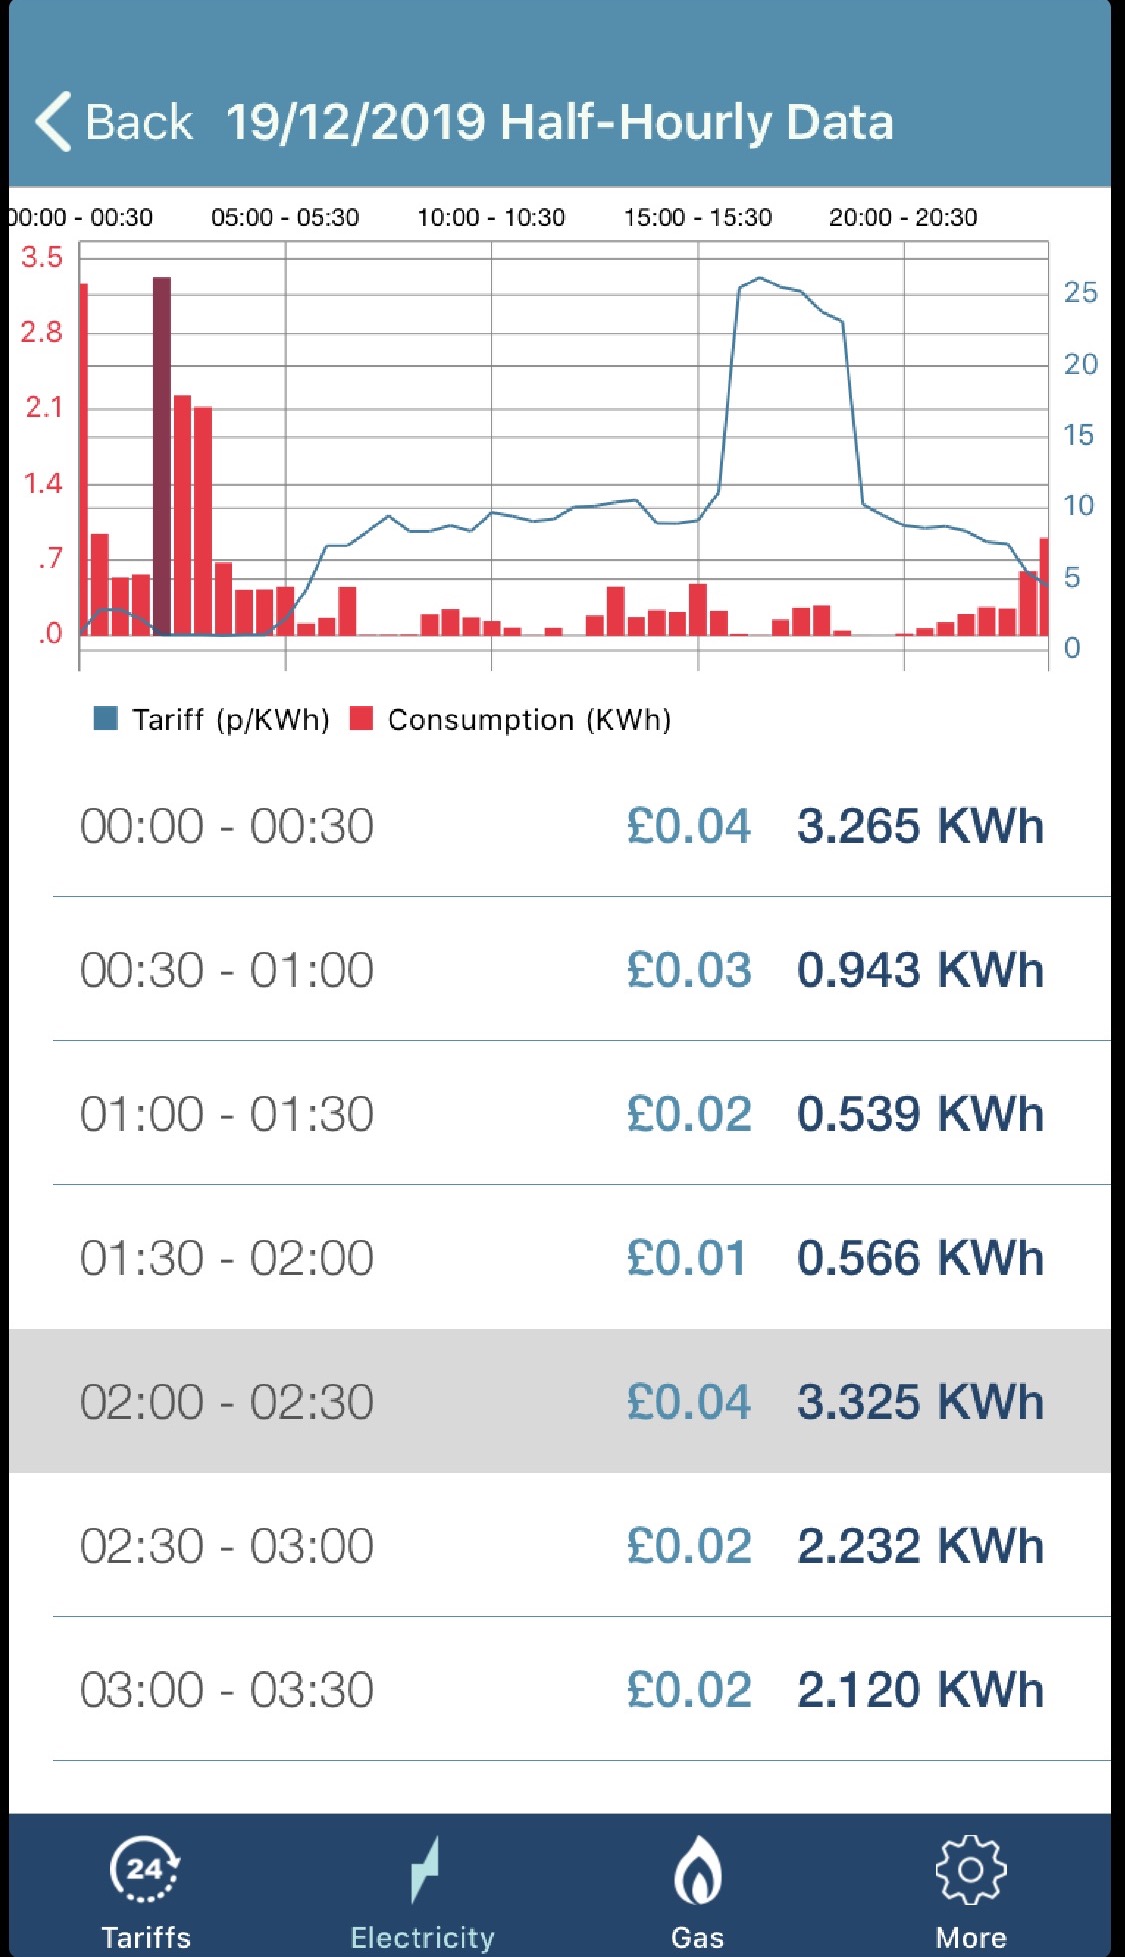
Electricity consumption and price 19/12.
The screenshot above shows the half-hourly electricity consumption and costs from Octopus. It should be noted that this is half-hourly consumption in kWh whereas the prior chart was power so, for example, an average 6.6 kW of power consumption results in 3.3 kWh of energy consumption in a half-hour. That the blue line of price is almost the inverse of the red cost columns indicates the HEMS is doing its job to shift most energy use to when the energy price is lowest, and use the battery to offset demand when the price is highest.
Overall on the 19th I paid £1.07 for 21.776 kWh of electricity including standing charge which is independent of use. That’s 86 p for 21.776 kWh without the standing charge, or a weighted average of 3.95 p/kWh. That weighted average of 3.95 p/kWh compares to a range of 1.10 to 26.24 p/kWh during the day. According to UK power the average cost of electricity in the UK is 14.37 p/kWh so I paid 27.5% of the average UK price on December 19th.
This post describes the evolution of my HEMS code to control my dumb wet goods (dishwasher and washing machine) using smart plugs.
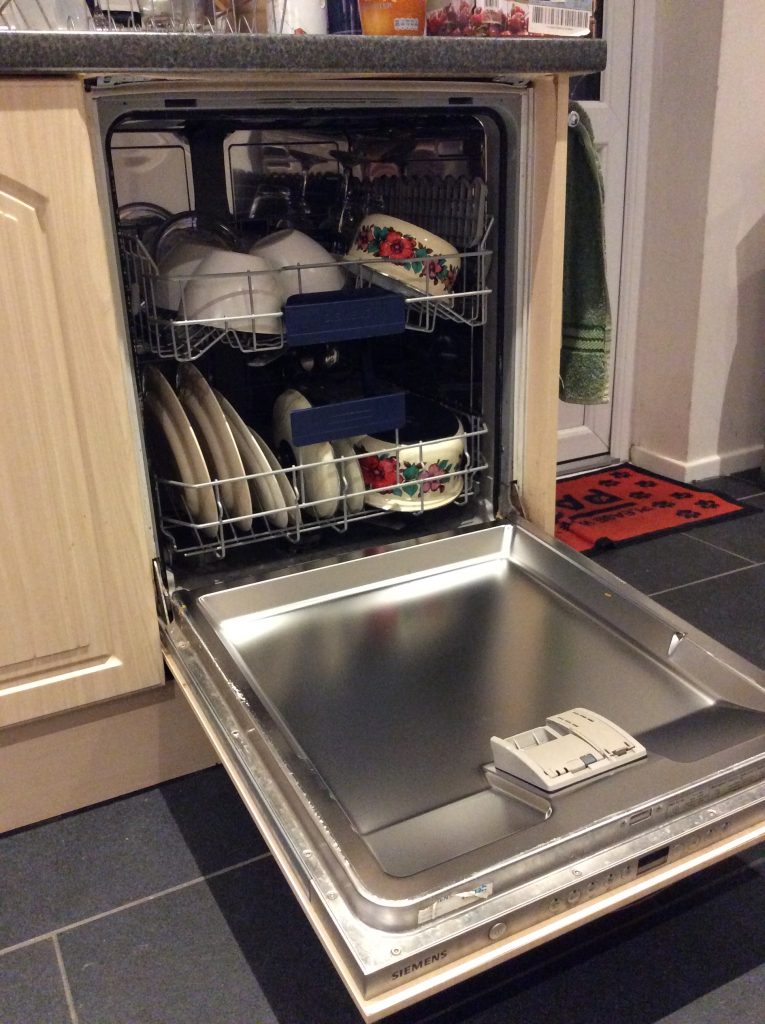
Siemens Dishwasher
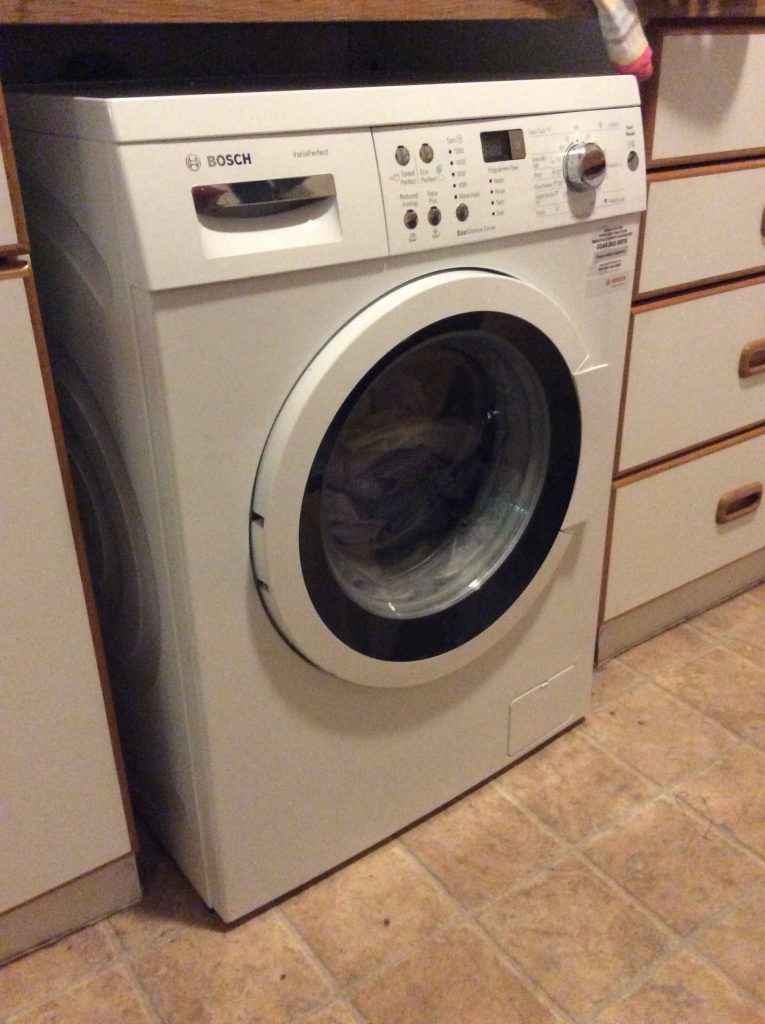
Bosch Washing Machine
The program for my HEMS works as described below. For clarity I’ve emboldened the new steps associated with the control of the wet goods:
Download the cost data for Agile from Octopus. The API provides 48 hours of data, but I use only 24 hours at a time. I download at 16:45 to create a schedule from 17:00 today to 17:00 tomorrow. I use two fields only: the date-time stamp and the energy price inc-VAT.
Calculate cycle cost. Reverse sort the unit cost data in descending time, and combine the energy price with the load profile for each non-interruptible device (dishwasher and washing machine) to estimate the cost of running a washing cycle starting on each half hour. Add as third and fourth fields to the data file.
Establish start time for each non-interruptible load. For each appliance in turn, sort the cost data in ascending cycle cost. Enable the appliance for interval with the lowest cycle cost within an acceptable time window (typically the first row), and overwrite remaining instructions from the prior day. Repeat for other appliances.
Establish on times for each interruptible load. For all interruptible loads (battery, car charger and immersion heater) sort the data in ascending unit cost. Replicate the unit cost column for each interruptible load. For each load enable for the required number of half-hourly intervals within the time window set by the user, and disable for higher cost half-hourly intervals.
Prepare user screens. Sort data file by ascending time, split into first and second 12-hour periods, and present as two HTML files.
Shell script to create daily schedules and user screens.
The top level scheduling script which runs automatically at 16:45 each day is a shell script which calls a series of awk scripts to: (i) calculate cycle costs for wet goods, (ii) determine start time(s) for each wet-goods appliance, (iii) determine on/off times for interruptible loads.
Awk is a pattern-matching program for processing text files. Such text files may be thought of a series of records and fields in a textual database. Awk may seem an odd choice of scripting languages, but essentially the processing of a text file of 96 time and unit pairs to create HTML files of 48 times and cost combinations is a text file processing task. Along the way as each on or off decision is made a system call to the OS is made by awk to copy an on or off script to a time-stamped script (e.g. either washingmachineon.sh or washingmachineoff.sh is copied to washingmachine_0930.sh). An internal timer called cron runs each half-hour so, for example, at 09:30 it runs all the scripts with 0930 in their names which updates the status of each controlled device.
At the time of writing we have 5 HEMS-controlled devices:
Battery storage – interruptible – the only device with 3 states (normal, charge-only, force charge).