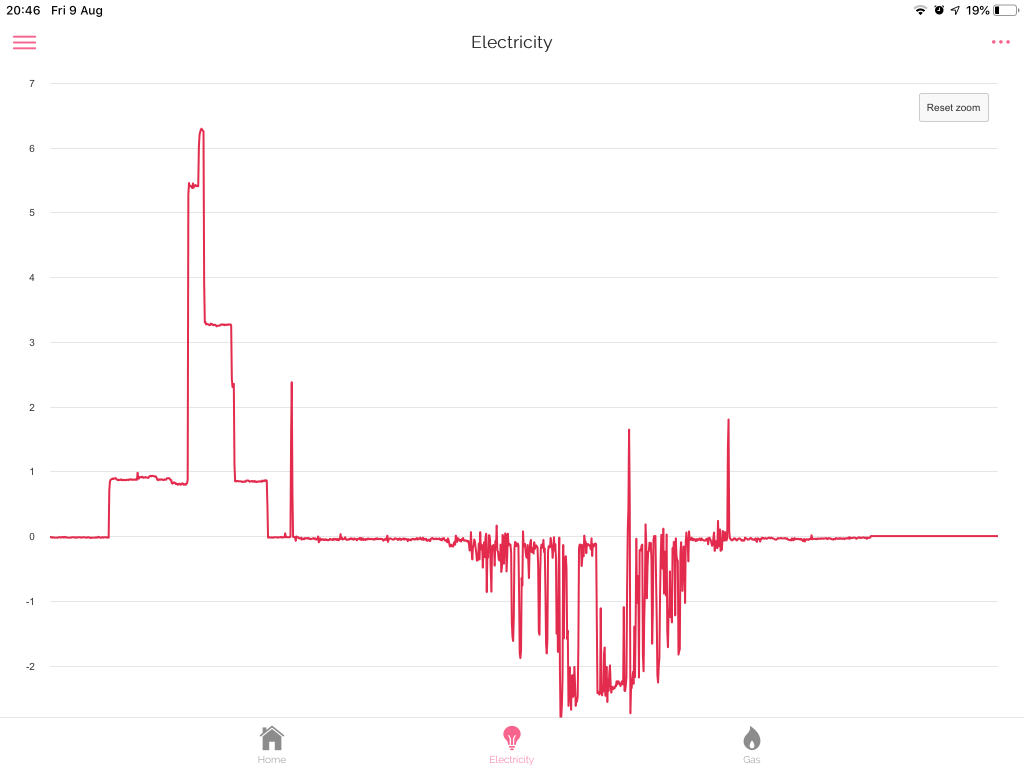
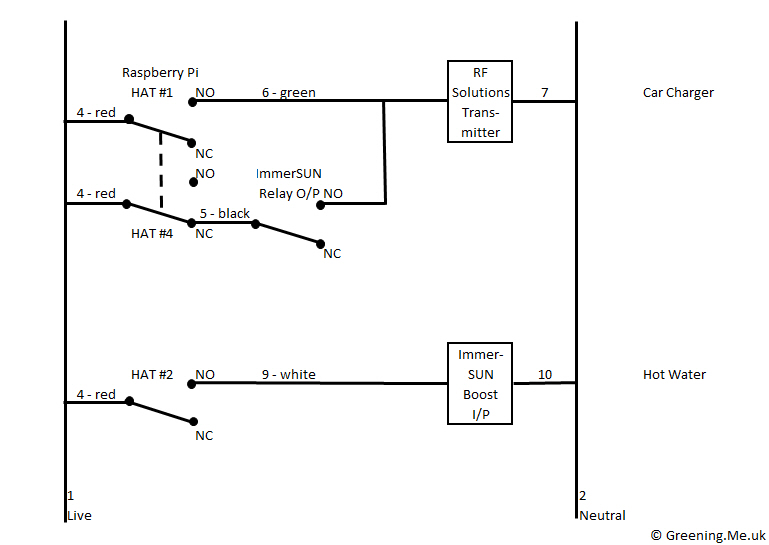
The loads that I already control via the HEMS (that is loads which can be interrupted like battery charging, car charging and water heating) are essentially constant, that is that they draw the same power regardless of progress. The battery charging does start to tail off at particularly high states of charge, but that effect is neglected here. However the non-interruptible loads like the dishwasher and washing machine are expected to have very variable loads as the cycle continues – largely because periods of water heating demand much more power than spraying water around, spinning the drum, or pumping water out.
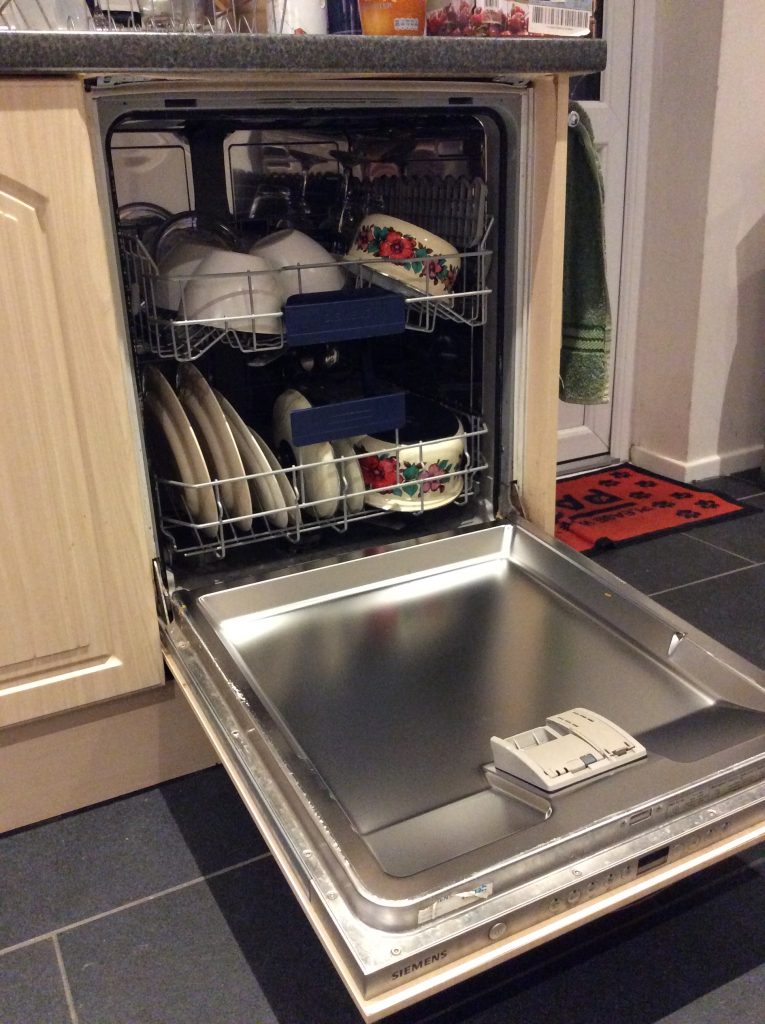
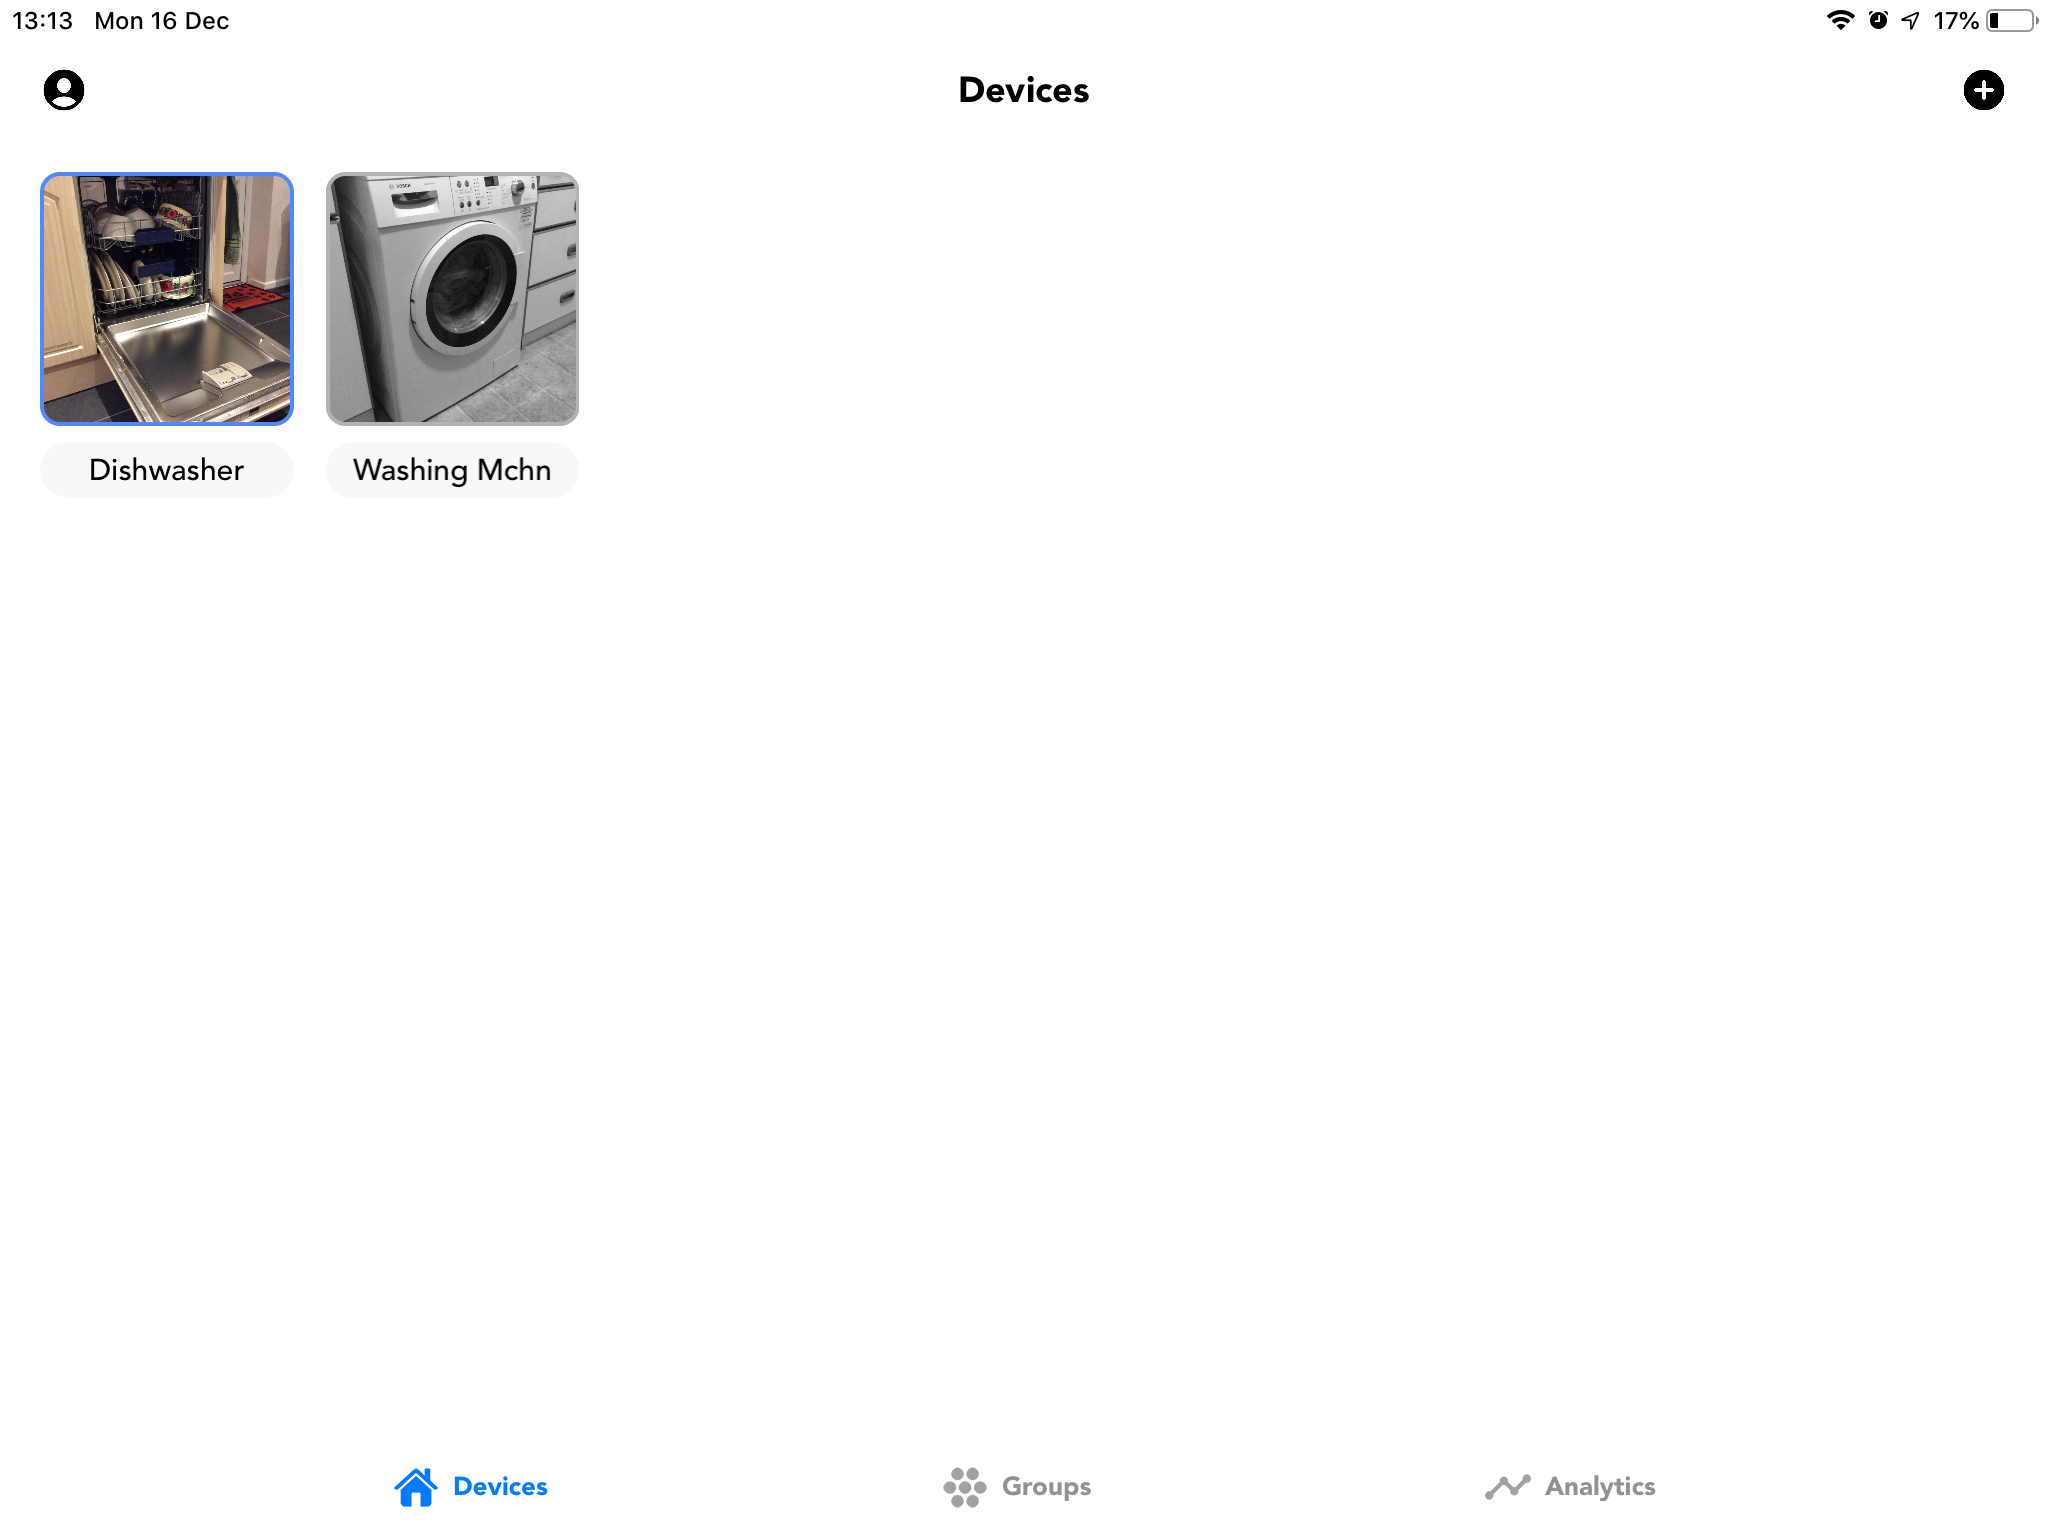
Siemens Dishwasher 
Bosch Washing Machine
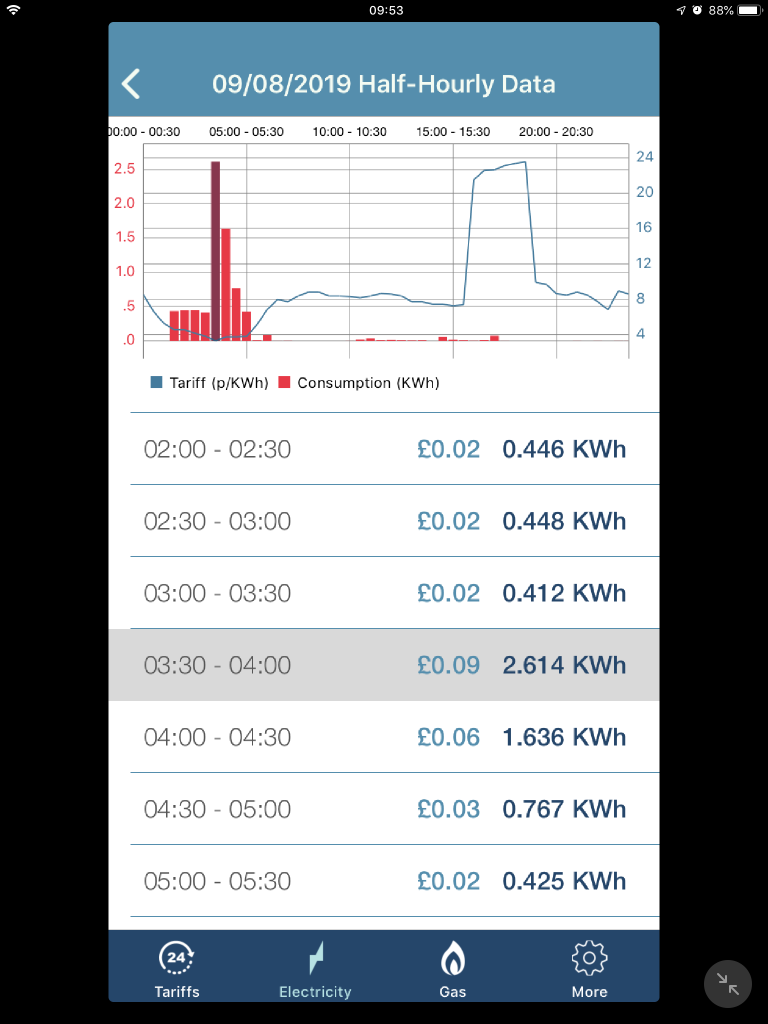
I thus decided that I would measure the pattern of these variable loads and use that information as part of the decision when to run the load for lowest cost. Rather than tabulate the half-hourly energy price as I do for interruptible loads, I would instead estimate the energy price to complete a load for each half hour in which I might start the cycle. This process of measuring the load pattern during a cycle I have referred to as characterisation.
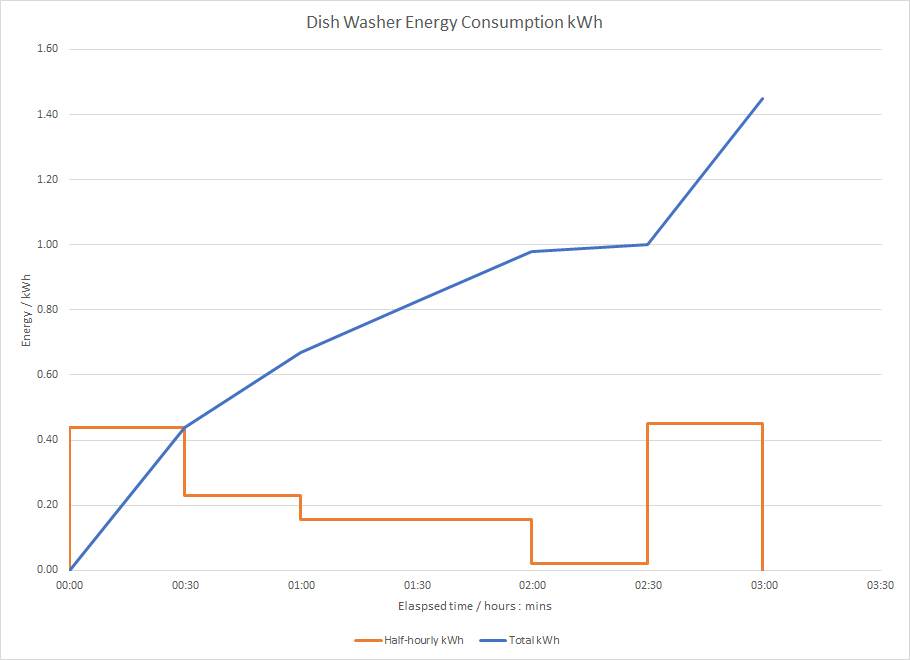
Dishwasher Characterisation 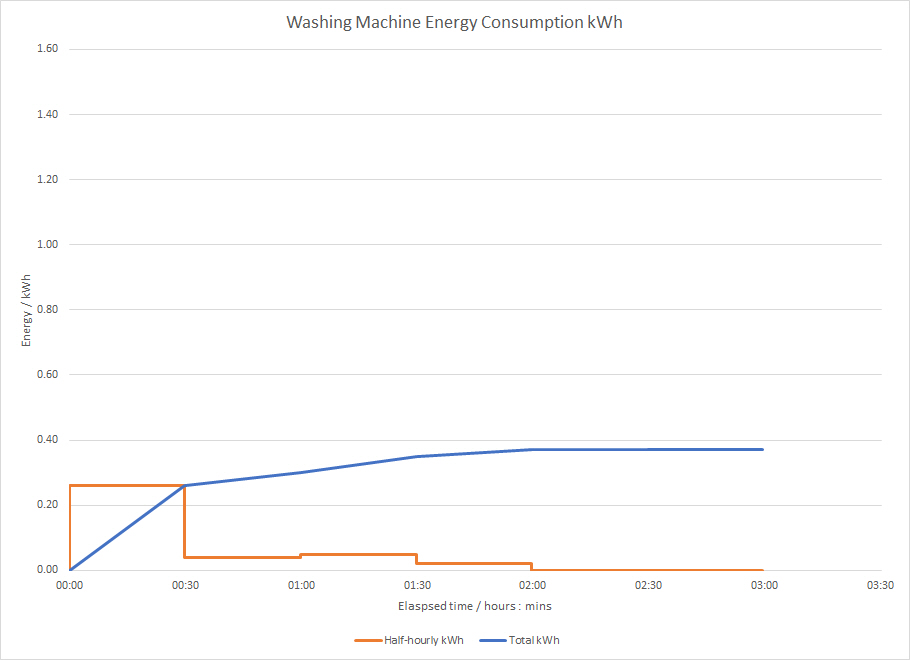
Washing Machine Characterisation
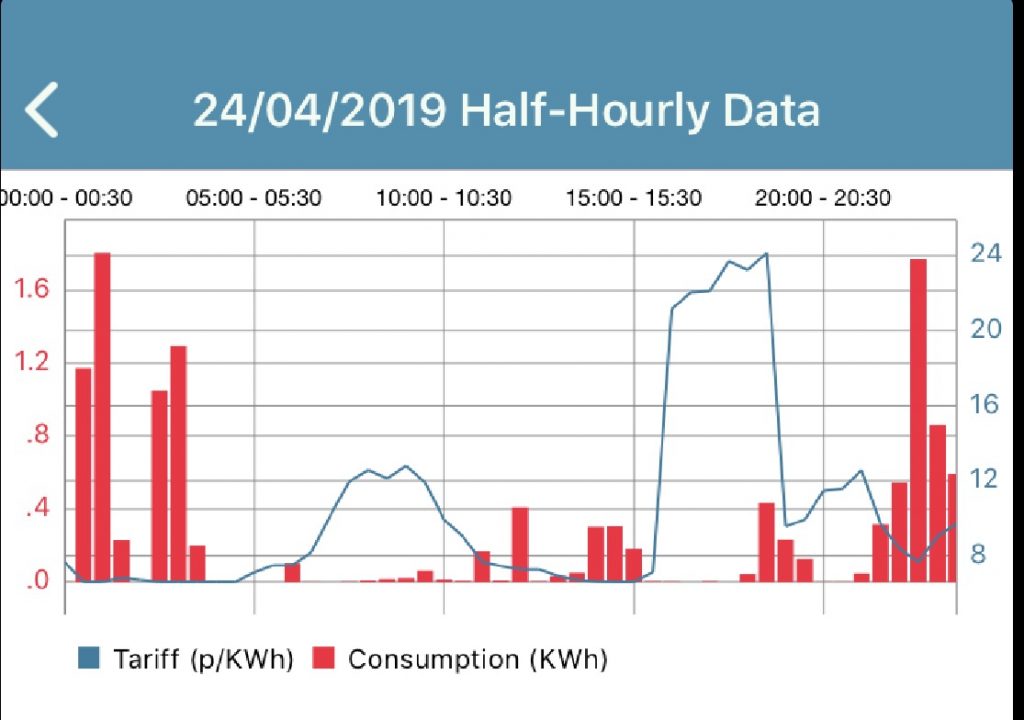
I characterised the loads using a plug-in energy meter reporting kWh which I read manually every half hour during a typical wash cycle to determine the blue lines above. I then calculated the energy usage in each half hour period as per the orange line. I did all of this half-hourly as that’s the interval after which the energy price changes and correspondingly the interval at which the HEMS updates its output controls.
The measured loads confirmed my suspicions regarding variation with heat inputs providing the largest loads – twice for the dishwasher as it both heats the water at the start and heats to dry the dishes at the end, while the washing machine also heats the water at the start but spins to dry the clothes at the end (which is more energy efficient). The effect of this is that the washing machine would generally be expected to start in the cheapest half hour as that’s when it uses most energy, while the optimum time for the dishwasher is more complex to determine.
Of course the actual loads for the wash cycle will vary from the prediction for various reasons including not only the ability to select different wash cycles and options but also the smartness of the device in assessing how full it is or how dirty the utensils are.
I also decided that I would not explicitly turn these loads off from the HEMS – only turn them on. Not turning the loads off allows for some uncertainty as to the length of a cycle depending on the actual cycle selected, options selected, loading of machine etc. Not turning the outlet off also provides for the user being able to do additional loads under manual control if at home later in the day.
Internally my HEMS creates a schedule of 48 half-hourly actions each day for each load. Typically each action is either ‘on’ or ‘off’ (the fixed battery is more complex). The actions for these devices will follow a similar pattern of 48 half-hourly actions, but typically only one of those is ‘on’ and the 47 actions that would normally be ‘off’ do nothing. There existence is largely for equivalence and re-use of code, but they also ensure that the previous day’s ‘on’ command is over-written as required if the start time for the new day is different to that for the prior day.