Author Archives: Greening Me

Opportunities in the import / export business

Most of us are used to a simple world of electricity where we pay for what we consume. For most folks like myself based in the UK that’s typically a fixed price per kWh/unit consumed regardless of time of day, even through dual-rate tariffs have been around for decades – the best known being “Economy 7” tariffs. However as the grid gets smarter then there are increasing opportunities to save on, or make money from, electricity.

Electricity opportunities for import / export and positive /negative cost.

Conventional – pay for power.

This is the area with which most of us are most familiar. We all get the idea of paying for the power we consume. Most UK households pay a fixed price per kWh/unit regardless of the time of day. We have a competitive electricity market, so there are the choice of 70 to 80 different providers who will make different offers regarding standing charge (sometimes marketed as a subscription) and unit cost.

There’s also the opportunity to choose between a flat rate tariff or Economy 7 even on conventional meters that provide a discounted night rate for 7 hours.. These typically provide a discounted night rate, but may charge a little more during the day. They used to advertise these as ‘less than half-price electricity’ but that’s often not the case now.

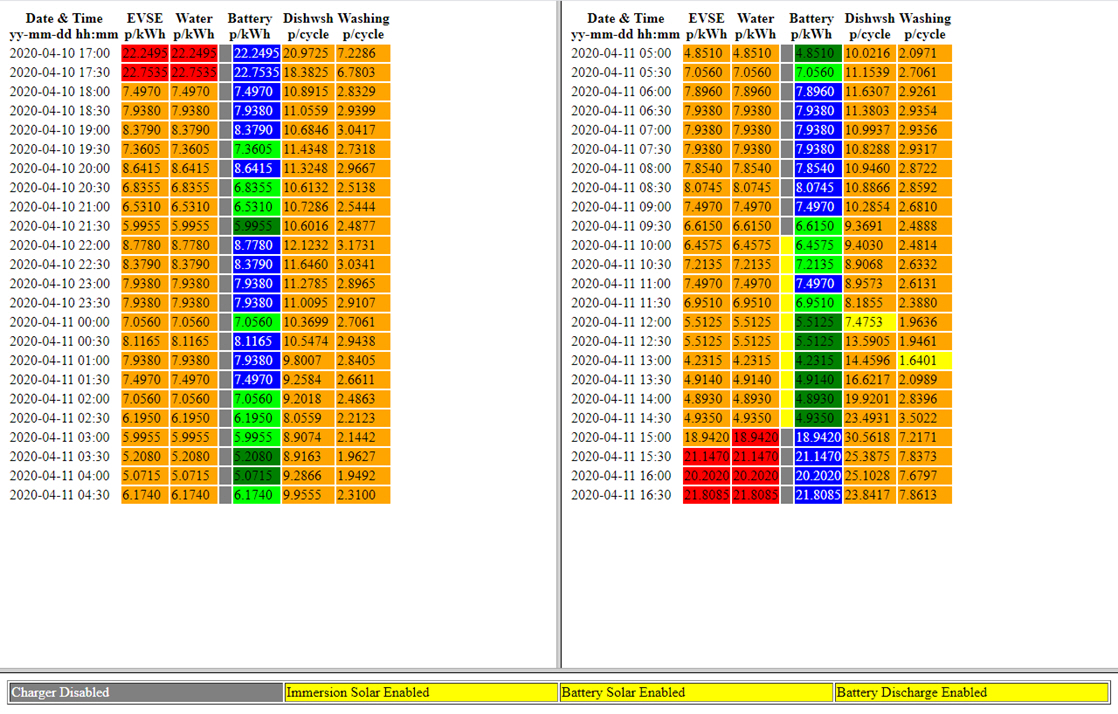
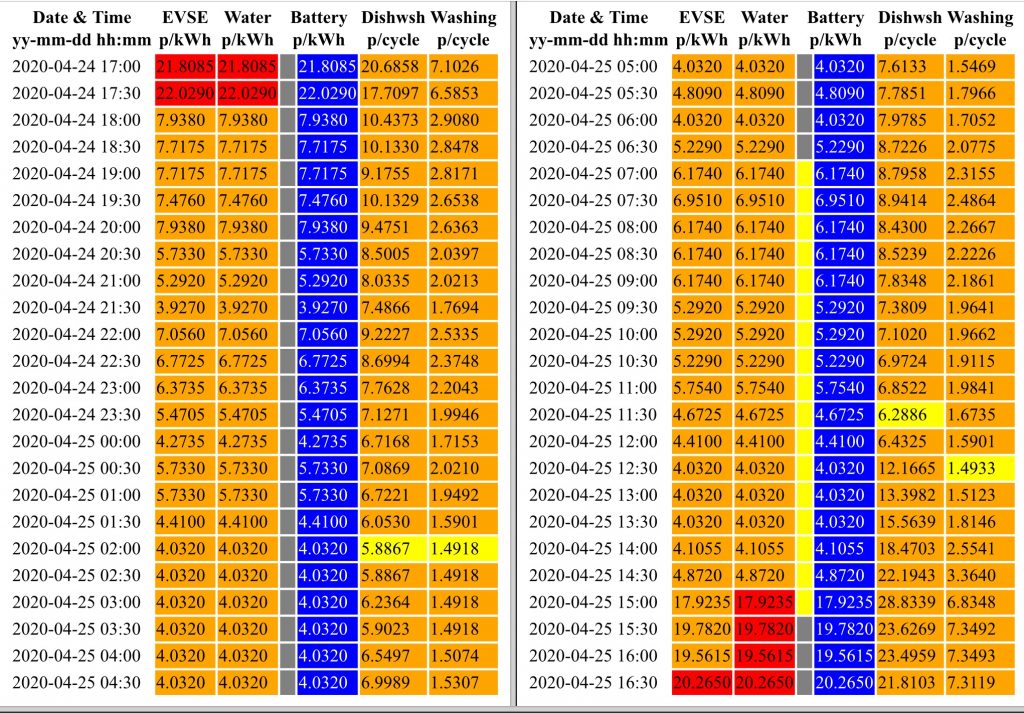
Stepping up in complexity (and opportunity) smart meters provide the opportunity for a more diverse range of tariffs including different cheap night time periods, more than two rates at different times of day (in extreme 48 half-hourly rates), and a free day at the weekend (i.e. a zero rate of a weekend day) etc.

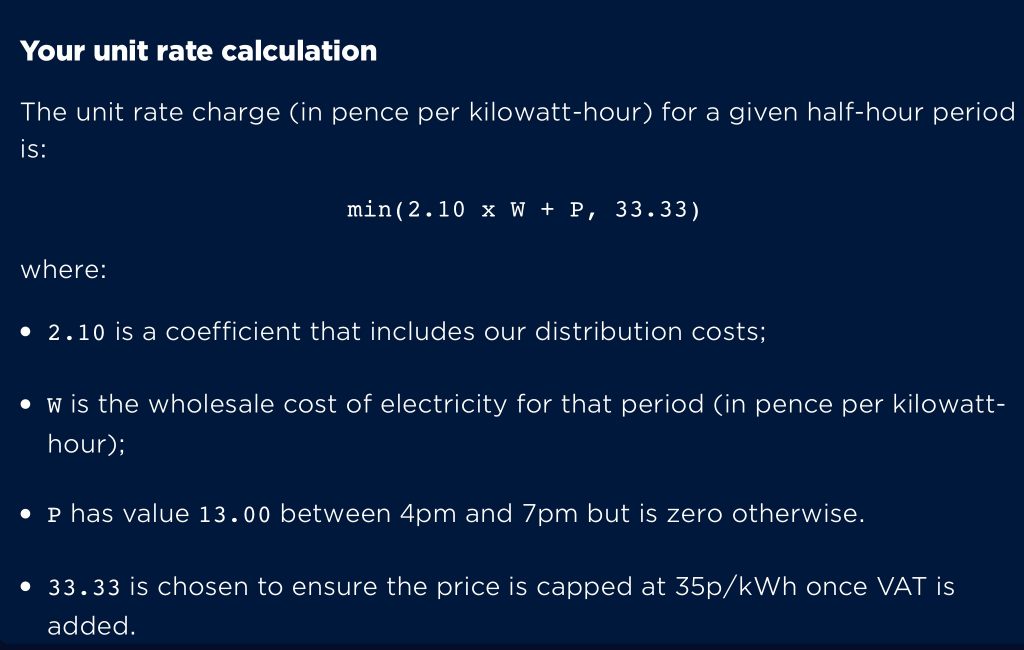
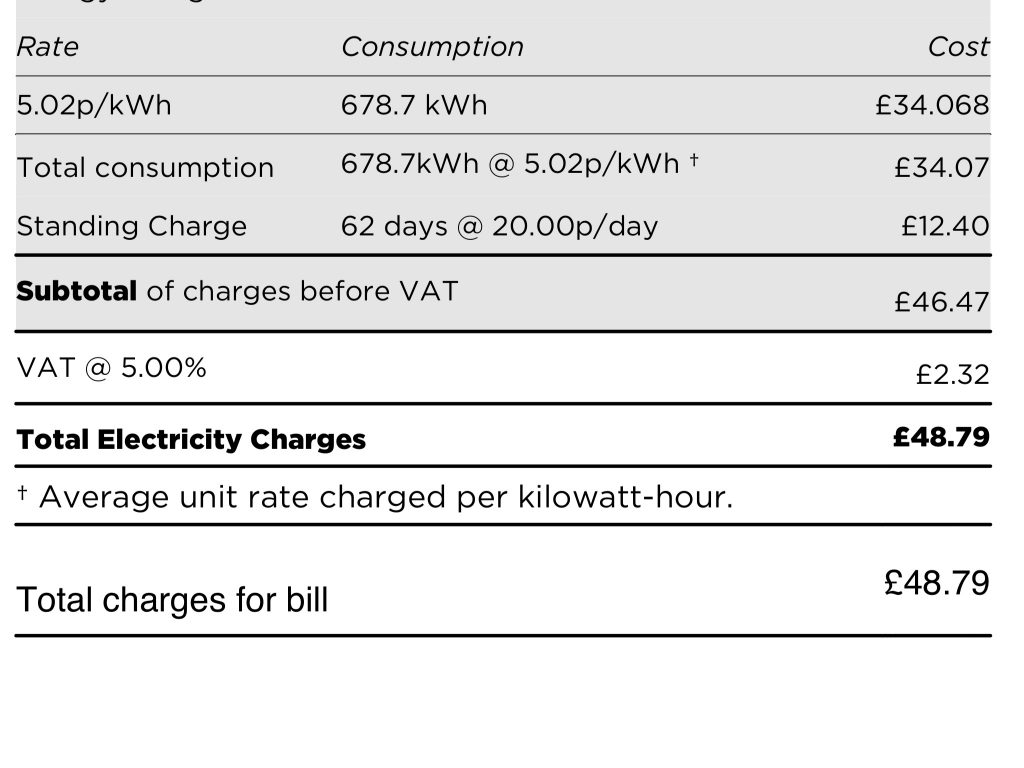
Beyond that my own tariff (Octopus Agile) not only has up to 48 different half-hourly prices/day that change daily based on that day’s market prices. That might sounds a bit scary but it can yield very cheap electricity prices – 4.48 p/kWh for me in April/May 2020 (for example) which is a third of what most people pay.

My electricity costs April/May 2020

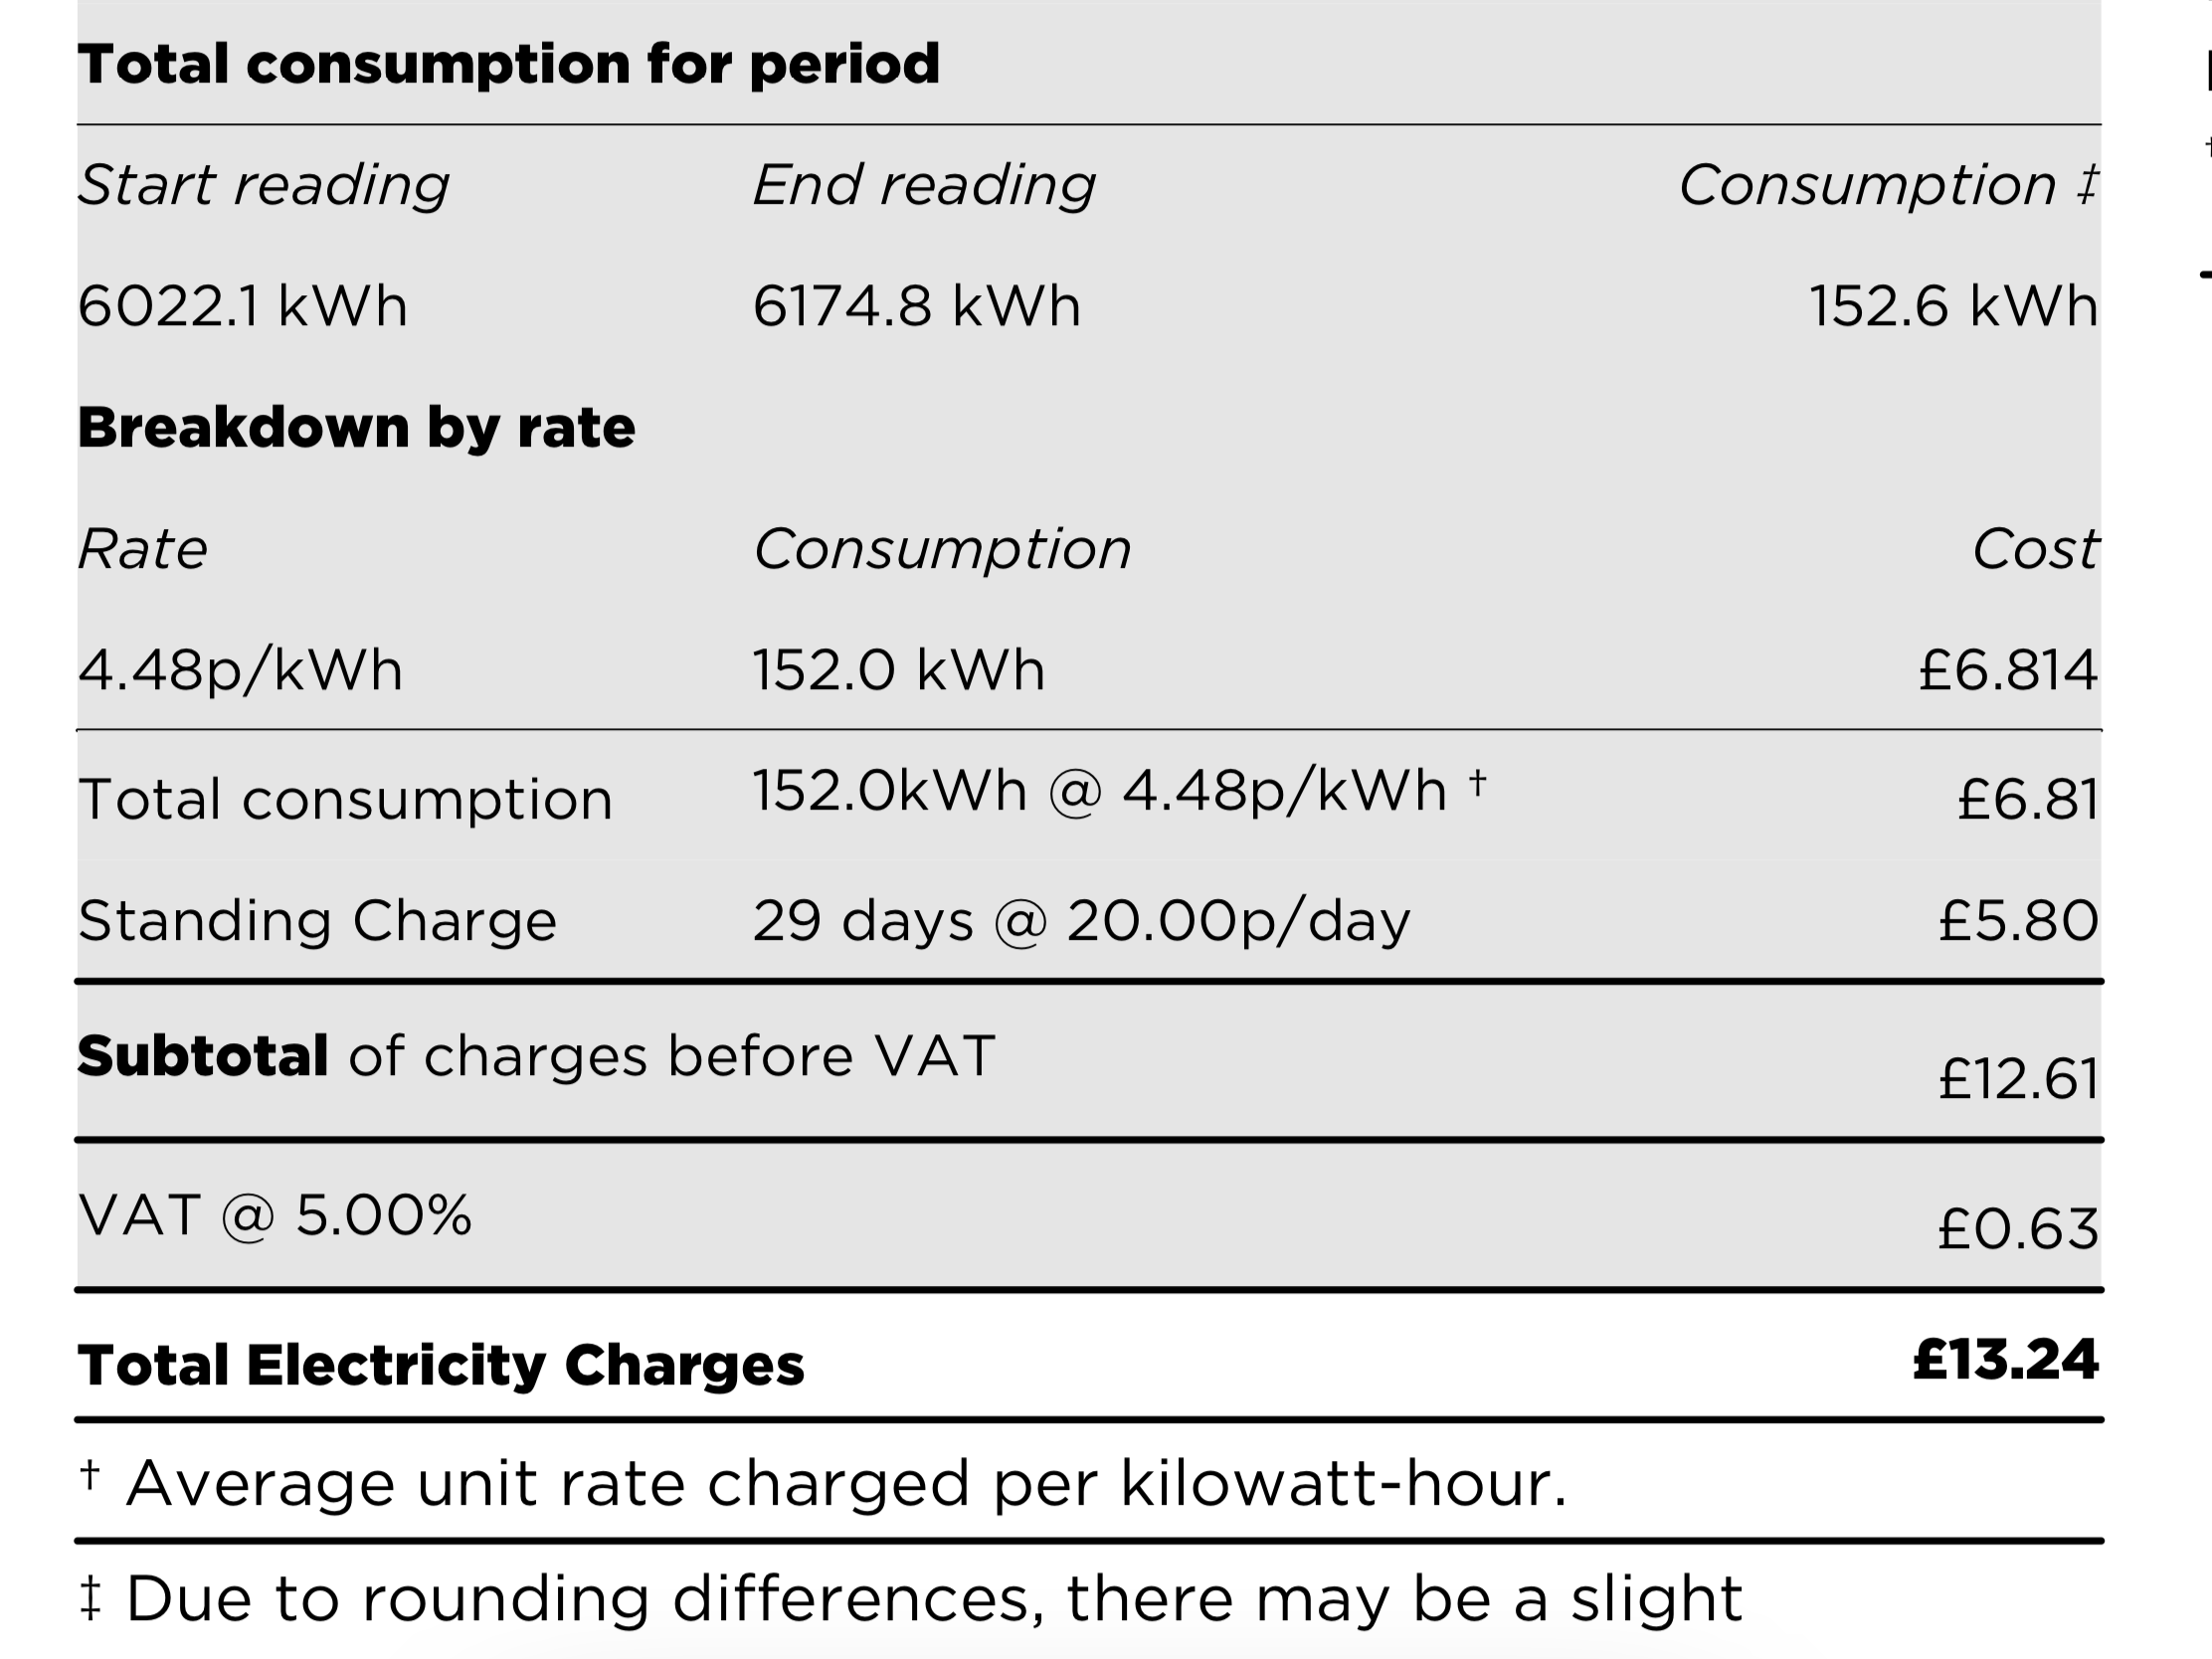
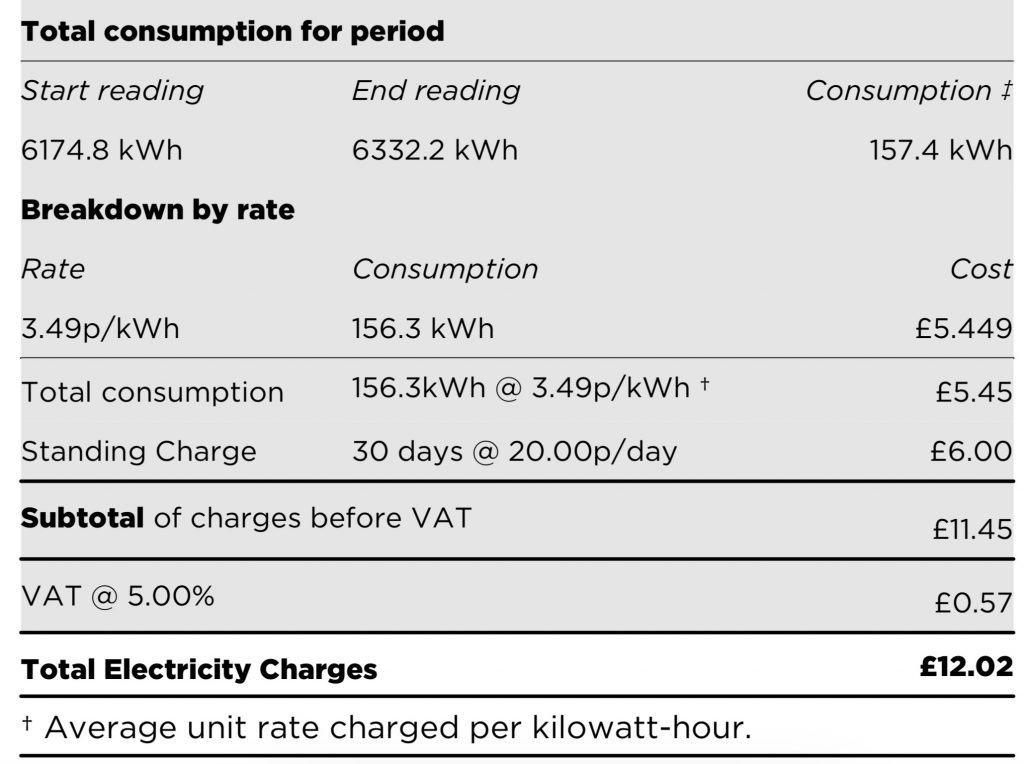
(The original version of this post wrongly had the table from my gas bill above and mistakenly claimed that I had paid “a quarter of what most people pay” rather than a third. Total consumption is untypically low at the present time due to limited miles driven.)

Agile – paid to consume

Top left on my initial diagram is Agile – paid to consume.

One of the features of the wholesale electricity market is that at times the market price for electricity goes negative. At such times the a significant excess of supply (typically because of high output from wind turbines) over demand (often but not always at night) yields a negative price so electricity companies looking to buy electricity are being paid to take it. Most electricity companies will continue to charge their customers the standard price in these circumstances but, with the octopus Agile tariff, the negative pricing is passed to the consumer so that you are paid to consume electricity. This is one of the reasons that my electricity costs are so low.

My electricity costs – Saturday 23rd May 2020

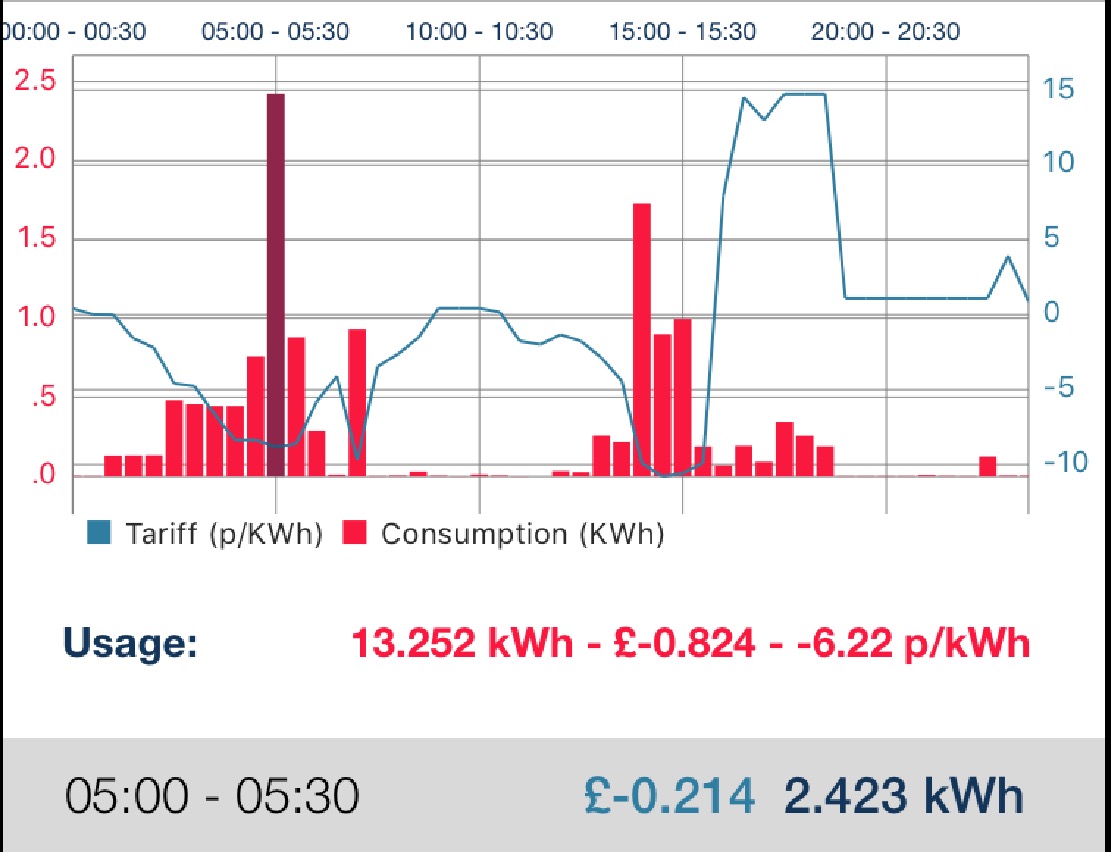
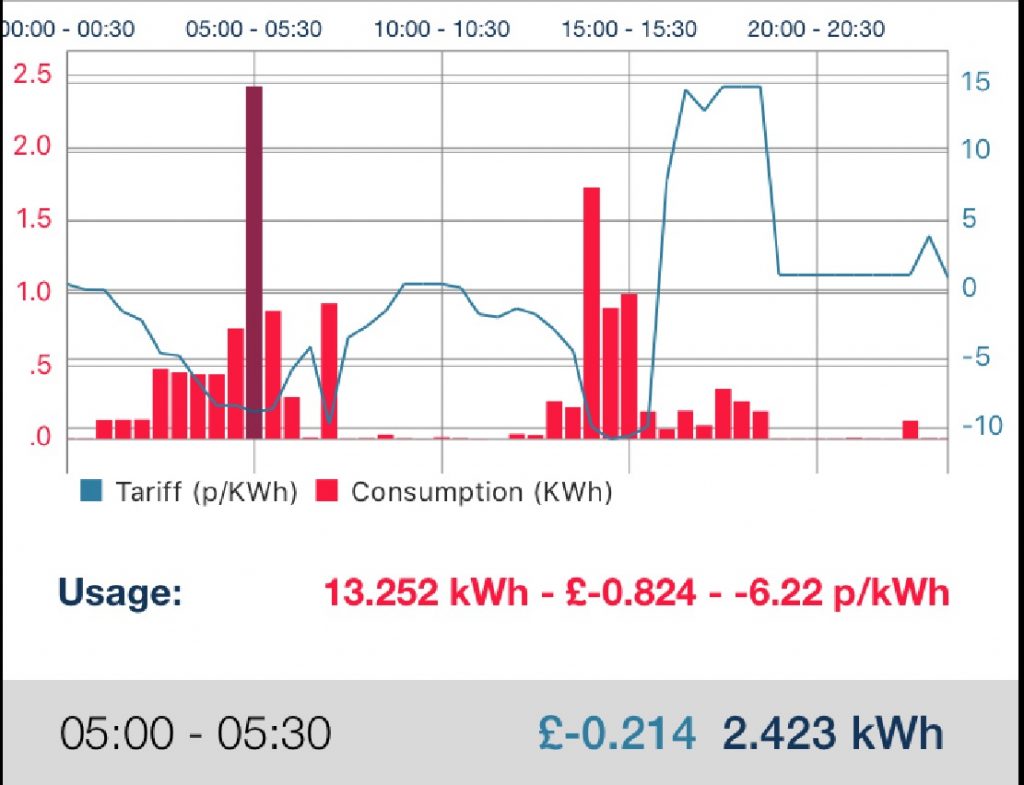
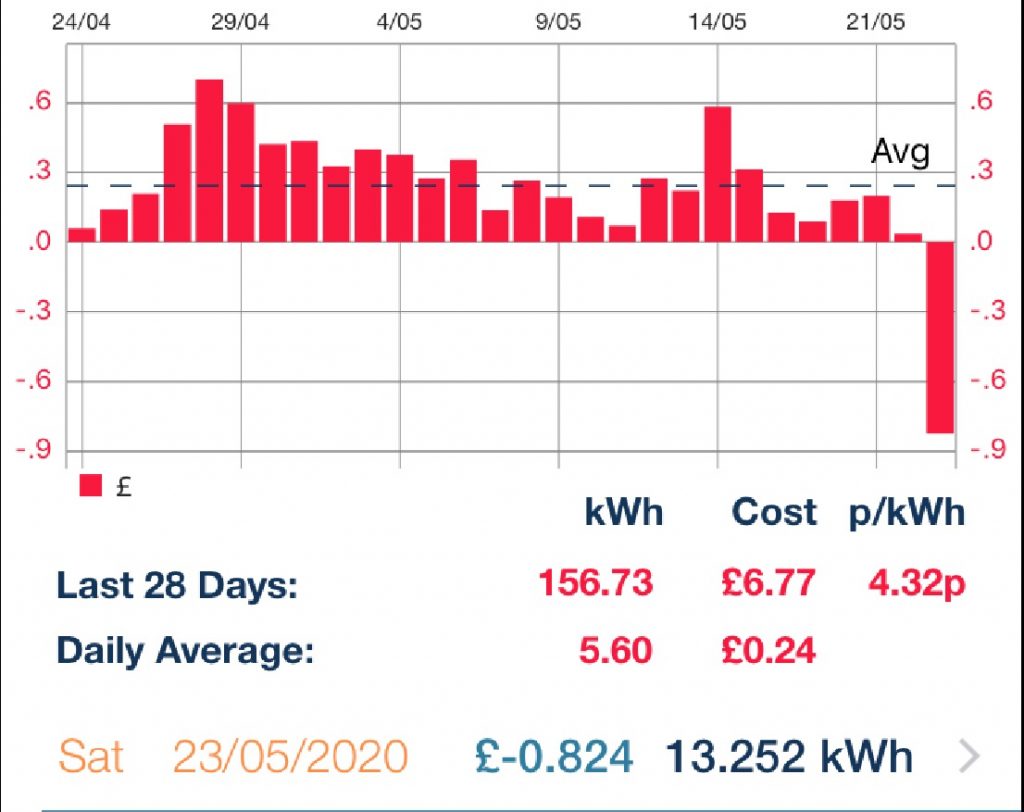
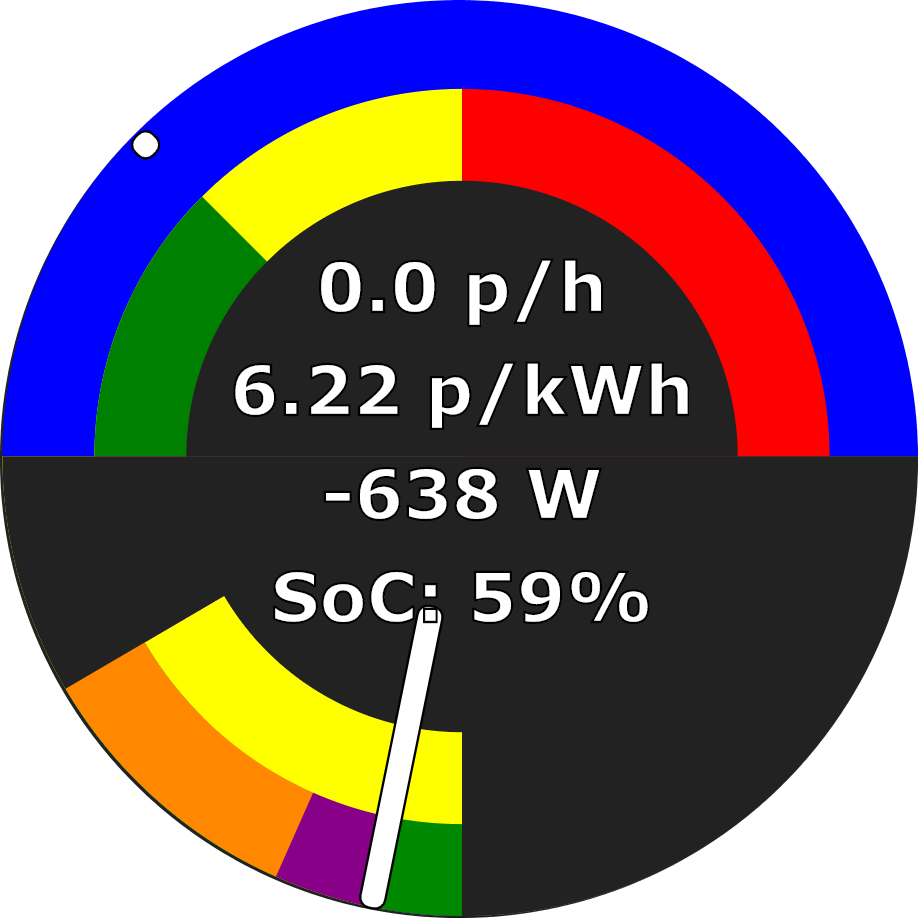
The above chart shows my electricity costs for Saturday 23rd May 2020. The blue line shows the half-hourly electricity price varying between minus 10 p/kWh and plus 15 p/kWh. The red bars show my electricity consumption in each half hour. You can see how consumption tends to be highest when the price is lowest leading to an average price paid of minus 6.22 p.kWh (i.e. they paid me to use electricity) – indeed they paid me 82.4 p to buy electricity that day.

Conventional export – paid to export

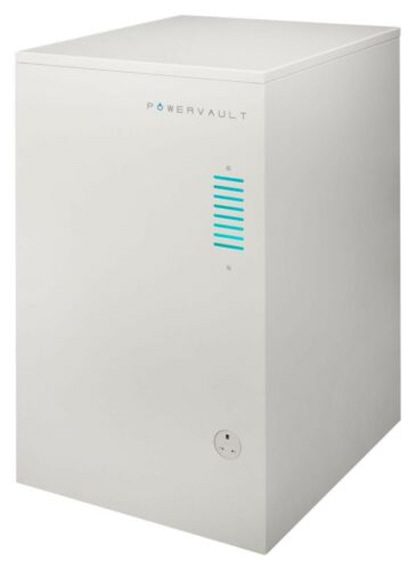
The next opportunity to make money from electricity is to sell it to the grid. Obviously that depends on having a source for the electricity typically a generating asset like solar panels or a wind turbine, possibly coupled with a storage device like a battery. It’s also possible with a battery alone, but I know no-one who does that as the economics are more challenging.

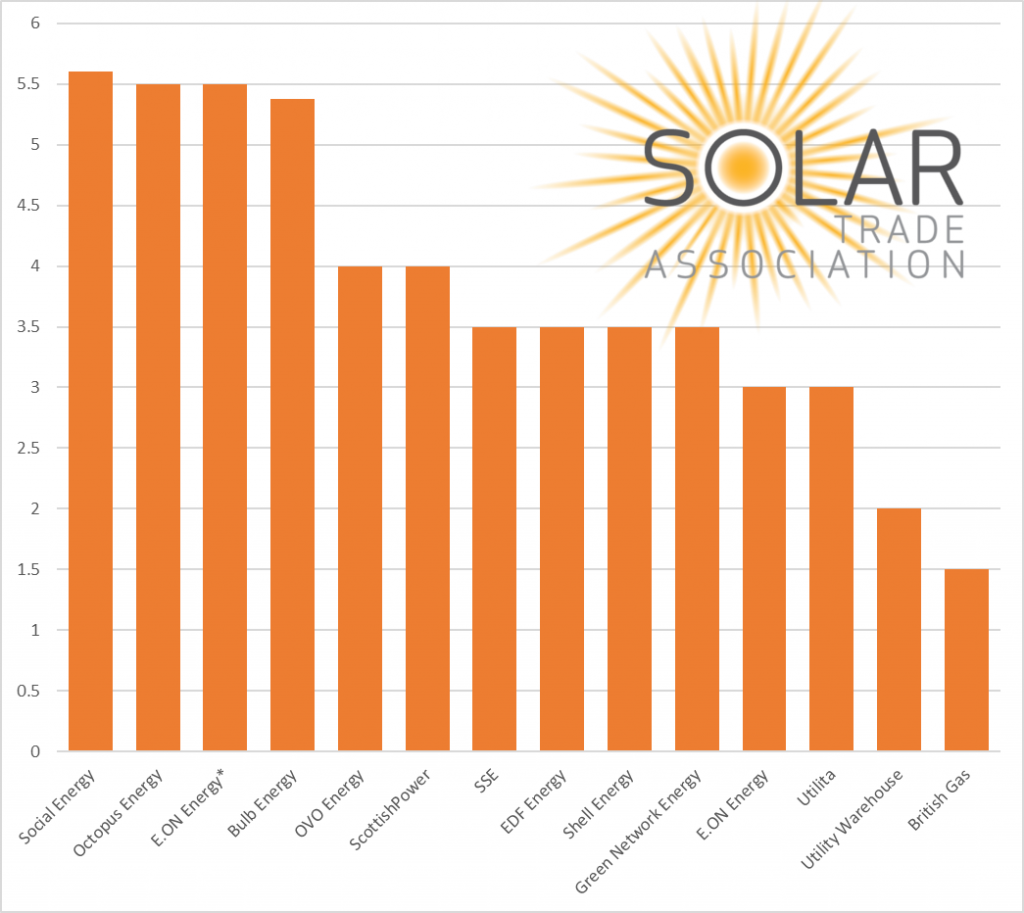
The UK currently has a scheme called Smart Export Guarantee (SEG) where you can sell your export to an electricity company. Prices vary enormously so it’s worth shopping around and not just assuming that your electricity company will give you a good offer.

SEG rates from the Solar Trade Association

There is also a smarter SEG option where Octopus offer a dynamic SEG based on market rates (Octopus Agile Export) which may at times offer a high rate, but also offers a lower rate at times, and is thus perhaps better suited to those with storage.

I myself am NOT on such a tariff as I’m on an older legacy Feed-in Tariff (FiT). Despite its name FiT is a generation incentive, not an export incentive. As a generation incentive FiT encourages self-consumption since each kWh that I consume myself does not reduce my income, whereas on SEG each kWh that I use myself (such as making hot water) would reduce export income. So, for example, if I use a kWh of electricity to make hot water that’s saved a kWh (or thereabouts) of gas at around 3 p/kWh, but if I was on SEG then I might have lost 5.5 p/kWh of export revenue to save 3 p/kWh on gas which is clearly an on-cost not a saving. There are other benefits of course because I’ve reduced my carbon footprint by using my own low CO2 electricity to replace a fossil fuel, but it’s not (in this case) improving my financial position.

A further area of research by others is V2X (V2H and V2G) – taking electricity stored in an electric vehicle and using that within the home (V2H) or exporting it to the grid (V2G).

Export penalty – penalised for export

A logical consequence of this smart grid that I’ve outlined is being penalised for export. If there are times when the market price for electricity is negative then if I were part of that market then I might expect to be penalised for export. This doesn’t actually exist in the UK, as the only model that links SEG payments to the market price, Octopus Agile Export, protects its customers from negative pricing.

Should consumers be exposed to this risk then a logical behaviours would be:

  1. To manage self-consumption into the negative export periods, and potentially thus increase export in the positive export periods. For example disable diversion to an immersion heater or car when export price is positive, and then maximise self-consumption when the export price (and presumably the import price also) is negative.
  2. To disable the generating asset to avoid the export penalty.

Conclusions

Some people like myself will find developments in the smart energy sector a fascinating and engaging topic with opportunities both the save money and engage in creating a cleaner and greener electricity system.

However given that many choose not to even participate in the competitive market for electricity supply created when the regional electricity companies were privatised in late 1990 (i.e. 30 years ago) then there will be a significant number who are not so motivated.

This then creates opportunity for a wider variety of smart offers. Some products, at the Agile Octopus end of the spectrum, giving the consumer the opportunity to benefit from their own decision making, while others look more like a traditional dumb tariff with a very simple price structure but potentially making the energy company a more active manager of the home appliances so that the consumer hopefully plays a lower unit rate while the energy company takes responsibility for managing the assets within the home.

Bright revisited

Back in late 2018 I purchased a Hildebrand Glow Stick Consumer Access Device (CAD) to monitor my electricity consumption. A CAD is a consumer device that can be paired with domestic smart meters to provide the consumer with a means of reading the meter. All UK smart meters are supplied with a dedicated in-home display (IHD) to display energy consumption, which is also an example of a CAD. The Glow Stick pairs with the meters like the IHD but shares the data to the cloud from where it can be read either via an app (Bright) or another device using APIs.

Glow Stick CAD

Each smart meter effectively has two interfaces – a Wide Area Network (WAN) connection used for metering and billing and a Home Area Network (HAN) used for connection between meters (electric and gas), hub (embedded within the electric meter) and IHD. The HAN is also available for smart home devices.

“Network hub“ including Glow Stick

“Network hub” including (from top to bottom):

  1. Network switch providing additional hardwired connections to the internet, placed behind..
  2. TalkTalk router providing WiFi and 4 hardwired connections to the external internet, placed above..
  3. Network storage, placed above..
  4. Immersun bridge (left) and Glow Stick (right and forwards)

When I initially installed the Glow Stick it provided a very useful tool to see current and historic energy consumption, but the equivalent cost displays were incorrect (at no fault of Hildebrand) because the CAD correctly read the meter costs, but the meter was not sufficiently sophisticated to store the complex Agile tariff (where unit cost changes every 30 minutes).

I recently learned that Hildebrand now had the ability to take the tariff directly from Octopus Energy via API, bypassing the incorrect tariff data in the meter. A quick support email to Hildebrand confirmed that this was not only possible, but also that the cost data would be corrected back to when I bought the Glow Stick back in 2018. A few days later and the conversion was complete.

These two views show today’s part-complete data:

The screenshot on the left shows today’s part-complete energy data. That on the right shows the equivalent cost data. Had the unit rate been constant throughout the day then the two profiles would have been proportional, but instead the screenshots show the magnifying impact of the higher unit rates in the four to seven PM window with equivalent consumption to the late afternoon resulting in rather higher costs.

I should emphasise however that my average unit rate is very low as I usually have much higher consumption in low cost periods than I do in high cost periods.

My electricity bill to May 2020

One of my recent electricity bills had an average of 3.49 p/kWh ex-VAT. Half-hourly rates varied between around minus 10 p/kWh (I.e. I was paid to use electricity) to plus 25 p/kWh. A low average price was achieved by shifting electricity consumption to when the price was lowest.

My next step is likely to be to use the API to get the real time household load for load management as an increasing number of electrical consumers (potentially a second car charger) risks overloading my supply fuse if all loads were on simultaneously.

Washing away any confusion

I previously described how I had integrated the washing machine into the smart home ecosystem using a smart plug so that it is (re-)started by the HEMS when the cost to complete a washing cycle will be lowest, bearing in mind that my electricity supply is a combination of paid-for electricity where the price varies each half hour and ‘free’ solar. As the means to get the best from the combination of washing machine and smart plug has been the source of some confusion within the household then I thought I would lay out how to get the best from that combination.

Bosch Washing Machine

Starting the cycle:

  1. Normally as found the smart plug should be on having been left on following the end of the prior load, but if not then turn the plug on using either (i) the button on the plug itself, (ii) the WIFIPLUG app or (iii) the Apple Home app.
  2. Load the drum in the normal manner which is optional washing liquid tab first with colour-catcher if required and clothes on top.
  3. Select and start the required cycle.
  4. Almost immediately stop the cycle on the smart plug using the same options as in #1.
  5. Put washing powder, fabric softener and water-treatment tablet (e.g. Calgon) in the drawer as required.
  6. At the optimum time the HEMS will restart the cycle. Do NOT move the cycle selector dial on the washing machine while waiting for the cycle to restart or the washing machine may become confused.
WIFIPLUG smart plug

Adding more clothes while waiting for step #6 above:

  1. Pull the drawer forward so that any water admitted to the washing machine will not take the contents of the drawer with it.
  2. Turn on the smart plug as per step #1 in the ‘Starting the cycle’ list – our washing machine starts to fill with water at this point.
  3. On our washing machine clothes may be added during the early stages of load by pushing the start button. Washing machine briefly displays “No” and then (i) stops the water flow, (ii) unlocks the door and (iii) displays “Yes”.
  4. Extra clothes may then be added.
  5. Once the extra clothes have been added, the door can be closed, the start button is pressed and then the washing cycle will resume.
  6. Stop the cycle almost immediately with the WIFIPLUG using any of the usual options.
  7. Close the drawer.
  8. At the optimum time the HEMS will restart the cycle.
Home

Ending the cycle is absolutely unchanged versus the washing machine without smart controls. The washing cycle finishes. The WIFIPLUG is left on by the HEMS. The door can be opened and the clean clothes dispositioned appropriately in the normal manner.

The dishwasher works similarly but more simply. The door can be opened at any time while awaiting the restart instruction from the HEMS and items removed or added as required.

Thoughts on intensity (of the CO2 variety)

CO2 production is increasingly of interest as the world struggles to limit man-made climate change. As we use different energy sources each represents a certainly amount of CO2 reflecting a combination of the energy invested to create that power source (e.g. the wind turbine may generate wholly renewable power, but its construction created some CO2) and the CO2 created as it generates energy once constructed (nothing for renewables but relatively high for fossil-fuelled generation).

I’ve previously shared this table showing the IPCC’s view of the embedded CO2 in different sources of electricity generation.

IPCC’s view of embedded CO2 in different sources of electricity generation

A recent question and resulting discussion in an on-line forum prompted me to think more about the area of embedded CO2.

My first observation would be that my rooftop solar panels do quite well on this scale with a CO2 figure of 41 gCO2/kWh.

The second observation would be regarding energy storage. My view would be that any energy storage device from a small scale domestic battery like my own to a large pump storage scheme can never deliver better embedded CO2 that the source of its energy. So, for example, if I charge my battery from my own solar at 41 gCO2/kWh with a cycle efficiency of 80% (the maker’s claim) then the embedded CO2 in the energy coming out of the battery cannot be better than 41 gCO2/kWh / 80% = 51 gCO2/kWh. Indeed it would be worse than that as this doesn’t account for the CO2 generated in creating the battery nor its operational life, but I don’t have figures for those.

Example of UK grid CO2 intensity

Thirdly, as my own embedded CO2 is relatively low whether exported directly from my panels or indirectly via the storage battery, then the CO2 intensity of the grid always benefits from my export. The 116 gCO2/kWh illustrated above is pretty low for the UK grid which varies widely but is still more than my solar PV directly or stored solar PV. Indeed had I exported onto the grid at the time illustrated above then my 41 gCO2/kWh versus the grid’s 116 gCO2/kWh would have saved 75 gCO2 for each kWh that I exported.

However if, for example, I export electricity but need to then buy more gas to make hot water then that too has a CO2 impact.

CO2 intensity of different fossil fuels (source: Volker Quaschning)

If I need to buy a kWh of gas to make hot water that’s 0.2 kgCO2/kWh or 200 gCO2/kWh even before I’ve accounted for the relative inefficiency of the gas boiler versus my electric immersion heater. If I assume that the gas boiler is 90% efficient then I will be responsible for 200 gCO2/kWh / 90% = 222 gCO2/kWh for a kWh used to make hot water. Thus, while exporting 1 kWh of solar PV may save the electricity grid 75 gCO2/kWh, it’s added 222 gCO2/kWh to gas consumption – a net deterioration of 147 gCO2/kWh.

Natural gas of course is the lowest CO2 of the fossil fuels listed above – if your home is heated by oil, coal or wood then the analysis is further skewed towards using your own self-generated power rather than exporting electricity and importing another fuel for heating.

The electricity grid’s carbon intensity also varies. In 2019 the UK average was 256 gCO2/kWh (a little higher than my estimate for gas) however this varies considerably through the year with the highest embedded CO2 in early winter evenings when I have little if any solar PV to contribute to the grid, and may well be lowest when I and others have surplus solar PV. My understanding is that the lowest grid CO2 occurs with a combination of high renewables (such as particularly windy weather) coupled with low demand (such as summer nights).

Thus my own strategy is to:

  1. Maximise self-consumption of my own solar PV as my energy source with the lowest embedded CO2 (except in the event of an extreme plunge pricing event when the grid is under highest stress)
  2. Make best use of storage to minimise consumption from the grid in the evening peaks when embedded CO2 is likely to be highest.
  3. When a solar-shortfall is anticipated then buy electricity selectively from the grid at lowest CO2 (using Agile electricity price as a surrogate for CO2).

Taking the plunge

For some time now my Home Energy Management System (HEMS) has been managing many of my domestic electricity consumers including:

  • car charging
  • dishwasher
  • home storage battery
  • washing machine
  • water heating via immersion heater
Domestic solar panels

The overarching strategy has been to:

  • maximise use of my own solar energy (rather than consume from the grid)
  • prioritise consumers for best value within the constraint of available solar generation
  • when power is needed from the grid to optimise the purchase price by shifting consumption to the cheapest periods (my price changes every half an hour)

For some consumers such as car charging and water heating this has resulted in those consumers switching between two modes:

  1. self-consumption when they are enabled to use the ‘free’ electricity from my own solar panels (subject to device prioritisation) with some proportional control
  2. boost when they run at full power drawing some if not all of the required power from the grid at the lowest available price

However the quite exceptional stress being put on the grid in the UK has prompted some expansion of capability. It’s normal once in a while that my electricity prices go negative, commonly caused by the overlap of large amounts of renewable electricity on the grid (e.g. excess solar output on sunny afternoons and/or high windfarm output due to wind conditions) and low demand (summer nights without heating demand, summer afternoons, bank holidays etc) which is exacerbated by the current corona situation. The current corona situation has made this more common and the plunge pricing events more extreme with multiple hours of negative pricing today some of which are into double digits (which I think is unprecedented). For car charging and water heating this has resulted in a new control mode.

The new control mode is a disabled status where the the device neither self-consumes nor is forced on. In the short term this increases export to the grid, but the mode is intended to help balance the grid disabling consumption for now to enable more consumption when the grid is under most extreme stress from an excess of generation over demand. Or to think of it another way, it passes up the opportunity to use free electricity now in order to be paid to use electricity later, responding to the price incentive to support balancing the grid.

Thus on a normal day these devices switch half-hourly between self-consumption (free electricity) and Boost (paid for electricity), but on a price plunge day then they switch half hourly between the new disabled state (no electricity, increased export) and the existing Boost (but now paid-to-consume electricity).

The full availability of modes is thus:

mode / otherabbreviationbattery storagecar chargerwater heating
Make and modelPowervault G200N/AImmersun v2
Control meansAPIRelayMixed API and relay
Mode – Boost++Powervault “Force charge”via HEMS relay (Ch 1)Via HEMs relay (Ch 2) to Immersun “External Boost” input.
Mode – Self-consumption only+Priority #1
Powervault “Charge only”
Priority #2
via Immersun relay output (Ch 3)
Priority #3
Immersun default behaviour
Mode -Disabled0N/A – Available in API but not used by HEMS.via HEMS relay (Ch 4)Immersun “Holiday” mode via API
Mode – Both self-consumption and self-discharge available+/-Powervault “Normal” via APIN/A – No reverse flow from car to home available (not V2X capable)N/A
Major device modes available to HEMS

We should thus be better equipped to support the grid in the current circumstances.

Import / Export at the smart meter for Saturday 23rd May

The chart above shows the resulting behaviour. In particular the large negative currents through the morning to early afternoon show that much of the normal self-consumption has been disabled. Then from mid-afternoon the import shows the effect of enabling multiple consumers simultaneously. Here the behaviour of the car charging and water heating was boosted as this point, while the dishwasher’s and washing machine’s existing behaviour added to load.

Not that it has anything to do with the revised controls, but the spikiness of the export during the day shows the highly variable nature of the export through the day being a function of both variable generation through passing clouds and variable consumption with kettle boils and the like. Thus it’s important that consumers for self-consumption have automated closed loop control since manual control of an immersion heater or car charger to achieve high self-consumption with minimal import would have been almost impossible even with a level of human intervention wholly at odds with the scale of savings achieved – small savings hour-by-hour add up over the day, weeks and months but their value is relatively tiny compared to the labour to attempt equivalent control manually.

Here is a similar import-only half-hourly view from the smart meter WAN side:

Half-hourly consumption and cost from smart meter WAN side.

The screenshot above clearly shows those periods of import being targeted at the periods with the most negative prices. Since different consumers need power for different periods of time (for example it takes about 7 hours to charge the battery, but only 2 or 3 for a tank of hot water) then consumption rises as cost falls. My consumption-weighted average cost was -6.22 p/kWh yesterday. However the same price point during the day or night has delivered different consumption from the grid as the output of the solar panels must be consumed before consumption from the grid starts. We are still some way from the point where it becomes economically attractive to disable the solar panels.

Daily electricity cost for 28 days (vertical scale is fractions of a pound)

Finally the above image shows the last 28 days of electricity average cost in p/kWh. Although some other days included some periods of negative pricing, the quite exceptional pricing yesterday is amply illustrated with the combination of extreme prices and the new load management mode delivering revenue (i.e. negative cost) of 82.4 pence through consumption of 13.252 kWh at an average 6.22 p/kWh.

This is something of a zero sum game in terms of consumption as I don’t artificially increase consumption to improve income – such as leaving the oven on with the door open during a summer day – this is all about shifting consumption that would have happened anyway. However we have not only supported the grid when it is most stressed but also reduced our energy costs significantly (to the point of being significantly negative) by moving consumption from being predominately self-consumption (i.e. from our own solar panels) to being predominantly grid consumption.

Monitoring the HEMS

For some time now I’ve been thinking about creating a real time display which pulls together data from a variety of sources around the home to provide an overview of what’s going on without the need to visit multiple web pages or apps. Until the last 10 days or so that involved little more than thoughts of how I might evolve the existing immersun web page with more content (I don’t have the skills to write my own app), but then about 10 days ago I saw an online gauge that someone else had created to show energy price and inspiration struck. Ten days later I have my monitor working, albeit not complete:

HEMS monitor

The monitor pulls together information from:

  • My electricity tariff for p/kWh
  • My immersun for power data (to/from: grid, solar, water, house)
  • My storage battery for power in/out and state of charge
  • My HEMS for electricity cost thresholds between different battery modes.

The gauge consists of two parts: (i) an upper electricity cost part and (ii) a lower power part.

The upper electricity cost part is effectively a big price gauge from 0 p/kWh to 25 p/kWh with a needle that moves each half hour as the price changes. It has various features:

  • The outer semi-circular ring (blue here) shows today’s relationship between battery mode and electricity price. Today is very sunny, so no electricity was bought from the grid to charge the battery, and this part is all blue for normal battery operation. If the days was duller and electricity was to be bought to charge the battery, then two further sectors would appear:
    1. a dark green sector from zero upwards showing the grid prices at which the battery would be force charged from the grid, and
    2. a light green sector showing when the battery is not permitted to discharge but may continue to charge from solar.
  • In inner semi-circular ring (green / yellow / red here) currently just colour-codes increasing electricity price, but will be used to show today’s prices at which car charging and water heating are triggered from the grid.
  • The current price per kWh is taken from Octopus’s price API, while the current cost per hour is derived both from this and the grid power from the immersun.
  • The needle grows from a simple dot indicating the price per kWh only when no power is drawn from the grid to a full needle when the electricity cost is 10 pence per hour or more.

The lower power part is effectively a power meter ranging from 5,000 Watts of export to the left to 5,000 Watts of import to the right. It updates every few seconds. It has various features:

  • The outer semi-circular ring (orange /maroon / green here) shows how power is being consumed:
    • orange – shows consumption by the house less specified loads
    • maroon – shows battery charging
    • blue (not shown) – shows water heating
    • green – shows export to the grid
  • The inner semi-circular ring (yellow here) shows the source of power. The sum of the sources should equal the sum of the consumers. The sources are:
    • maroon (not shown) – shows battery discharge
    • yellow – shows solar power
    • red (not shown) – shows grid power
  • The power value shows the net import or export from / to the grid, while SoC refers to the state of charge of the battery (0-100%). The combination of import power and electricity price gives the cost per hour in the top gauge.
  • The needle position shows net import (to the right) or next export (to the left). The needle should thus be to the left of the green sector, or to the right of the (unseen) red sector. Needle length show the full power being handled and is thus proportionate to the angle of the sector including all the colours in the lower gauge and extends from 0 to 5 kW.
Monitor installed on an old phone in the kitchen.

The gauge scales to fill the smallest of screen height or width and translates to be centrally positioned regardless of screen size. My intention is to display it on an old mobile phone as an energy monitor, but I can also access it on any web browser on any device within the home.

Octopus Agile Tariff

Much of the optimisation of my home exploits the cost-saving potential of the Octopus Agile electricity tariff. This tariff is a radical departure from a typical UK tariff. Rather than a fixed unit price that applies 24/7, the Agile tariff exploits the smart meter to provide up to 48 different half-hourly prices per day which change day-to-day according to a formula linked to daily electricity auctions in an absolutely transparent manner.

Octopus’ transparent pricing

The prices can vary from several pence per kWh negative (i.e. being paid to use electricity) to a cap at 35 p/kWh which might apply in the early evening. That therefore places a some risk on the consumer, but equally can provide significant benefit. There are regional differences in the equation reflecting variation in the costs to distribute electricity in different parts of the country, so your formula might not be exactly the same as mine, but will be very similar.

Agile bill summary for two months ending mid-April 2020.

That average 5.02 p/kWh is not just competitive versus other tariffs – it tramples all over them. Personally I’m continually plagued by advertising claiming to save me £100s versus existing tariffs, but none ever comes remotely close to this rate. Thus, with my consumption pattern, I think that this is an unrivalled tariff. The Energy Saving Trust has calculated the average UK electricity cost at 15.75 p/kWh as at March 2019 (their latest analysis at the time of writing), so I’m currently paying a third of that average rate.

Of course you won’t ever see this tariff recommended on a switching website. Indeed, I’ve never seen any smart tariff recommended on a switching website, because they only ever seem to offer the choice between flat rate tariffs and Economy 7. In my opinion the lack of smart tariffs always denies consumers access to what may genuinely be the cheapest tariff for them by short term switches between tariffs that are pretty much alike. Those switching sites don’t want consumers to find long-term value, instead they want consumers to keep switching so that they keep earning commission.

However for me, not only have Octopus demonstrated long-term value, but they provide 100% renewable power, and are the only electricity company to be Which? recommended for 3 consecutive years. For you there’s a further £50 to be saved if you click on the image below and sign-up for any one of Octopus’ tariffs.

Octopus referral

Washing on sunshine

As regular readers will recall I’ve recently updated my battery controls with solar predication. For some years now my battery storage has automatically charged during sunshine and later discharged in the evening, and over the last year I added the HEMS to manage buying electricity including for the battery when the electricity cost was cheapest as there’s little solar in the winter, but now the HEMS has the ability to automatically adjust how much power is bought from the grid depending on how much output is expected from the solar panels in order to deliver a charged battery by the end of the day when the electricity price rises significantly. The battery charging can thus swing from all solar to all grid and all points in between entirely automatically based on the solar forecast.

Predicted solar output for March 16th to 18th as of the evening of March 15th.

Now however I’ve also added the capability to adjust when the wet goods – dishwasher and washing machine – run as a function of expected solar panel output.

As with the battery controls, I don’t attempt to match generation half hour by half hour with device operation because of uncertainty around how precisely a solar forecast from the evening before will match actual solar production up to twelve hours later. Instead my solar algorithm extracts the number of hours of significant solar production and the earliest start time of that production. For the battery that information is used to modify the number of hours of battery charging to be bought from the grid and the end of the window during which those hours of charging may be bought. Now I’ve updated the controls for the wet goods similarly.

The existing wet good controls look to start the machine at the time when the electricity cost for the cycle is cheapest within a time window set by the user, so the user defines the earliest and latest acceptable start times and the algorithm finds the cheapest start time within that window. The updated wet goods controls assess the number of hours of solar charging available and if both (i) the window exceeds a certain size and (ii) the user’s time window includes the solar window then the user window is narrowed to start at the start of the solar window. The resulting start time between the start of the solar window and the end of the user window may not be absolutely the cheapest grid cost but my assumption is that the solar contribution (which could be up to 100%) will in practice make this the cheapest grid cost as any power needed from the grid will be at a relatively good price. If this start time in the solar window does not reflect absolutely the cheapest grid cost then a second start time may also be identified which is the cheapest grid cost.

HEMS schedule with start times for wet goods within the solar window.

In the above example the start times are both within the solar window and the cheapest energy price, so no cheaper alternative is also offered. Start times within the solar window tend to be in the afternoon as the grid energy costs are lower. This also improves the probability that the battery may briefly discharge if the total load exceeds the solar output. However in the above example the energy price is so low that the battery is also force-charging (it’s dark green) so any surplus demand will come from the grid.

HEMS schedule with start times both inside and outside the solar window

In the above example the cheapest time to run each cycle from the grid is at night, although given the availability of solar during the day then any small saving in grid costs at night is very likely wiped out by the ability to run some (if not all) of the cycle during the day from the solar surplus rather than the grid. Both start times are available – the absolutely lowest grid cost and the lowest grid cost during the solar window.

It’s probably also worth mentioning the implications of running the appliance alongside the battery status being different colours:

  • Blue battery and state of charge being at or over 80% – appliance is prioritised over battery allowing battery to discharge to meet appliance needs as required – least likely to draw anything from grid (but likely highest cost to draw from grid)
  • Light green battery or (blue battery and state of charge being below 80%) – appliance is prioritised over battery charging alone (so battery may not discharge to support appliance) – a little more likely to draw anything from grid (but likely mid cost to draw from grid)
  • Dark green battery – battery charging and appliance are equal priority – most likely to draw something from grid (but likely cheapest cost to draw from grid, even to the point of being paid to draw from grid at times)

What happens without internet?

Today we are increasingly reliant upon the internet. During the current crisis when many are confined to home the internet provides opportunities unimaged to previous generations. Whether it’s online shipping, entertainment, using zoom or other online meeting tools to maintain family, society or church connections; the internet provides the means to supply us with our material needs, entertainment and social contacts in ways unimagined previously.

However our home, and other smart homes, may be particularly vulnerable should the internet become unavailable either in general or a particular service upon which we rely becomes unavailable. I thus thought that for this post I’d reflect upon the services our home relies upon for normal operation and what the impact of their absence would be. I will also reflected upon other failures of the service where such failures have been previously observed.

HEMS schedule for 11-12/04/2020
ServiceEffect if unreachableeffect of other observed failure
Solar forecastingIn unreachable when daily schedule being generated then schedule assumes no solar production like mid-winter.On April 7th I observed several hours around the middle of the day when there were no forecasted or estimated actuals reported, but the service continued to accept our measured readings. No impact on HEMS operation.
Agile electricity price data.If unreachable when daily schedule being generated then schedule carries over from prior. Schedule may be generated by manual initiation of the script when the required data becomes available.
If necessary operation of the car charger PLC could be suspended causing the car to charge at full power immediately and the car’s own timer used to set operating hours if needed.
If tomorrow’s price data is not yet published (i.e. it’s overdue), then the optimisation is performed using the most recent day’s price data. Since today will no longer be within the dataset provided by the solar forecast (as it’s no longer in the future) then no solar window will be found and so all the required number of hours will be bought assuming today’s (not tomorrow’s) prices, so the battery will still be charged but at a sub-optimal cost. The optimisation can be started manually once the overdue pricing data is available.
Immersun APIIf the real time generation data wasn’t available at all then solar car charging would be disabled. Car charging based on bought electricity price would continue.I have observed occasions when the real time data ceases to be updated (presumably because communications between immersun and cloud is lost) which then throws out the upload to the solar forecasting and the disabling of solar car charging at low generation levels. The forecasting site doesn’t seem to be phased by some erroneous data having never yet dropped below 0.96 correlation. The solar car charging has once been enabled later than it should which had some impact on battery state of charge, but was disabled slightly later via the immersun relay output.
An API is also used to switch the immersun into or out of holiday mode on days with significant periods of negatively-priced electricity. Unavailability of the API could leave the immersun locked in holiday mode and thus completely unable to heat water, or not in holiday mode when it should be causing self-consumption to continue when export would be more optimal to allow for negatively-priced import later. Vacation mode may be enabled or disabled manually via the immersun’s front panel to mitigate.
Powervault APILack of availability of the API would disable the ability to switch operating modes. This would leave the Powervault either charging from solar only or force charging, and may or may not permit discharge. The unit can be reset to normal state via repeated operation of front panel button which would disable scheduling but provide default solar operation.
WIFIPLUG APILack of availability would prevent the wet goods being turned on via API. Operation via the bushputton on the plug and indeed via Apple Homekit should remain.
Apple HomekitThe heating and other automations are run from Apple Homekit. My understanding is that the local service is provided from the two Apple TVs acting as hubs which should continue. Remote access via devices not in the home would be disabled.
Hildebrand APII have access to an API giving data from the HAN side of my smart meter and independent current measurement, but this is not currently used for control so no operational impact.
Impact assessment for loss of different cloud services

Overall I would conclude that there’s no significant issue here. The house would continue to be heated and appliances will still work. Any impact would be around energy consumption and cost only.

Some mitigation could be arrived at by:

  • resetting the Powervault storage battery to restore default normal operation,
  • manually starting or stopping vacation mode on the immersun’s front panel, and
  • suspending operation of the PLC on the car charger to enable car charging.

Tuning up for the performance

Last night rather unexpectedly my solcast solar irradiance data tuned itself. I use this data to predict the output of my solar panels and adjust what I buy from the grid in response. I had expected that tuning would happen eventually, but my understanding was that two month’s data was required, not the two week’s data that I had so far supplied.

Prior to tuning my predictions had looked like this..

solcast predictions before tuning

Although the system is clearly predicting output to a reasonable degree of accuracy, there are two obvious issues:

  1. The orientation of the array from due south seems a little off, as my array starts and ends generation earlier than the prediction suggesting the the orientation should be slightly more easterly in the model.
  2. The peak at a sustained 4 kW is overly optimistic. The panels can generate 4 kW according to my monitoring, but only relatively briefly and certainly not for more than an hour in March.

Nevertheless, the overall identification of better and worse days is clearly working.

solcast predictions after tuning

However after tuning both issues have been resolved. The measured and predicted curves match very closely. Note that the prior predictions have been updated by the tuning process, so March 26th which is included in both the images looks subtly different. Note also that my control is based on forecasts from the evening before, not the ‘1 hour ahead forecasts’ illustrated above. You may also observe that there is a discrepancy in the morning of April first, where the measured data is zero while the estimated actuals and forecasts are quite healthy, which arises as a result of a temporary failure of the immersun server from where the data is taken.

The ability to do tuning requires an upload of data. I upload generation data continuously at 5-minute intervals (the shortest allowed interval) which may explain the early availability of the tuned results. The script that I use to achieve this takes data indirectly from my ImmerSUN and is modified from this script. I achieved a 99% correlation which is pretty good. Subsequently it seems that the tuning takes place automatically each day.