Category Archives: Electricity storage

Battery Storage Configuration for the Smart Tariff

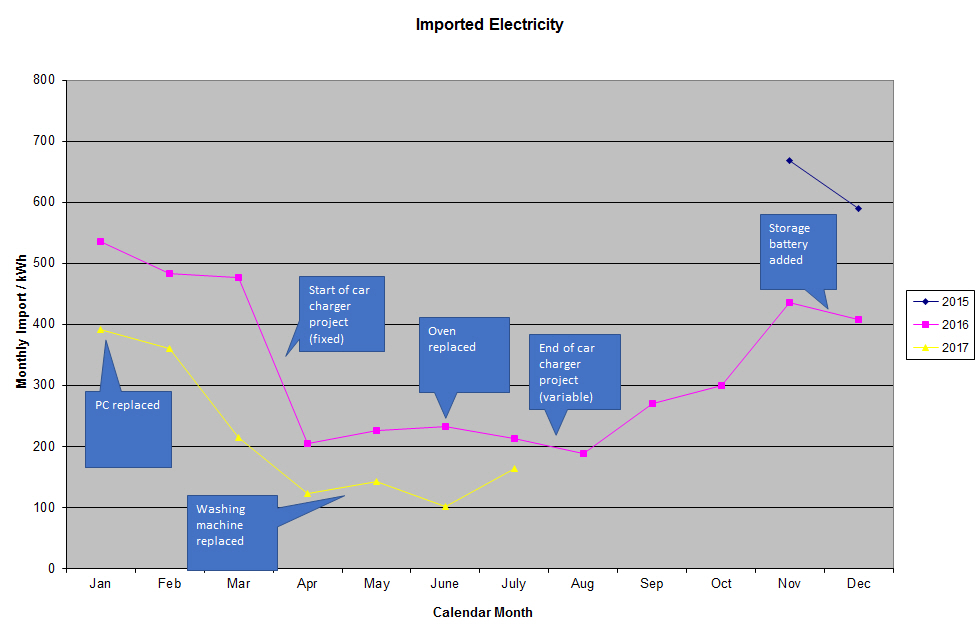
Today I’ve been thinking about configuring the Powevault storage system around my smart electricity tariff in which costs can vary every half hour.

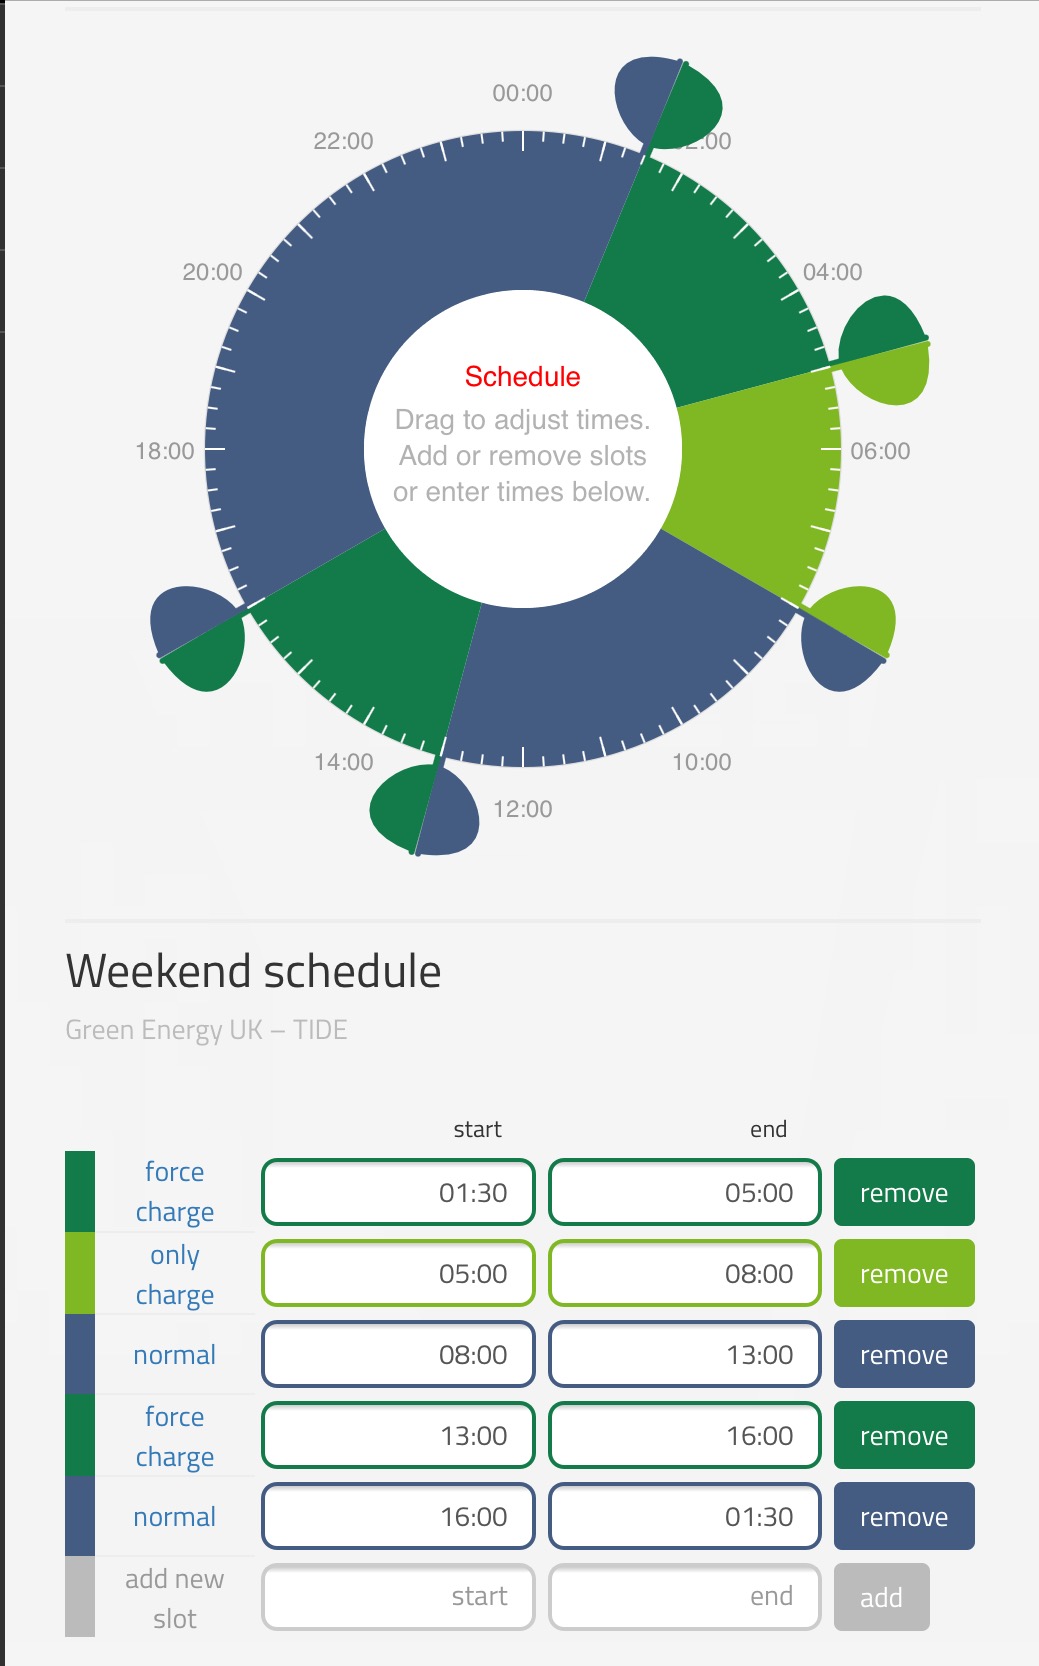
My battery has an ability to be configured around a tariff called TIDE. I don’t have TIDE, but the ability to configure around TIDE can be reused for my tariff. The unit can be configured using a table or the clock as illustrated. There are several sections:

  1. Force charge – the battery storage charges at its maximum power (only 800 Watts) for 3.5 hours while electricity is cheapest.
  2. Charge only – a period while electricity is not quite so cheap when the battery will charge proportionally to any solar surplus, but will not discharge.  It wouldn’t make sense to start discharging the battery when electricity is only marginally more expensive than when the battery was charged.  This also prevents the battery discharging into my electric car if the car charges for a longer period than the battery.
  3. Normal – storage system will either charge proportionally to solar surplus, or discharge to minimise input.
  4. Force charge – as previously charges at maximum power in this case to ensure that some power is stored prior to the most expensive period.
  5. Normal – as previously but intended to cover the peak rate 4:00 to 7:00 PM period and beyond if there’s still stored energy.

Now that this pattern has been created, it can be adjusted by dragging the tabs around clock to adjust for when the cheapest power is at a different time day-to-day.

In the longer term I hope to automate such adjustment, although my priority is getting the car charger to automatically operate when power is cheapest.

Electricity Purchase to July 2018

In the last few days I’ve reported our status on electricity generation from our solar panels and our gas consumption, so here comes some thoughts on electricity purchase from the grid.

Starting in late 2015 after the meter was changed to Economy 7, there’s a general downward trend from November 2015 to March 2016, before my car charger project kicks in maximising use of my own solar electricity to charge my car (when available) which causes a significant drop in purchased electricity between march and April 2016.  That seasonal saving gradually drops through the autumn, although it’s interesting that by November 2016 we’re back on what seems to be a continuation of a downward trend from January to March 2016.  Electricity purchased is also significantly lower than 2015 as we enter the second year.

The second significant change is the addition of the storage battery in December 2016.  However from January to August 2017 (yellow) electricity purchased is significantly below the prior year (magenta) – potentially showing the benefit of the battery in saving electricity generated during the day to reduce consumption later in the day.  This benefit largely disappears from September to December 2017, presumably because my increased vehicle mileage after my daughter started school is offsetting the prior savings.

2018 (orange) generally falls somewhere between 2016 and 2017 as it combines both the storage battery and the higher vehicle mileage throughout the year to date.

The August 2018 figure is a projection based on the first few days of the month only, but may yet come to represent the month as a whole being a function of:  (i) record solar outputs, (ii) continuing battery storage availability, and (ii) no school in August leading to reduced mileage.

Mid-year thoughts

Summer is definitely upon us now as we enjoy the glorious summer weather.  Disappointing weather earlier in 2018 has given way to two record months in May and June which yielded the highest monthly outputs for their respective months since the system was installed back in 2015.  Some days we buy no measurable electricity or gas  (given that the electricity meter has a resolution of 1 kWh) depending on what the need to charge the car.  If the car is at home then I can fully charge it from the solar panels, whereas if the car is at away from home during the day then I may need to give it some charge overnight.  When charging overnight I have been tending to charge for the minimum number of hours up to 7:30 AM when I typically leave home on a weekday – that pattern provides for mostly Economy 7 Energy from the grid less whatever comes off the solar panels from the rising sun less whatever might be left in the PowerVault from the previous day as illustrated below:
The green ‘hill’ from around 3:30 to 7:30 AM is created by car charging.  Normally this would be seen as a rectangular block as the car charger effectively runs at a constant 10 Amps (2.3 kW) through the operating period.  However in the illustration the charging event (at least in terms of power drawn from the grid) seems rounded at both the beginning and the end.  At the beginning of the car charging period the mustard ‘Device Power Out’ curve shows the last remaining stored energy from yesterday being drawn from the PowerVault, while at the end of the charging period the ramp down is a result of increasing output from the solar panels reducing the need for power from the grid.  Hence at the moment the car charging ends there’s a sudden switch to charging the PowerVault at full power (the blue line) and some surplus power not used by the PowerVault (the purple line) – suggesting that something around 1 kW is suddenly available.  Although the purple line is described as ‘Grid Power Out’ that’s not strictly true here as much of that surplus is being diverted to make hot water (although this is invisible to the PowerVault).

After that digression, my actual purpose in making this post was to reflect upon relative energy costs and the best use of my solar power to reduce energy cost.

Energy usagePetrolDaytime ElectricityNighttime ElectricityGasSolar Electricity
Battery Storagen/an/a - no economic case to charge battery from grid during dayOptional - need to consider value of saved energy versus cost of 1 cycle of battery cycle-lifen/aSelf-use Priority #1 via PowerVault (daytime electricity -> solar)
Car ChargingManual 3rd backup (typically only used for long journeys when charging en-route becomes impractical) Manual 2nd back-upAutomated 1st backupn/aSelf-use Priority #2 via ImmerSUN (nighttime electricity -> solar)
Water Heatingn/aManual 3rd backup (never used in 3 years)Manual 2nd backup (never used in 3 years)Automated 1st backup for dull daysSelf-use Priority #3 via ImmerSUN (gas to solar)
Space Heatingn/aManual backupManual backupDefaultn/a - a summer solar surplus is a poor match to winter heating demand but could be Priority #4

 
The table above shows columns of energy sources ordered by reverse energy cost versus the major energy consumers in the house: battery storage, car charging, space heating and water heating. Energy consumers are ranked according to the value of displacing the the alternative energy course if not solar:

  1. Battery storage – I currently only charge the battery storage from solar, although there would be a seasonal economic argument to charge from cheap rate electricity if the differential between day and night rates was higher.
  2. Car charging – I generally charge on cheap night-rate electricity when I don’t have enough solar. In summer I program my car charger via the ImmerSUN’s 7-day timer to deliver sufficient charge for the day ahead, but sufficient headroom to make use of any available solar.
  3. Water heating – water heating is my 3rd priority for solar self-use and is automatically based up by the gas boiler which runs for an hour making hot water in the early evening if the tank isn’t already hot from diverted solar power during the day. The gas thermostat is also set slightly colder than the immersion heater – still very usable for a bath or shower from gas but giving some ability to delay water heating from a dull day to a following sunny day.
  4. Space heating – my space heating is generally gas. It would be possible to run a heater (or heaters) such as storage radiators via the ImmerSUN’s third output, but I consider that the cost of the heater(s) and installation is unlikely to be recouped given the major mismatch between surplus solar generally being in summer and heat demand being in winter.

Clamp orientation for ImmerSUN and PowerVault

In the last few days I’ve been assisting a reader of this blog who also has an ImmerSUN immersion heater controller plus PowerVault storage battery combination.  Like me, he had the immerSUN first and later added a PowerVault, but had immediately disabled the ImmerSUN to get the PowerVault to work.  Left to their own devices, the ImmerSUN will normally take the surplus power first before the PowerVault has chance to respond since it has a more dynamic control system, however economically it makes more sense to prioritise the PowerVault.

I previously posted on this topic in Prioritising smart loads for self-consumption but wanted to provide more clarity on the orientation of the clamps.

Both ImmerSUN and PowerVault rely on current clamps to get their control signal. Such clamps fit around an electrical cable and measure the flow of electricity through that cable.  Normally clamps for both these devices alone would be around the live in the incoming mains cable, but do that with both and the ImmerSUN will always take the available power first which is undesireable.

The illustration shows my solution, as per the prior post, where the PowerVault clamp surrounds both the incoming live and the live output to the immersion heater.  If the clamps are correctly orientated, this allows the PowerVault storage battery to be prioritised over the ImmerSUN immersion heater controller.  When the PowerVault clamp surrounds the two cables, it is important that outgoing power to the grid and outgoing power to the immersion heater from the consumer unit pass through the clamp in the same direction.  This solution should work for clamp-driven solutions too.

The PowerVault clamp is directional – it has an arrow which should point towards the consumer unit.  That means, if you pair the two cables as I described, so outgoing power flows in the same direction in both cables through the clamp, then the arrow should point in the opposite direction i.e. towards the consumer unit.

Fundamentally it doesn’t matter which way the ImmerSUN clamp faces, as during commissioning the ImmerSUN will work it out by cycling the power several times, but you shouldn’t change it after commissioning.

Daytime charging as quickly as possible

On Wednesday an unusual pattern of vehicle use occurred (at least for me) which showed another way the charger could be used. I needed to take my daughter on a round trip in the morning (dad’s taxi), return home, and then repeat the trip later in the afternoon. Each round trip pretty much exhausted the range of my electric car, so I needed to recharge in between. My normal home charge routine would have prioritised the home storage battery, but that would have left me completing the second round trip partially on petrol which isn’t the optimum solution.

To fully recharge the vehicle to complete the second round trip (and thus avoid using petrol) I disabled the programmable logic controller (PLC) on the car charger using a push button which suspends the program causing the charger to operate at full power. It was a sunny day (at least for March) so the solar panels were producing a similar amount of power to that required to charge the car and, with the fixed battery partially charged during the period I was making the first round trip, the fixed battery was able to manage the difference between power generated by the panels and that required by the home (including car charging) for much of the period.

The result was an almost fully charged car for the second round trip (sufficient to avoid using petrol) for only around 1kWh of grid energy.

Solar PV Installation – 2 years on

The end of 2017 sees 2 full calendar years of output completed (plus a few months at the end of the prior year) so it seemed like a good time to assess performance and return.  Return comprises two parts – firstly the payments received for electricity generation (and export) the so-called feed-in tariff or FiT and secondly the savings obtained from using that free energy myself instead of buying it from the grid.  In my case I can use and store my solar electricity directly, or use it to heat water via the immersion heater thus replacing gas.

I’ve summarised the status in the following table:

Nominal20162017
Generated366840564033kWh
FIT£629.36£639.61
Electricity self-use50%41%64%of Generated
183416632596kWh
£159.65£251.12
Gas replacement27%23%of Generated
1095941kWh
£41.20£27.66
Export50%32%12%of Generated
Return in calendar year£830.46£918.40
13.6%15.1%of PV cost
Return cumulative£830.46£1748.86
13.6%28.7%of PV cost

Summary:

  • Output from the panels was slightly reduced in 2017 versus 2016, but still significantly above the performance projected in the quotation.  I put the slight reduction down to year-to-year differences in the weather.  Over time I would expect panel output to decline, but I think it’s too soon to attribute any decline to this.
  • Income from FIT was slightly higher as inflation on the price / kWh has overcome the slight output reduction.
  • Electricity self-use is up considerably from 41% to 64% due to my 4 kWh storage battery.  The costs of that battery are not reflected in the table.  Return would have been 8.8% in 2017 (rather than 15.1%) if the cost of the battery was included.
  • Gas replacement is down from 27 to 23% versus 2016 as more of the electricity from the panels is used for high value activities like charging the storage battery or my electric car, and less is left over for water heating.  The low price of gas per kWh makes gas replacement my lowest priority for self-use.
  • Exported electricity (i.e. what’s left-over that I cannot use myself) is considerably reduced from 32 to 12% largely as a result of increased electricity self-use.
  • Financial return in calendar year 2017 is improved from 13.6 to 15.1% neglecting the costs of the battery, or reduced from 15.1 to 8.8% taking into account capital costs of the battery.
  • It will take approximately 7 years (i.e. 2 past + 5 future years) for the combination of the solar panels and battery storage to pay for the solar panels (neglecting the battery costs), and a further 2 years of system savings to pay for the storage battery.

Here’s a little Tonik..


Today my energy supplier Tonik wrote to me inviting me to consider solar panels, a car charger, or a storage battery – all of which I already have.  However on their website I found a wider vision of the future home which they thought could halve energy consumption. I thought it would be interesting to compare their vision with my status.

As you can see from the table below the content is quite similar, although I have more ambitious use of solar and more sophisticated smart heating management.

Tonik's VisionMy Q3 2017 statusMy Q3 2019 status
Switch to Tonik for lowest cost renewable electricity.Done.Now with Octopus
Smart meterWaiting on TonikSupplied via Octopus
Connected thermostat (whole of house device)Connected thermostats (individual room temperatures and schedules)
LED bulbsDone.
Smart tariffWithout a smart meter on nearest equivalent (Economy 7)Agile Octopus dynamic smart tariff.
Solar PV Done.
Battery storage.Done.
-Surplus solar electricity diverted to charge electric car.
-Surplus solar electricity diverted to heat water.

Battery storage – the first 6 months

I’ve now completed 6 calendar months with the battery storage system.  Those six months cover January – June so might be considered representative of the year as a whole.  I have real-time monitoring of solar panel output and house consumption / export so I have clear visibility that the battery is working and storing energy, and then discharging energy through the evening as I see the house with near zero electricity consumption sometimes through into the early hours of the morning (less if we’ve cooked our evening meal on electricity).  So, environmentally it’s doing its stuff, but what is it saving financially?

There are at least three ways to assess that, so let’s see how they look.

Firstly, from the capacity of the battery (4 kWh), and assuming that it’s filled daily one can calculate a benefit.  That benefit would tend to overestimate benefit in winter when there may not be enough energy to fill the battery, but equally could understate saving some days when the battery goes through repeated periods of charging and discharging during the day.  One could imagine the heating cycle of the dishwasher, for example, perhaps causing some discharge of the battery during the day if the washing machine load isn’t met from the solar panels, but then then re-charging before the evening and thus its daily throughput being higher than it’s capacity as some of that capacity is used more than once per day.

So, if the battery stores 4 kWh and there are 365 days in a year where each kWh not bought is worth 11.5 p/kWh then the saving might be 4 kWh/day x 365 days/year x 11.5 p/kWh =  £167.90.

Secondly, let’s look at electricity savings.   If I compare the first 6 months of 2017 (with a battery) to the first 6 months of 2016 (without a battery) then electricity purchase has reduced by 824 kWh (38%).  Thus the saving could be 824 kWh/six-months x 2 six-months/year x 11.5 p/kWh =  £189.52.

Of course, as my chart shows, there are other changes that potentially impact electricity use between those 2 time periods, so that might be an overestimate.

The third and final way that I’ve analysed this is to look at the data about how the output of the solar panels has been used.  In 2016 I used 44% of the output of the panels to replace bought electricity, and a further 28% of output to replace gas consumption.  In the first half of 2017 however I used 63% of the output of the panel to replace bought electricity, but only 24% of output to replace gas consumption.  The reduction in use for water heating reflects the prioritisation of the battery over water heating as a kWh of electricity purchase avoided is much more valuable than a kWh of gas purchase avoided.  Against 2016’s full year generation of 4,192 kWh that gives a saving of only £87.84 which is much the lowest of the 3 figures.  However this only accounts for more efficient use of the solar panel output, and not winter savings from shifting energy purchase from day to night time when it’s cheaper.

Whether any of these figures represents a saving over the life of the storage system entirely depends on the lifetime of the system, the life of the batteries inside it, and the replacement costs of those batteries

Battery profile through the day

January 5th was a good day to demonstrate the battery’s contribution to the home on a day on which 9.75 kWh was generated. The battery at this point in the year is configured to charge on cheap overnight electricity as well as store excess PV electricity (when there is any). The day also included evidence of water heating and car charging after I returned home at lunchtime.

Over all only 2 kWh of power was purchased during the day at full price, while 12 kWh of cheap night time electricity ran the dishwasher and washing machine, did some car charging (I charge for an hour which leaves headroom for later solar charging), and contributed 5 kWh to charging the fixed battery.

During the relatively sunny December day, as PV output rises, the battery starts to recharge and then, once the battery is charging at its maximum rate, remaining PV output is used to heat water (although described as ‘Grid Power Out’ in the chart above).  At around 12:30 I arrived home and put the car on charge (the blue spikes) and made lunch (the brown spikes).  The blue spikes of car charging occur as the chargers turn off intermittently to allow available power to be assessed.  As PV output falls EV charging starts to require limited support from the battery (the rising brown line through the blue spikes) until eventually all EV charging stops and the system returns to a combination of battery charging and water heating.

As the sun sets the brown line rises again as the battery takes on the load of the house. Green spikes indicate boiling the kettle before 18:00, cooking dinner from shortly after 19:00, and a further kettle boil at around 23:00.  Apart from these import events totalling less than 2 kWh, the house continues running on stored energy from the battery through into the next day when the cycle restarts.

At some point I assume that it will be necessary to curtail the overnight charging of the battery so that it doesn’t miss out on day time charging from PV as a result of being full. That may be responsible for some of the blue cycling with the car charging associated with the rising brown line – if the battery is already full then the car charger will be enabled at lower levels of power generation potentially causing the battery to partially support the car charging.

Battery capacity

As you may recall my storage battery has a usable storage capacity of 4 kWh which, with the quoted round trip efficiency of 80%, would mean it takes in 5 kWh of energy to make 4 kWh available for output later.

We’ve been away for a couple of days, leaving the house drawing a low amount of power in our absence, however yesterday the battery reports having discharged 5.9 kWh despite its 4kWh capacity.

I’ve already had some days when throughput was greater than capacity, but that’s generally been when the battery charged fully overnight and then partially recharged from solar PV during the day. However this was not the case yesterday where, although there’s a dip in demand associated with limited daytime generation on a dull winter’s day, there’s no evidence of battery charging.

There is a characteristic of battery behaviour that may describe some of this which is described by Perkert’s law. Peukert’s law describes a relationship where battery capacity reduces as current increases according to a power relationship. Since my battery is discharging at about 350 VA that much less than its 1200 VA maximum capability so it may appear to have more capacity.

However it seems to have both greater input and output energy than its rated usable capacity suggests (input energy remains higher than output energy) so it would seem that there’s something else going on here; whether that’s an early life effect, a genuinely larger capacity than nominal, or some other effect is unknown.

The battery has a nominal capacity of 8.8 kWh to provide is usable capacity of 4 kWh, so it’s possible that some characteristic of the control software is making more of the nominal capacity available than would normally be the case.