Discussion elsewhere prompted me to look into what I spent on what you might term my energy smart systems relating to electricity consumption, so I thought I’d document it here.
| Item | Description | Cost | Comment |
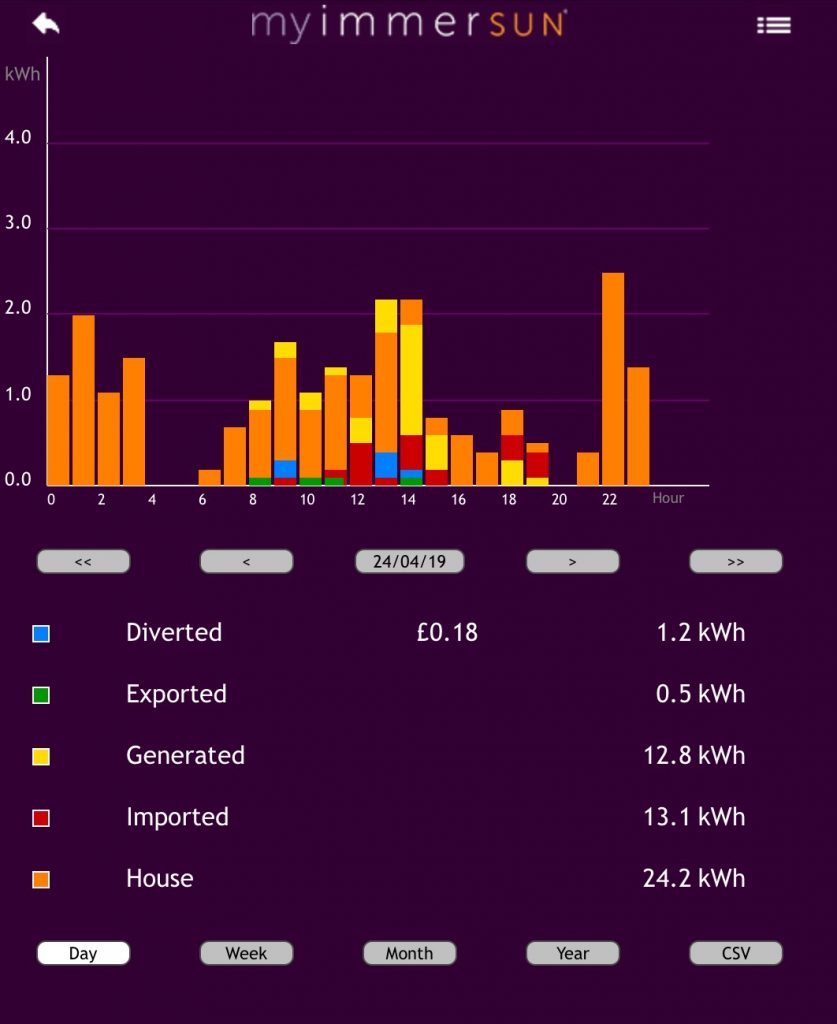
| 1 | Solar photovoltaic system (4kW) | £5,500 | Bundled with ImmerSUN. |
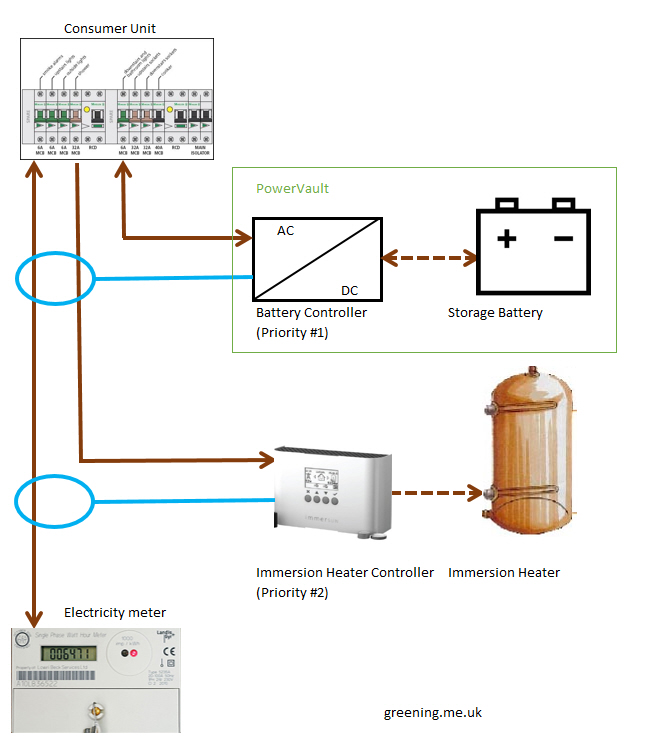
| 2 | Powervault battery storage (4kWh) | £2,000 | Free installation as part of UKPN trial. |
| 3 | ImmerSUN management system with monitoring. | £600 | Estimate based on today’s pricing. |
| 4 | Remote-controlled car charger. | £300 | Modified used charger from eBay. My own software. |
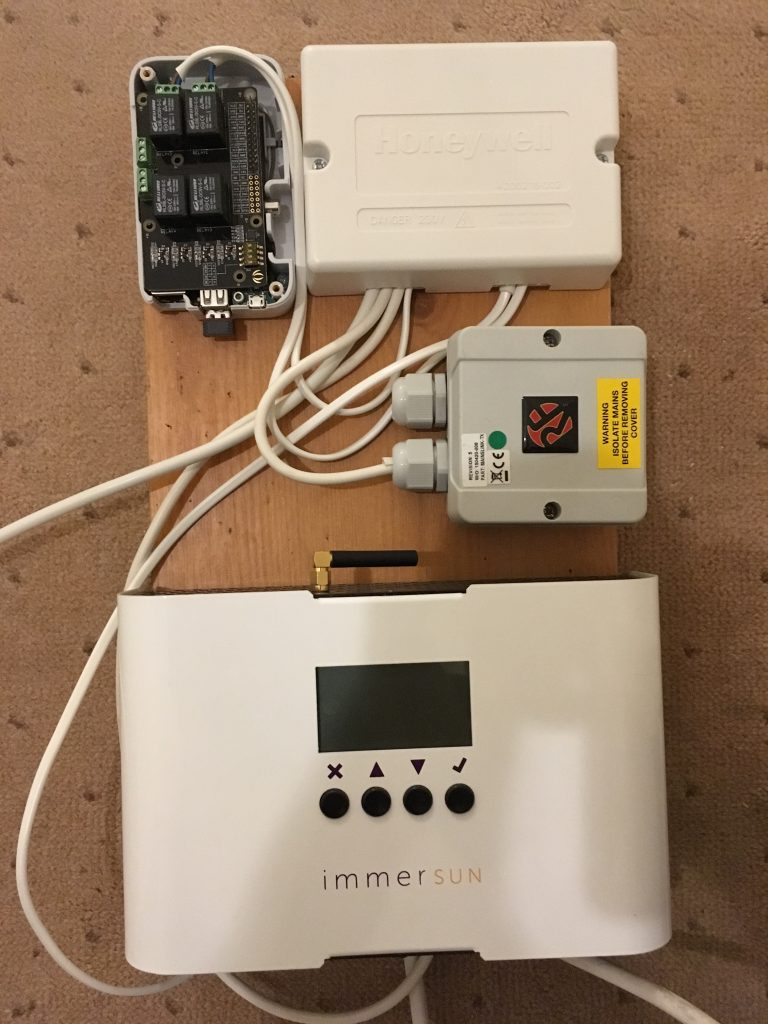
| 5 | Raspberry Pi items to make HEMS | £200 | My own software. |
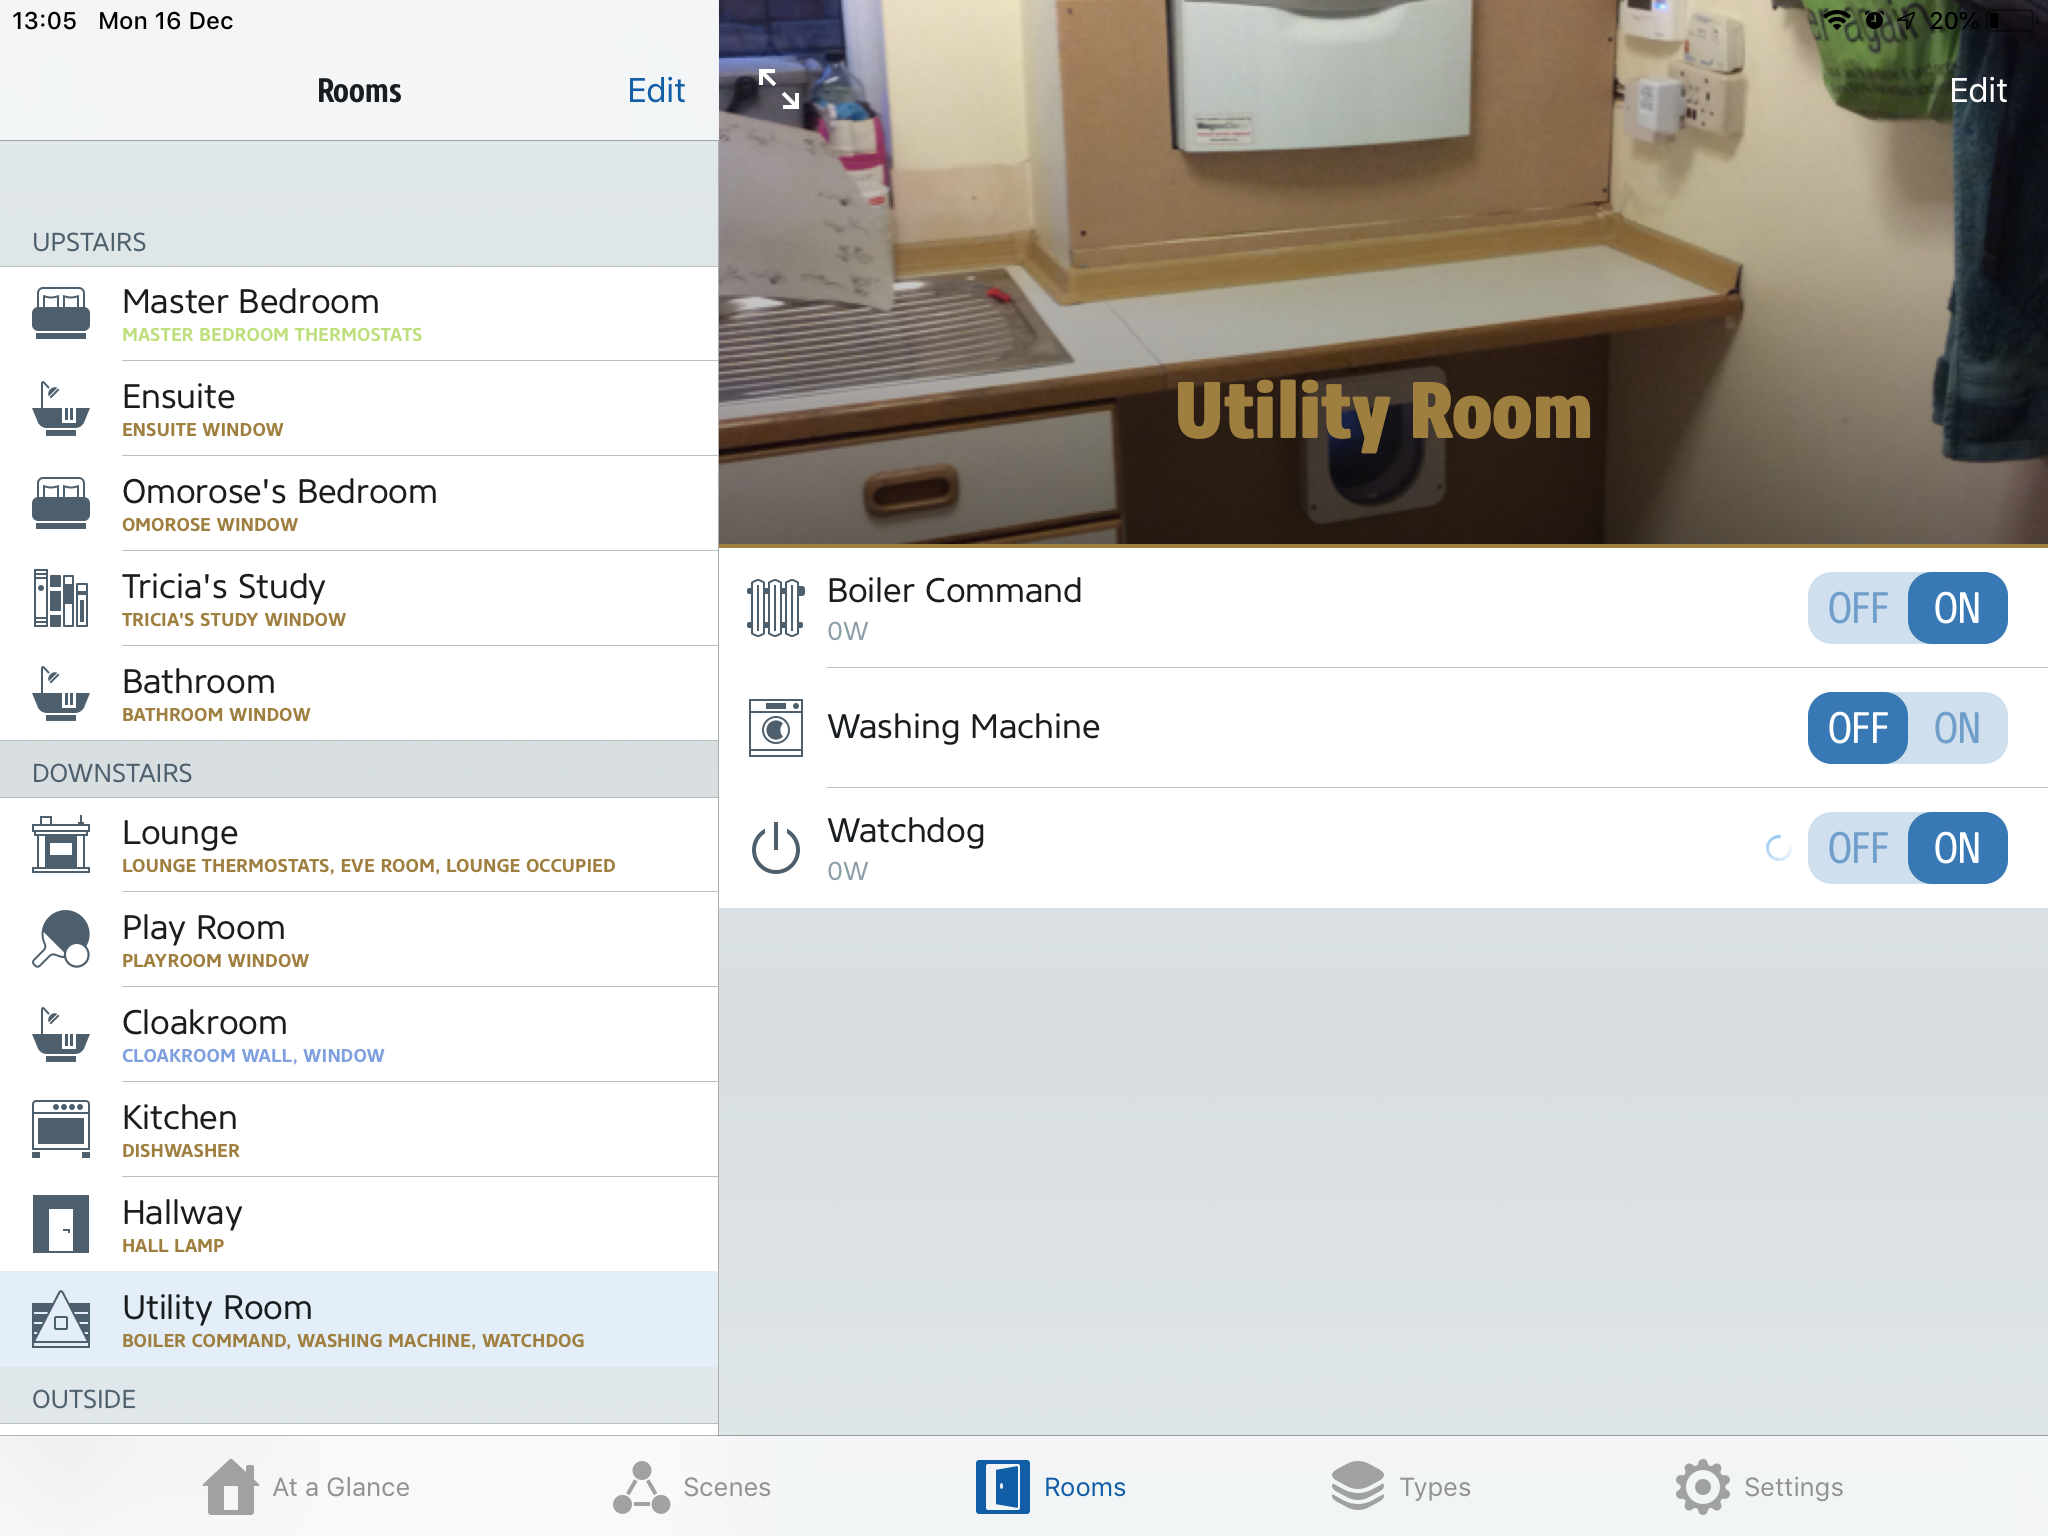
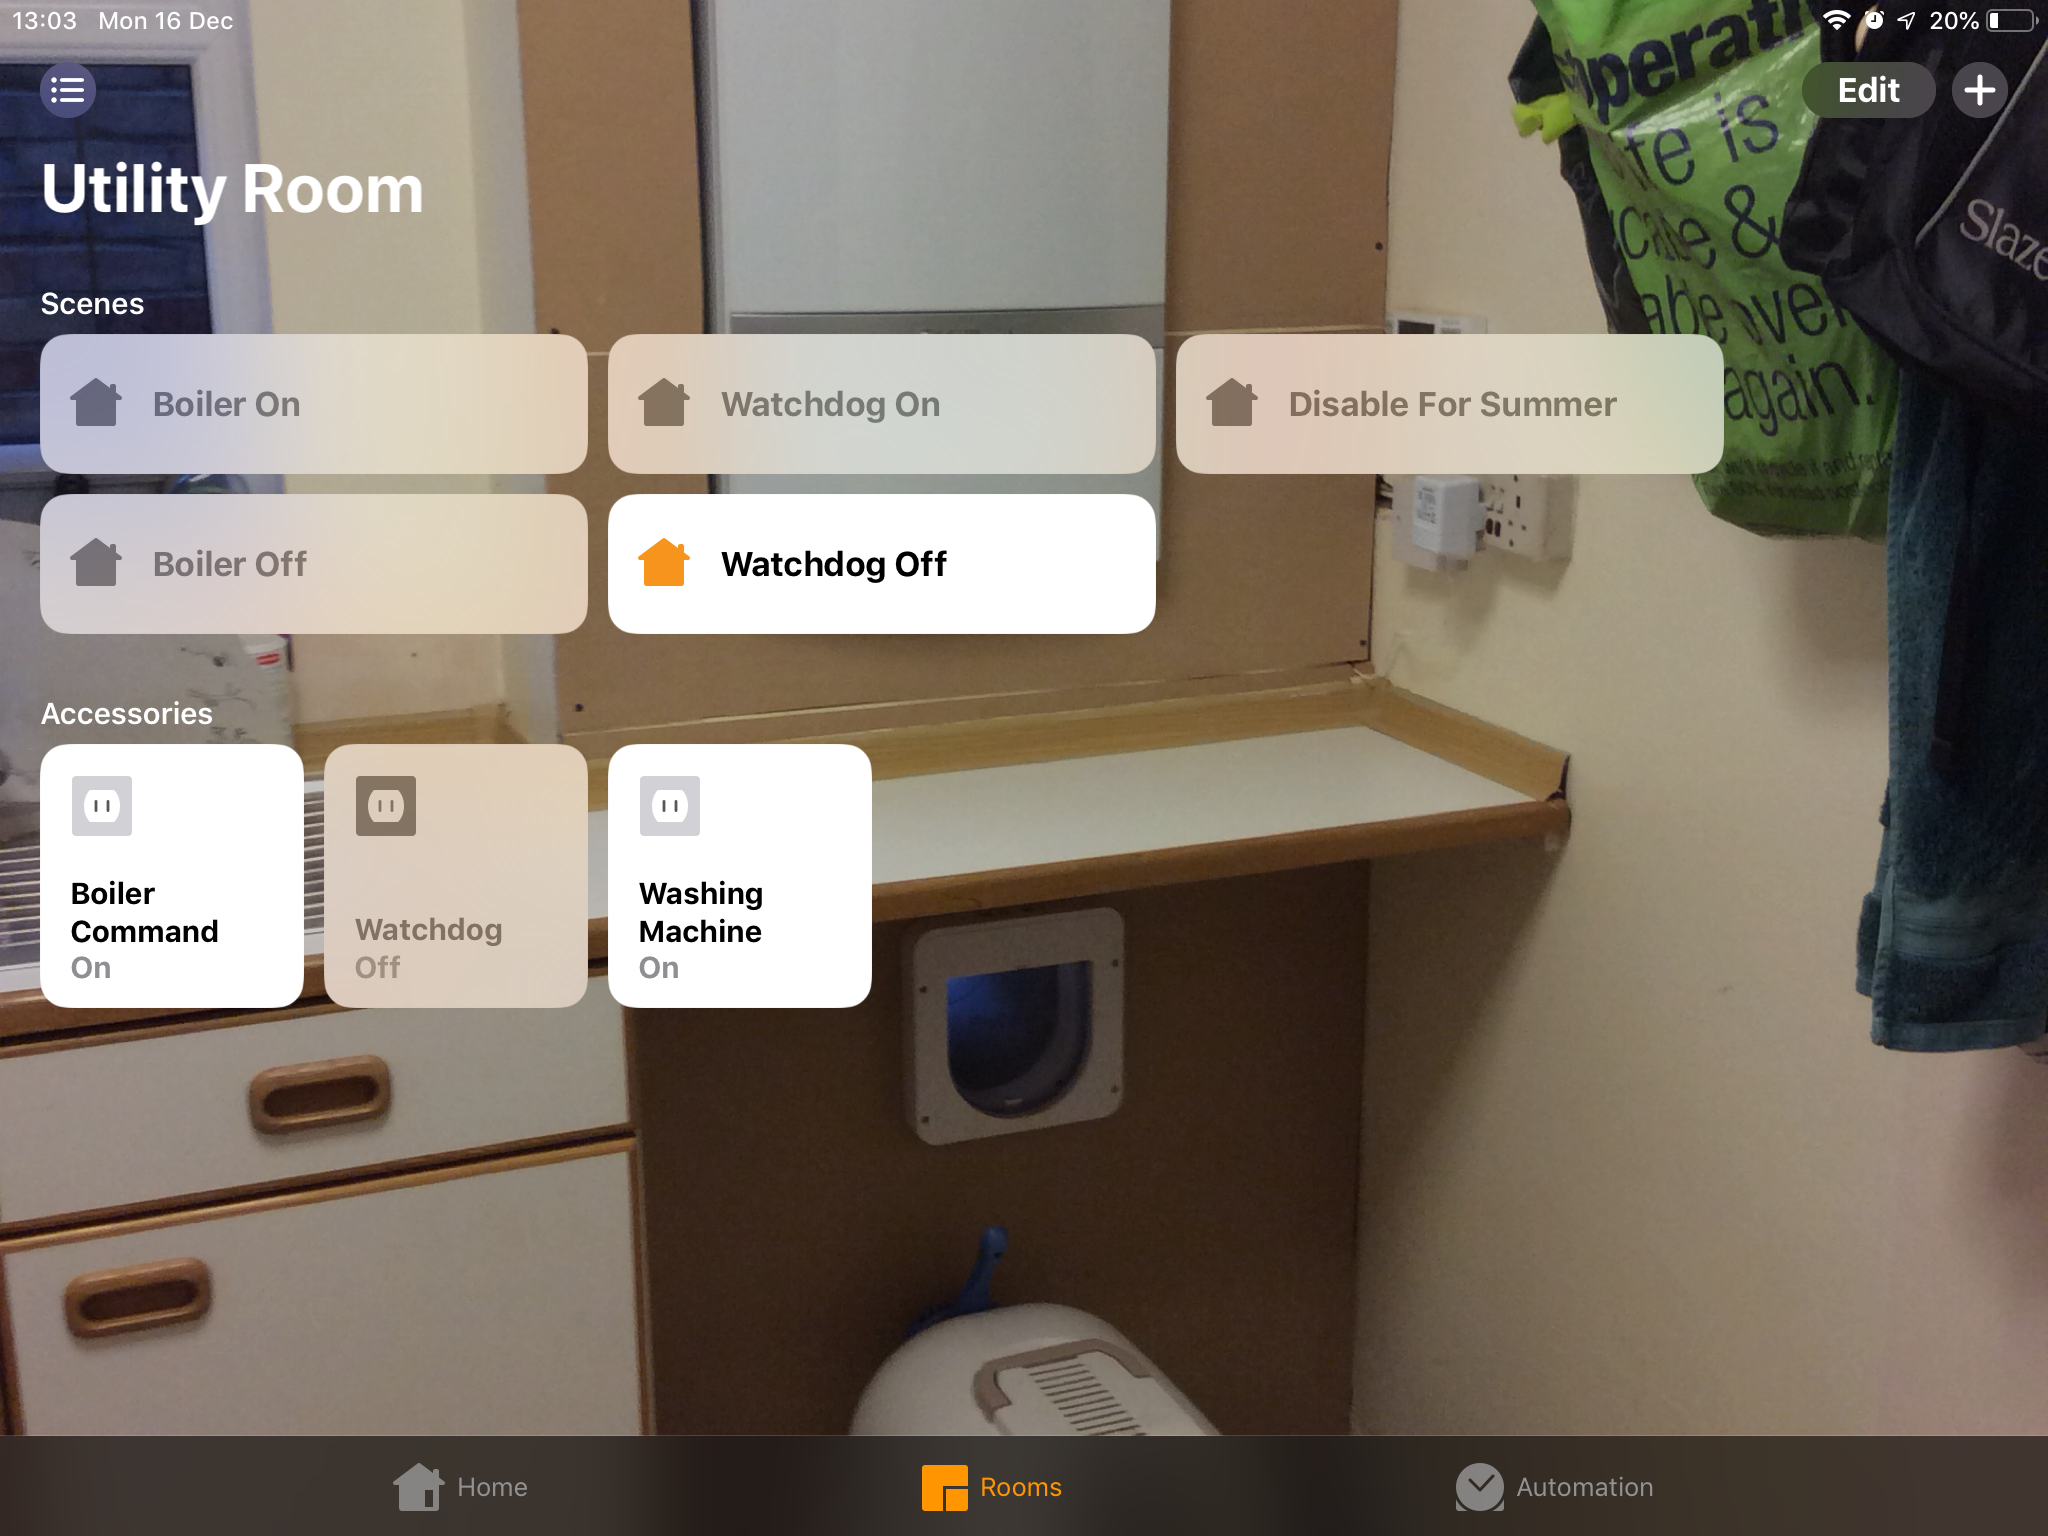
| 6 | Wet goods automation (WIFIPLUG x 2) | £70 | |
| TOTAL | £8,670 |
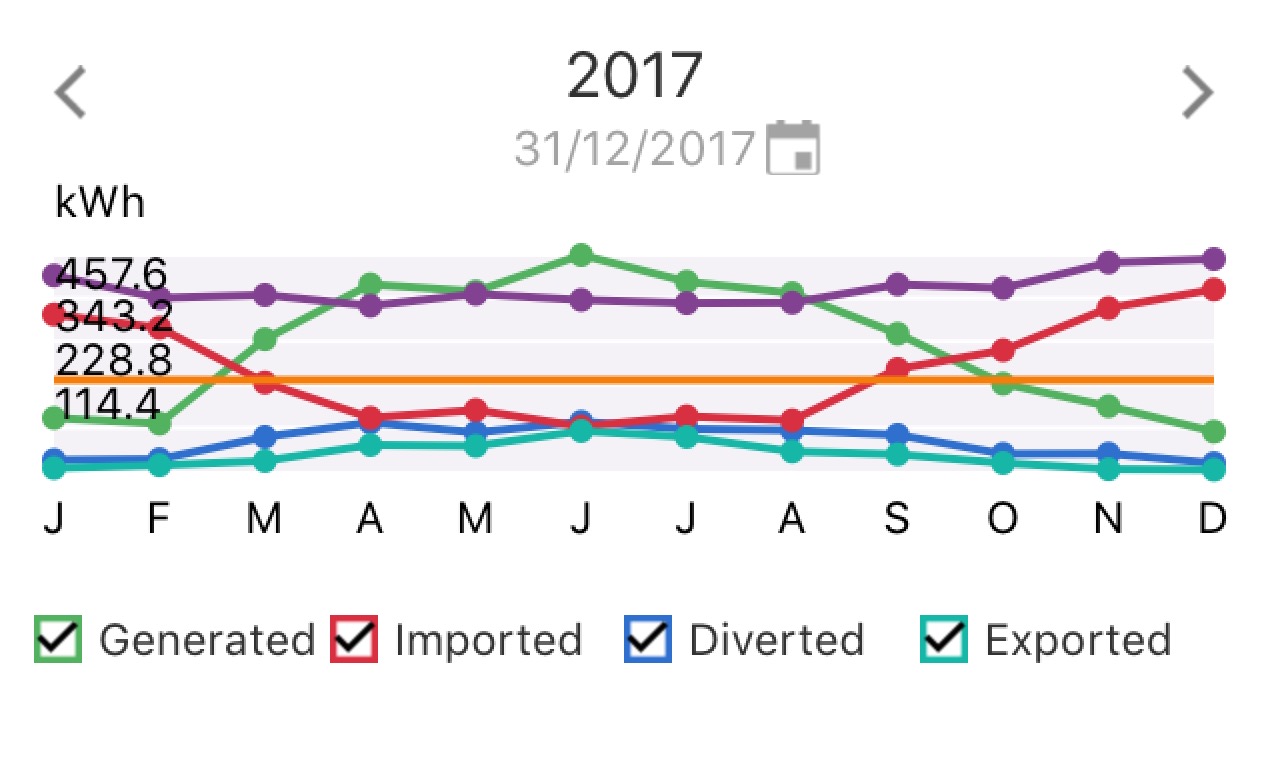
Prior analysis of items #1-#4 in pre-Agile days has suggested a total of 9 years to achieve payback on this investment through use of around 85% of the generated energy. Solar panels are potentially good for over 20 years operation, although I doubt the lead-acid batteries will still be operating for anything like that long.
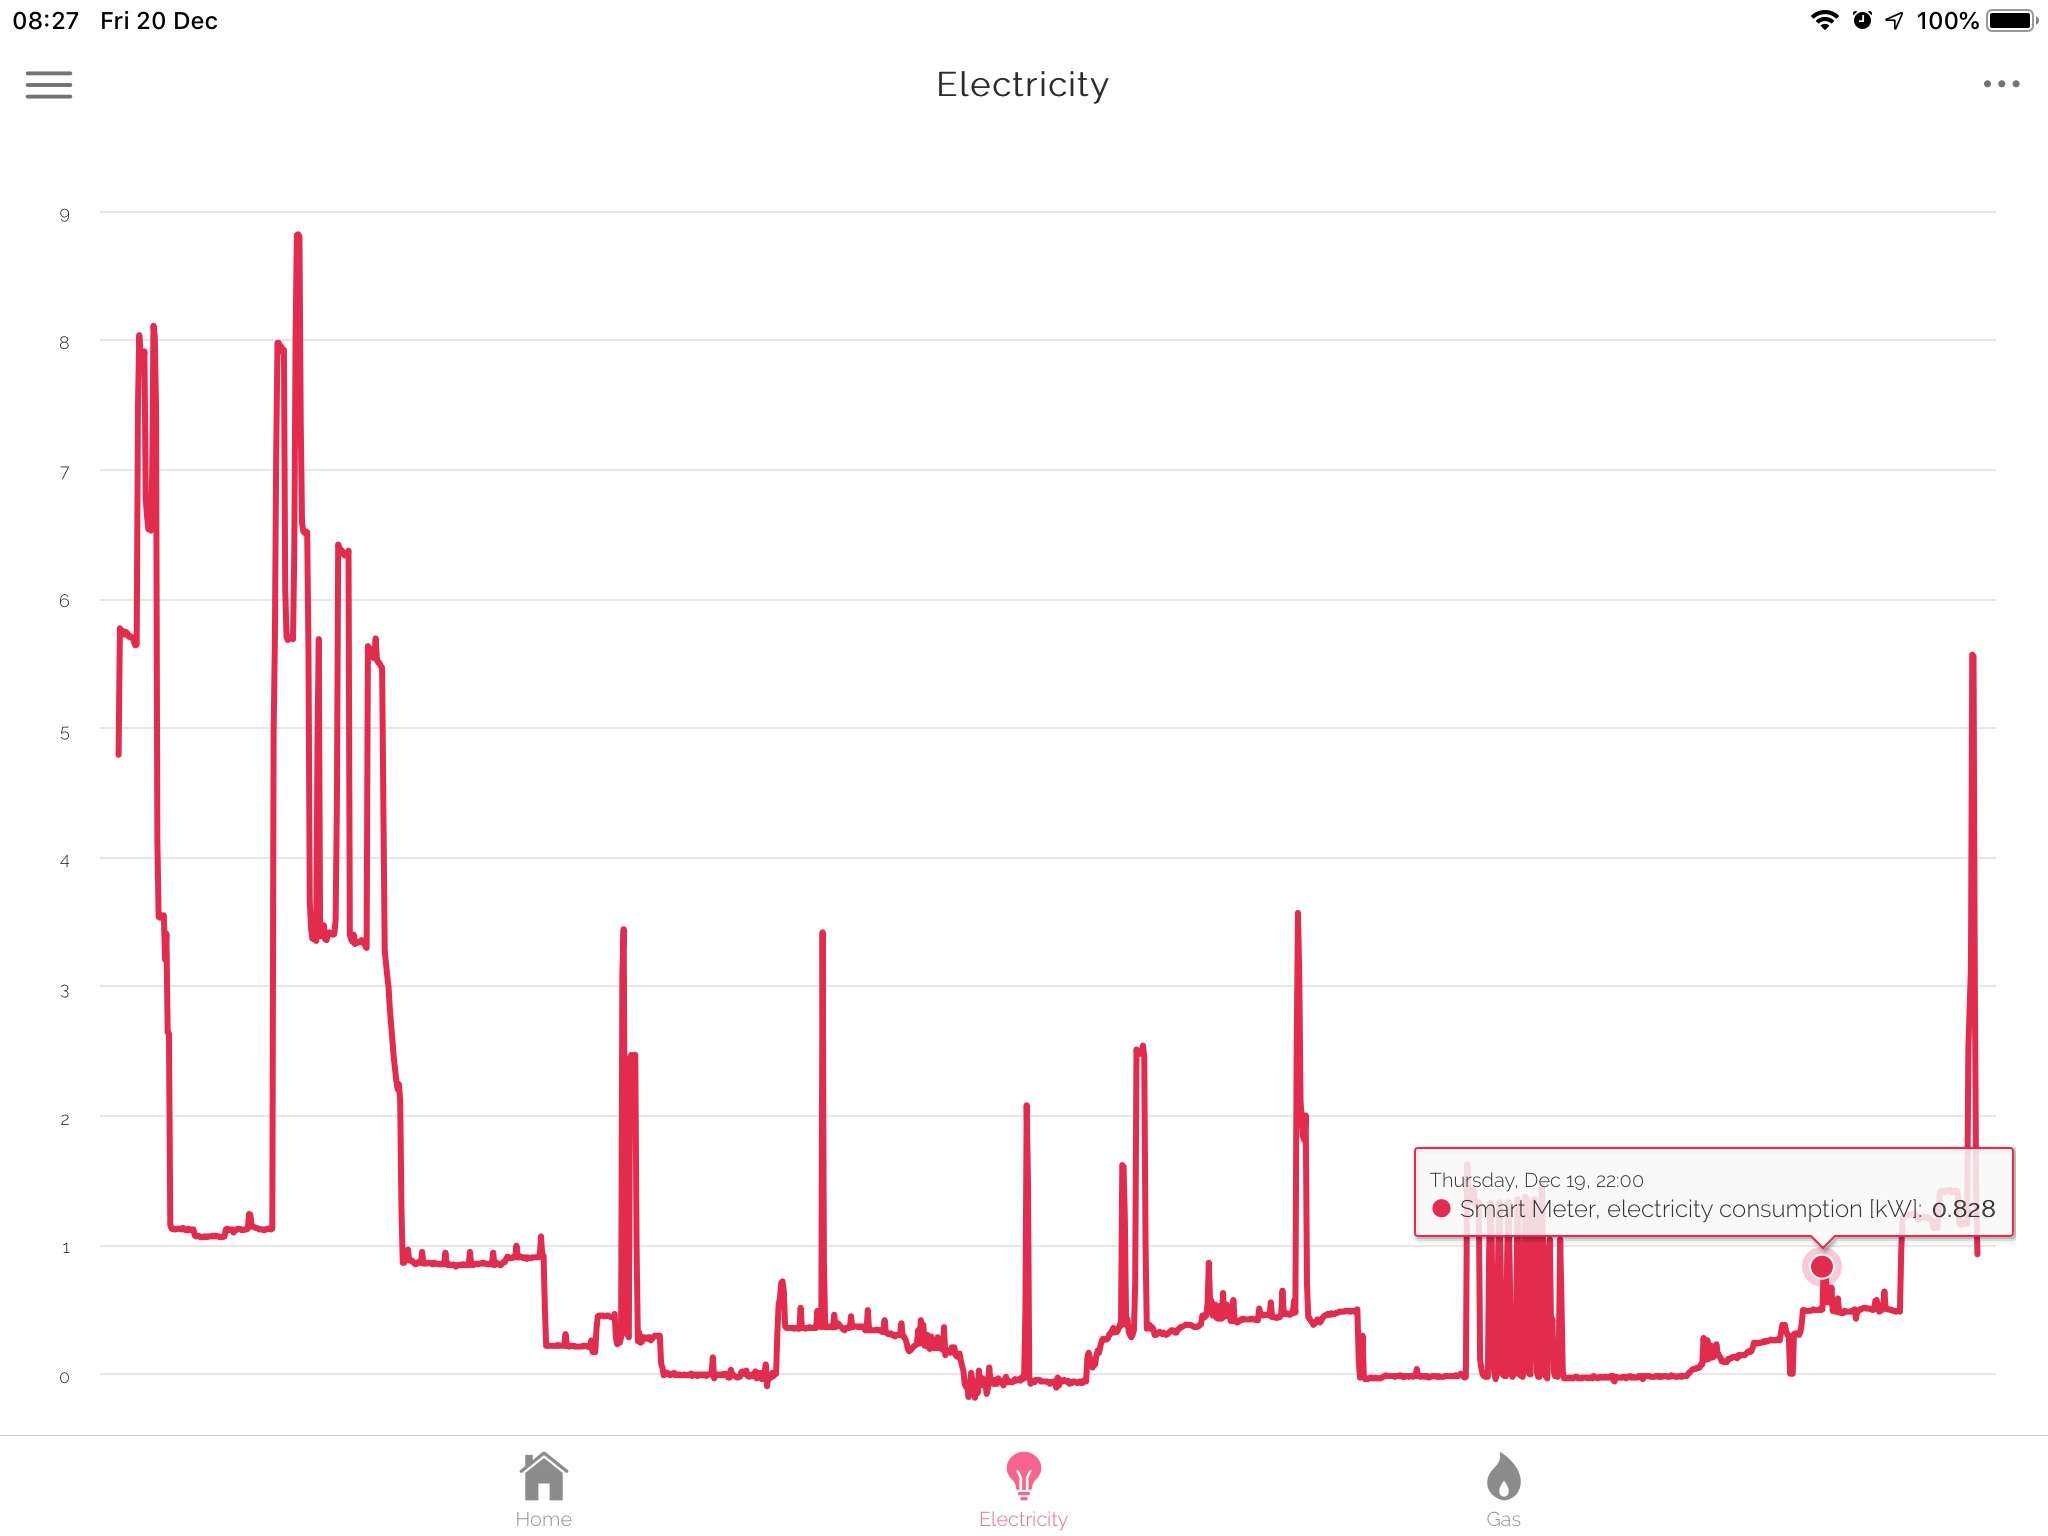
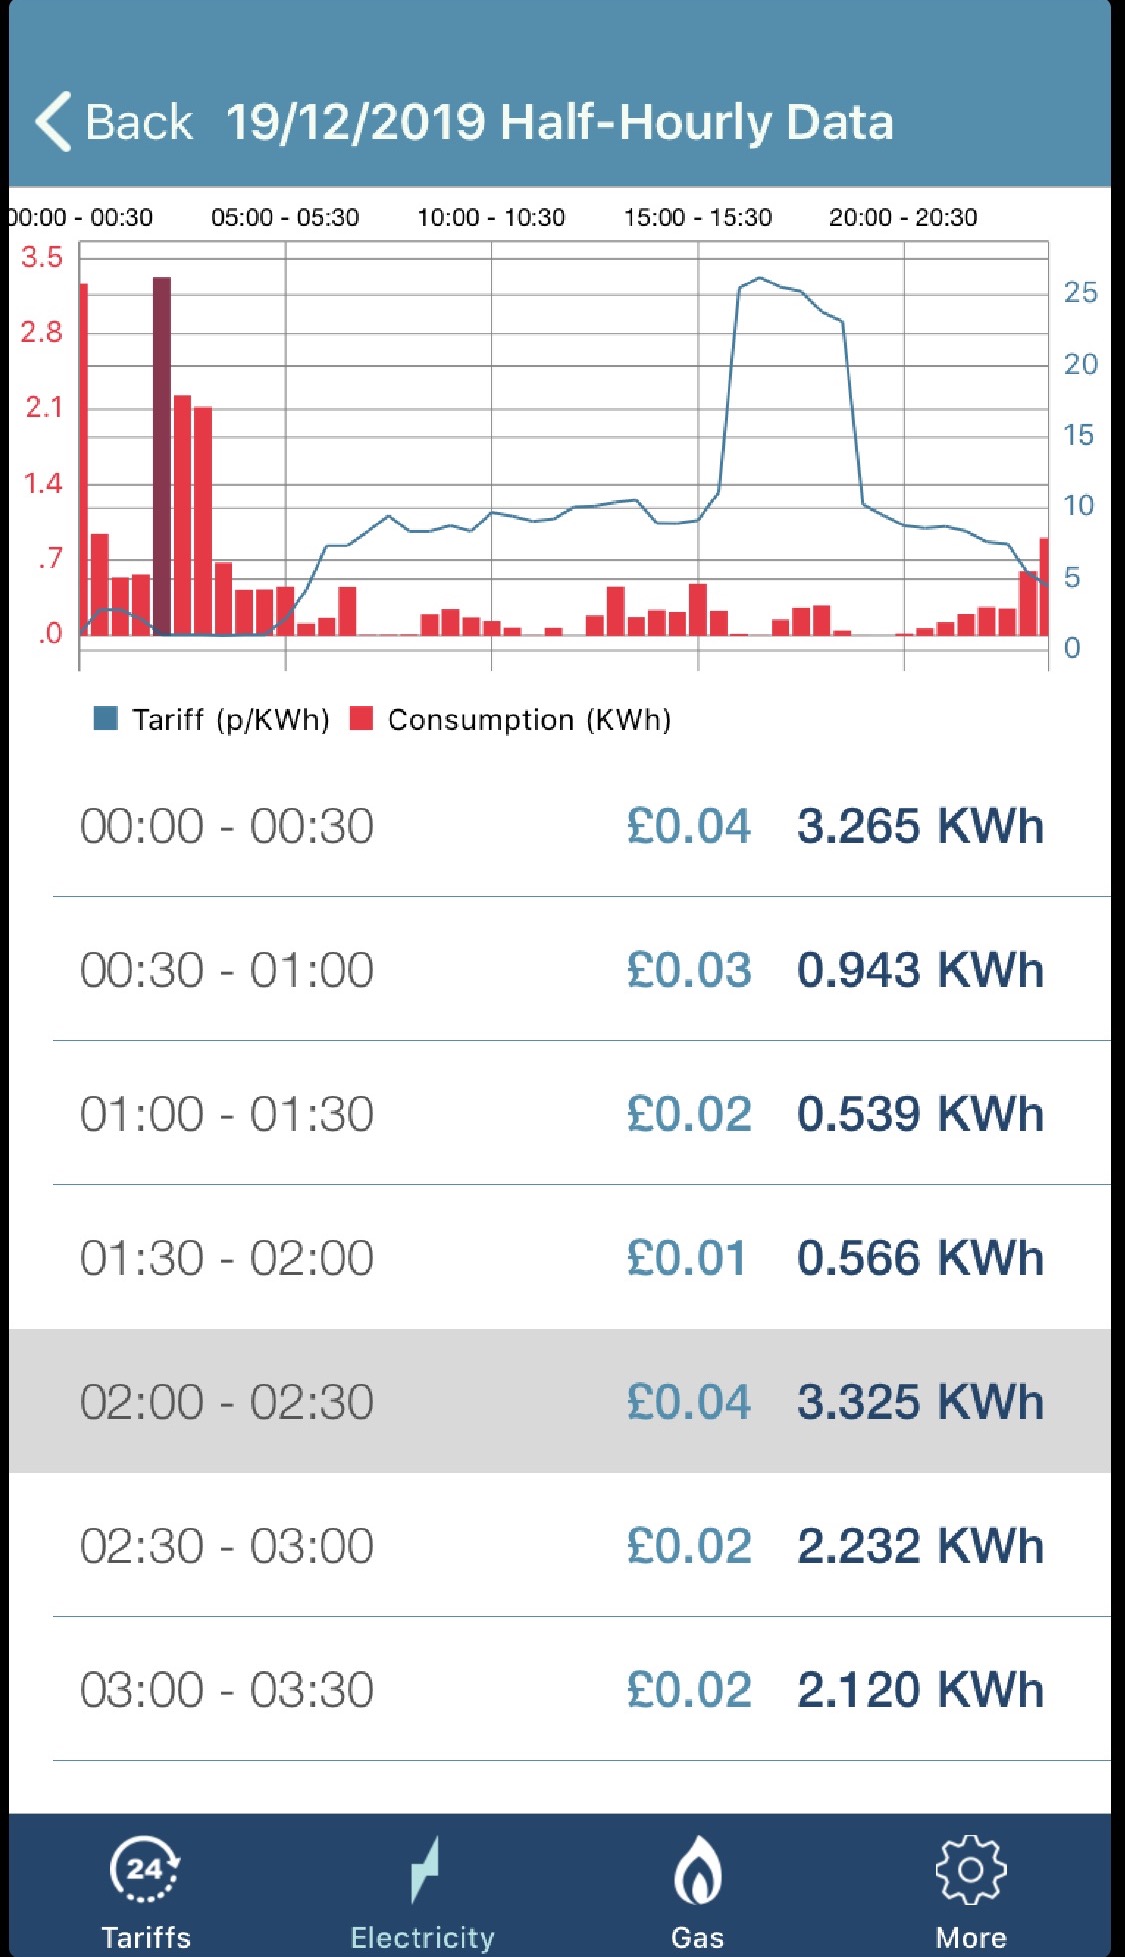
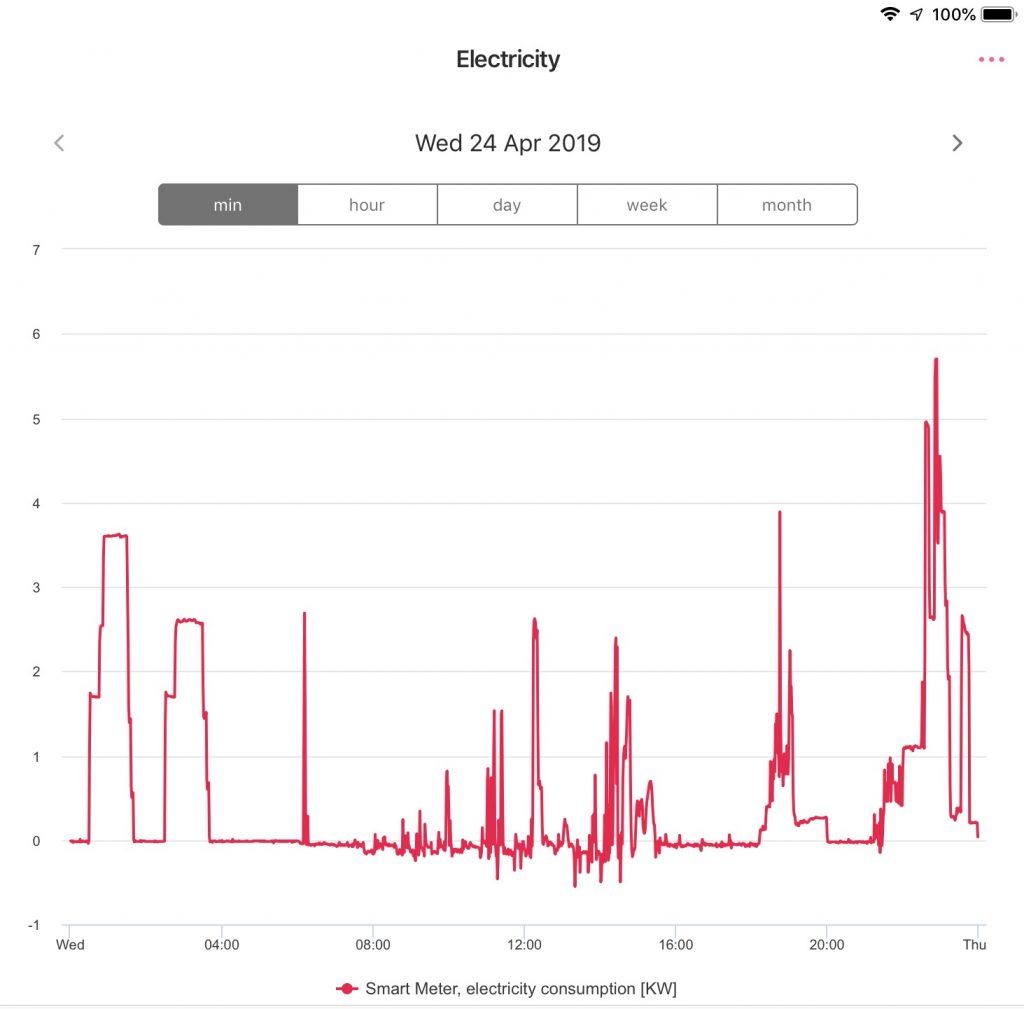
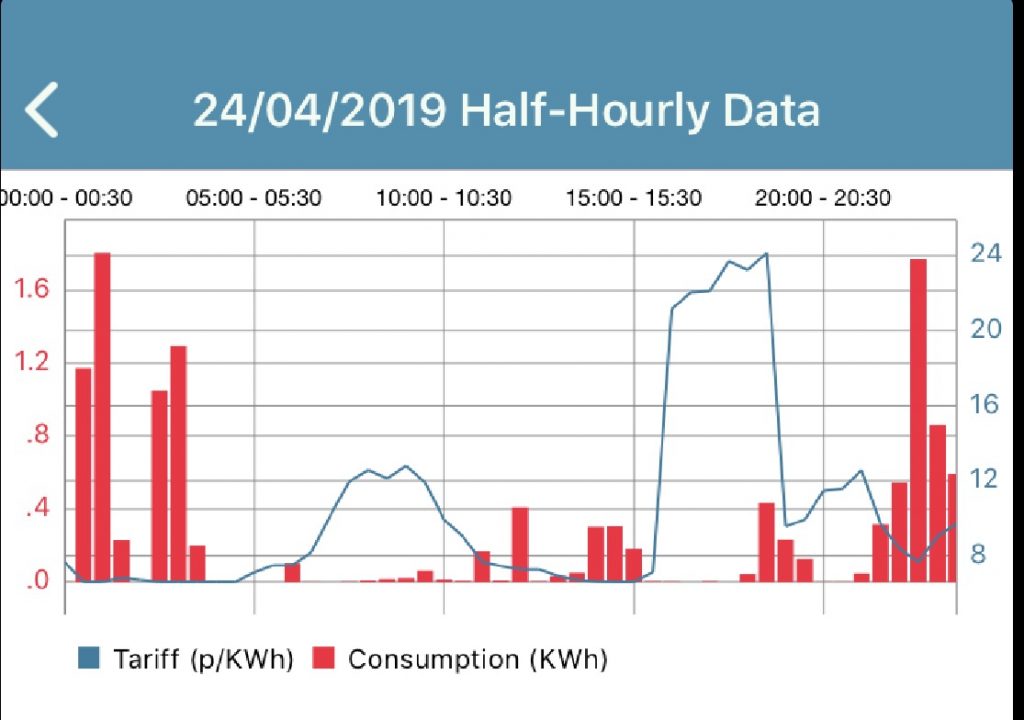
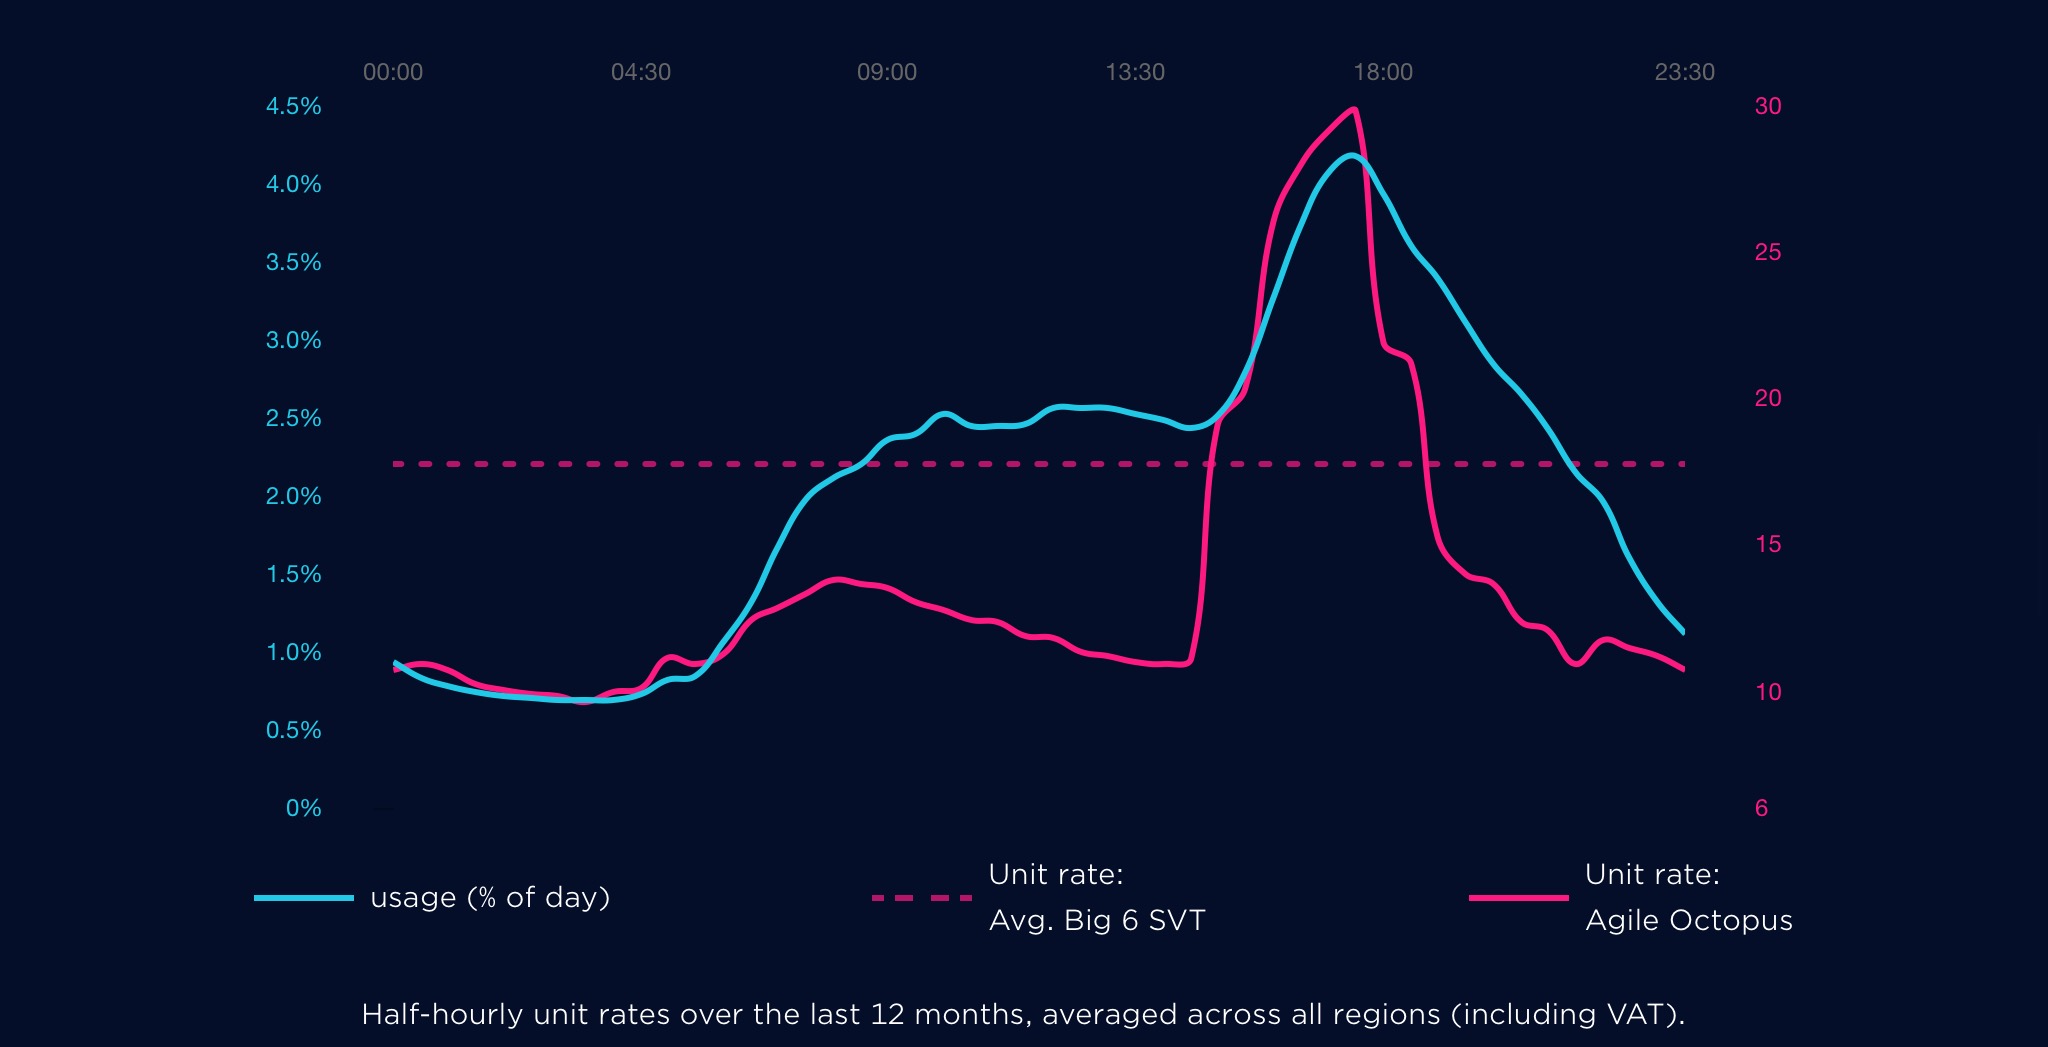
The combination of item #5 with my Octopus Agile dynamic smart electricity tariff has resulted in my average bought electricity price being 7.75 p/kWh in 2019, about half the UK average. I suppose that I could make the same judgements and program items manually each day, but the HEMS significantly reduces my time commitment to achieve that.
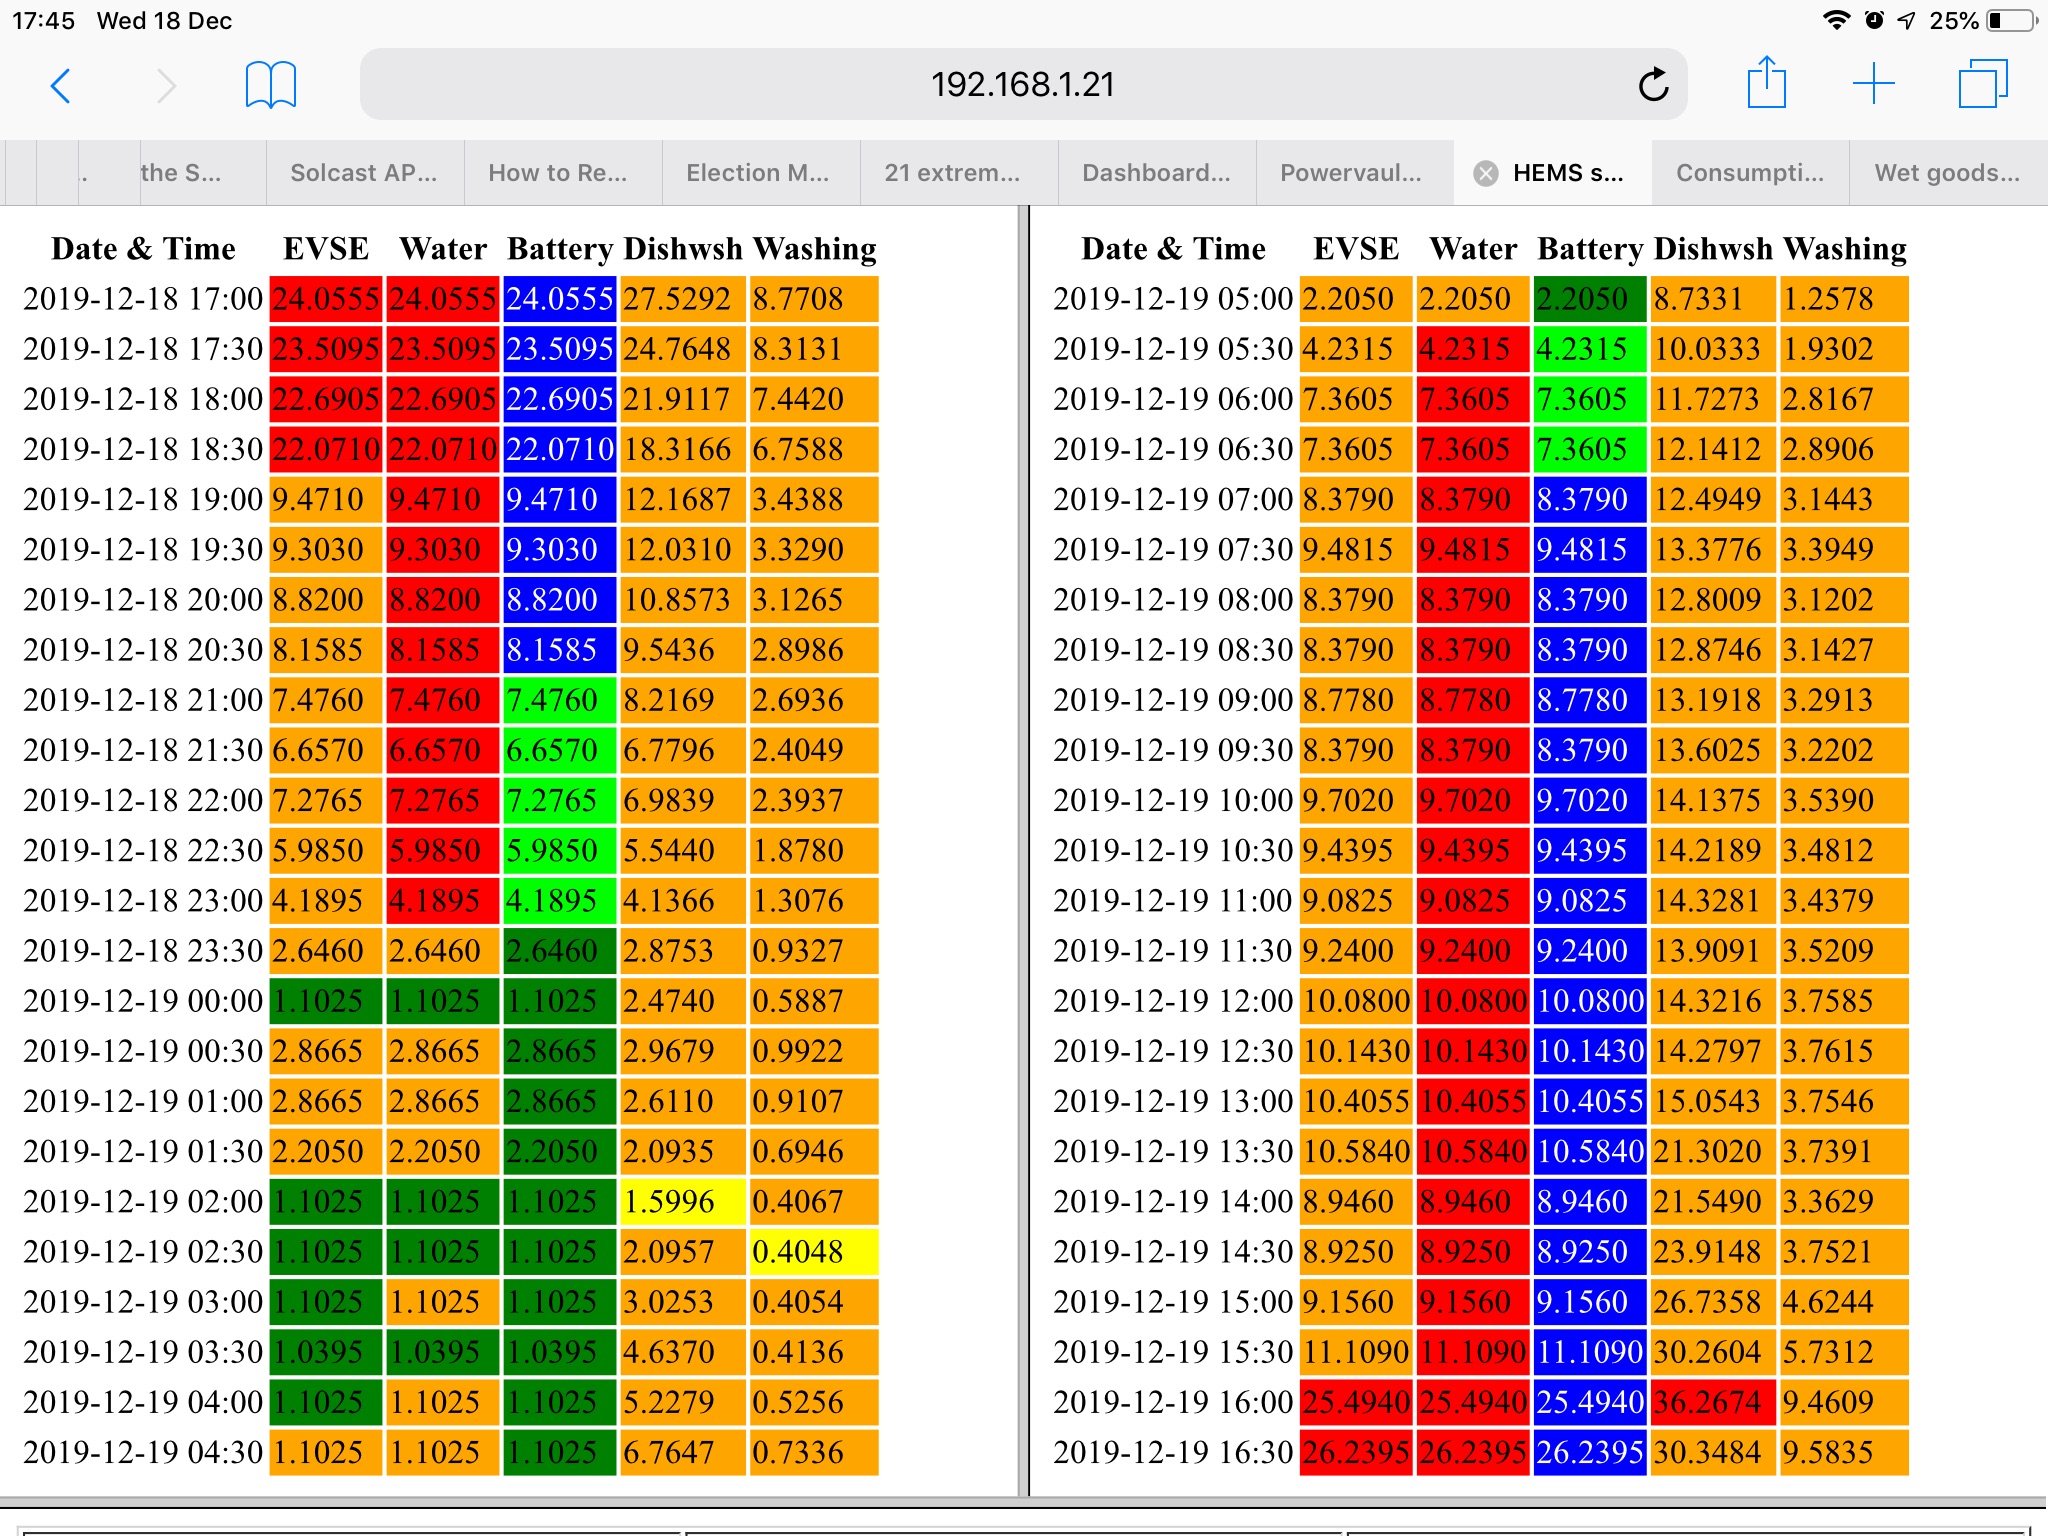
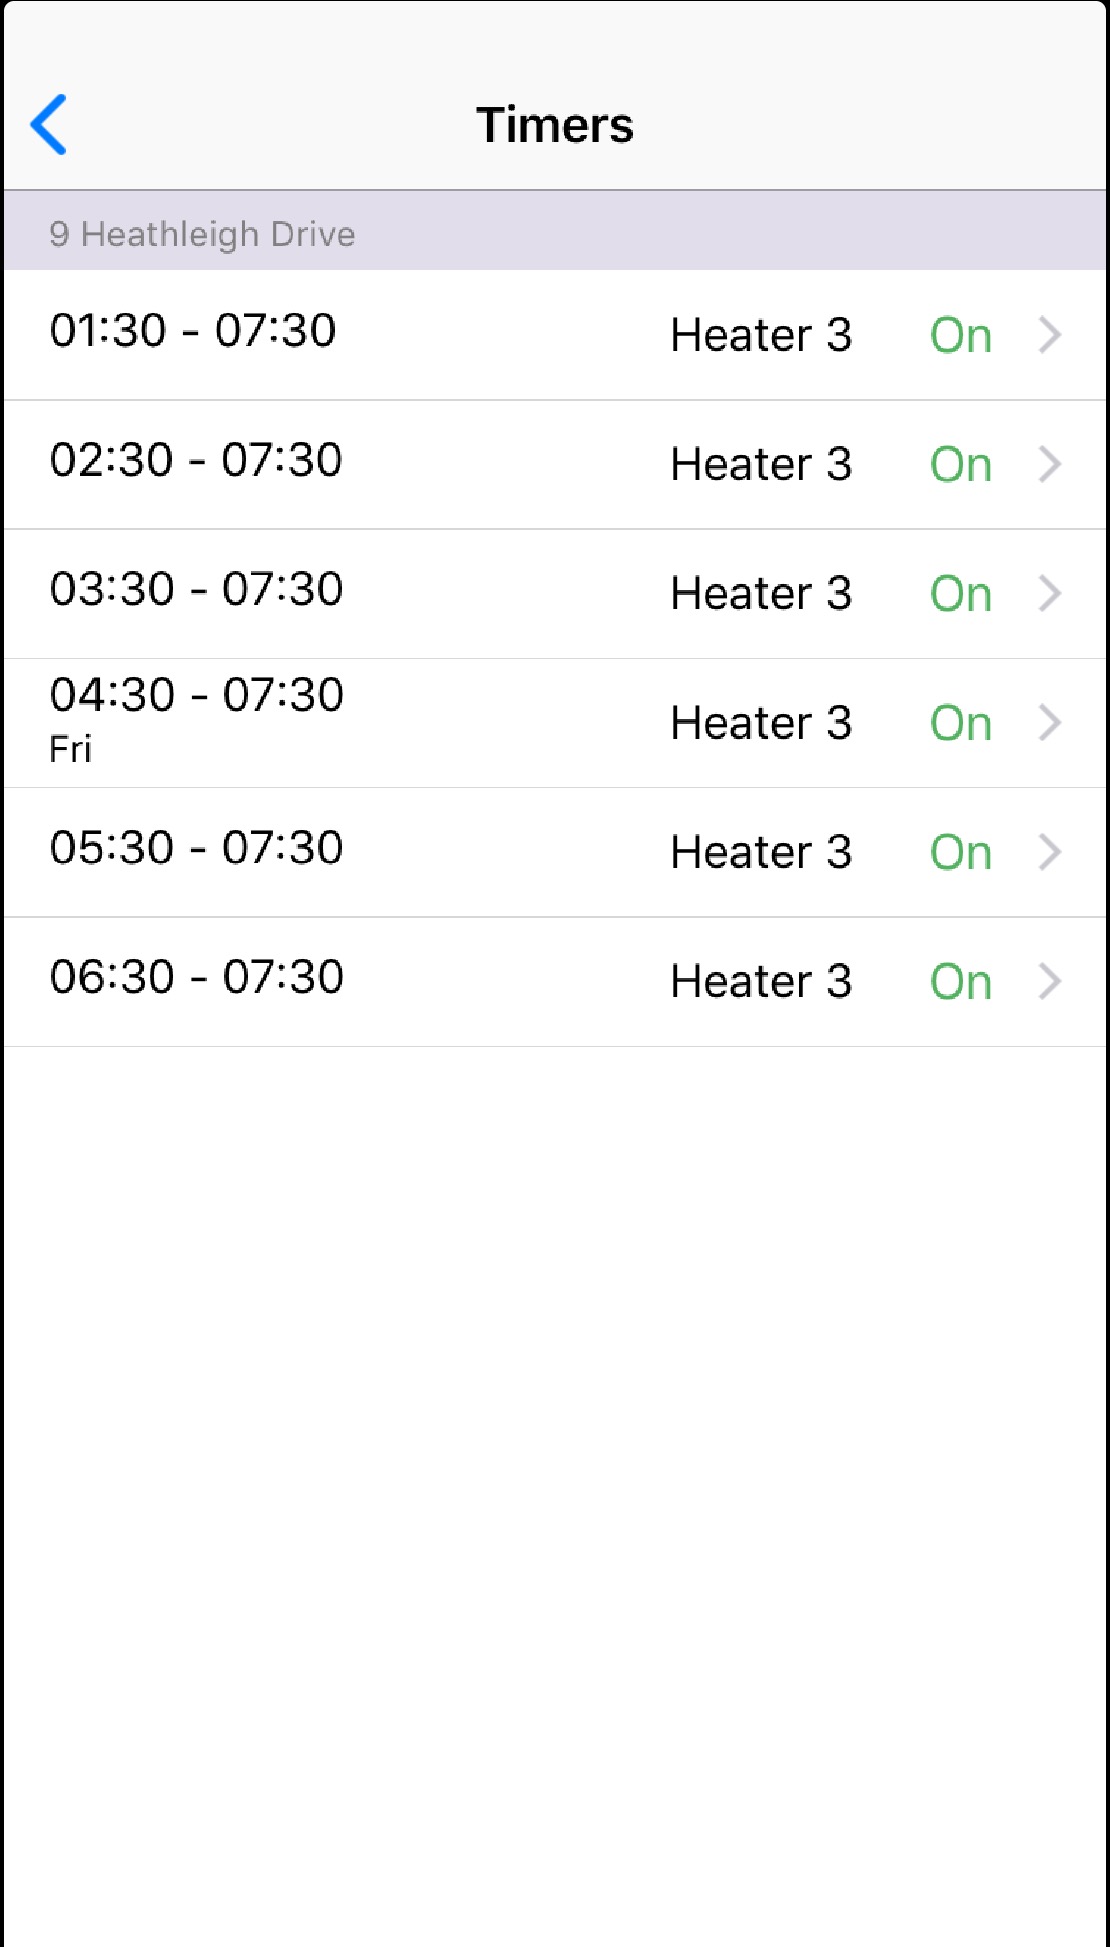
Item #6 is my most recent addition. The sophistication of the algorithm combining the Agile tariff with a simple model of the cycle of each device is such that I would never achieve such a high quality result manually. However the saving is perhaps only a three pence each day so maybe £10 per year on my Agile tariff and thus 7 years to pay for the two smart plugs.
Much of this content is thus around 7 years to payback. The HEMS is potentially much quicker, but relies on having smart systems to control such as battery storage and car charger.