
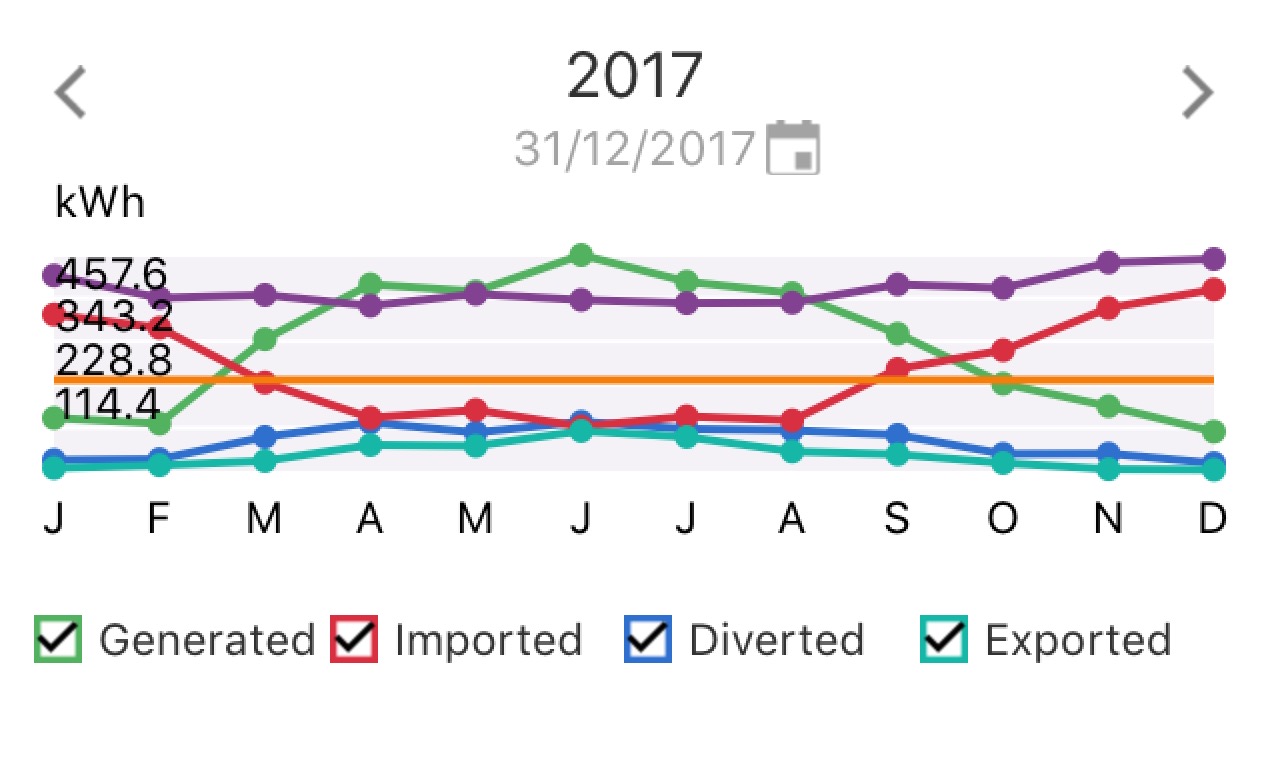
 The image above shows my solar electricity generation and usage in 2017 by calendar month.
- The purple line shows the use of electricity (excluding gas replacement) by month. It’s relatively stable through the year, although it does rise in the autumn as my daughter started school and so my electric car mileage increased.
- The green line shows the output from the solar panels. From April to August (5 months) solar panel output exceeded usage giving the potential not to buy electricity with sufficient smart capability – be that electricity storage or alignment of consumption with availability.
- The red line shows import of electricity from the mains. It tends to be the reverse of the solar panel output. It’s never zero indicating potential (at cost) to improve smart usage. Solar power is a more significant energy source than imported power from March to September (7 months).
- The blue line shows diversion of surplus electricity to water heating as gas replacement.
- The turquoise line shows export of electricity to the grid. This occurs when there is insufficient energy smart resource available to store or self-use the surplus power. Export amounts to about 12% of total solar panel output. While this potentially free energy, the economics of storage or smart controls make using this remainder increasingly costly from an investment perspective. In my case this surplus occurs on particularly sunny summer days when the electric car is not at home or is already fully charged – which might be vacation periods when the house is unoccupied for example.
Please follow and like Greening Me: