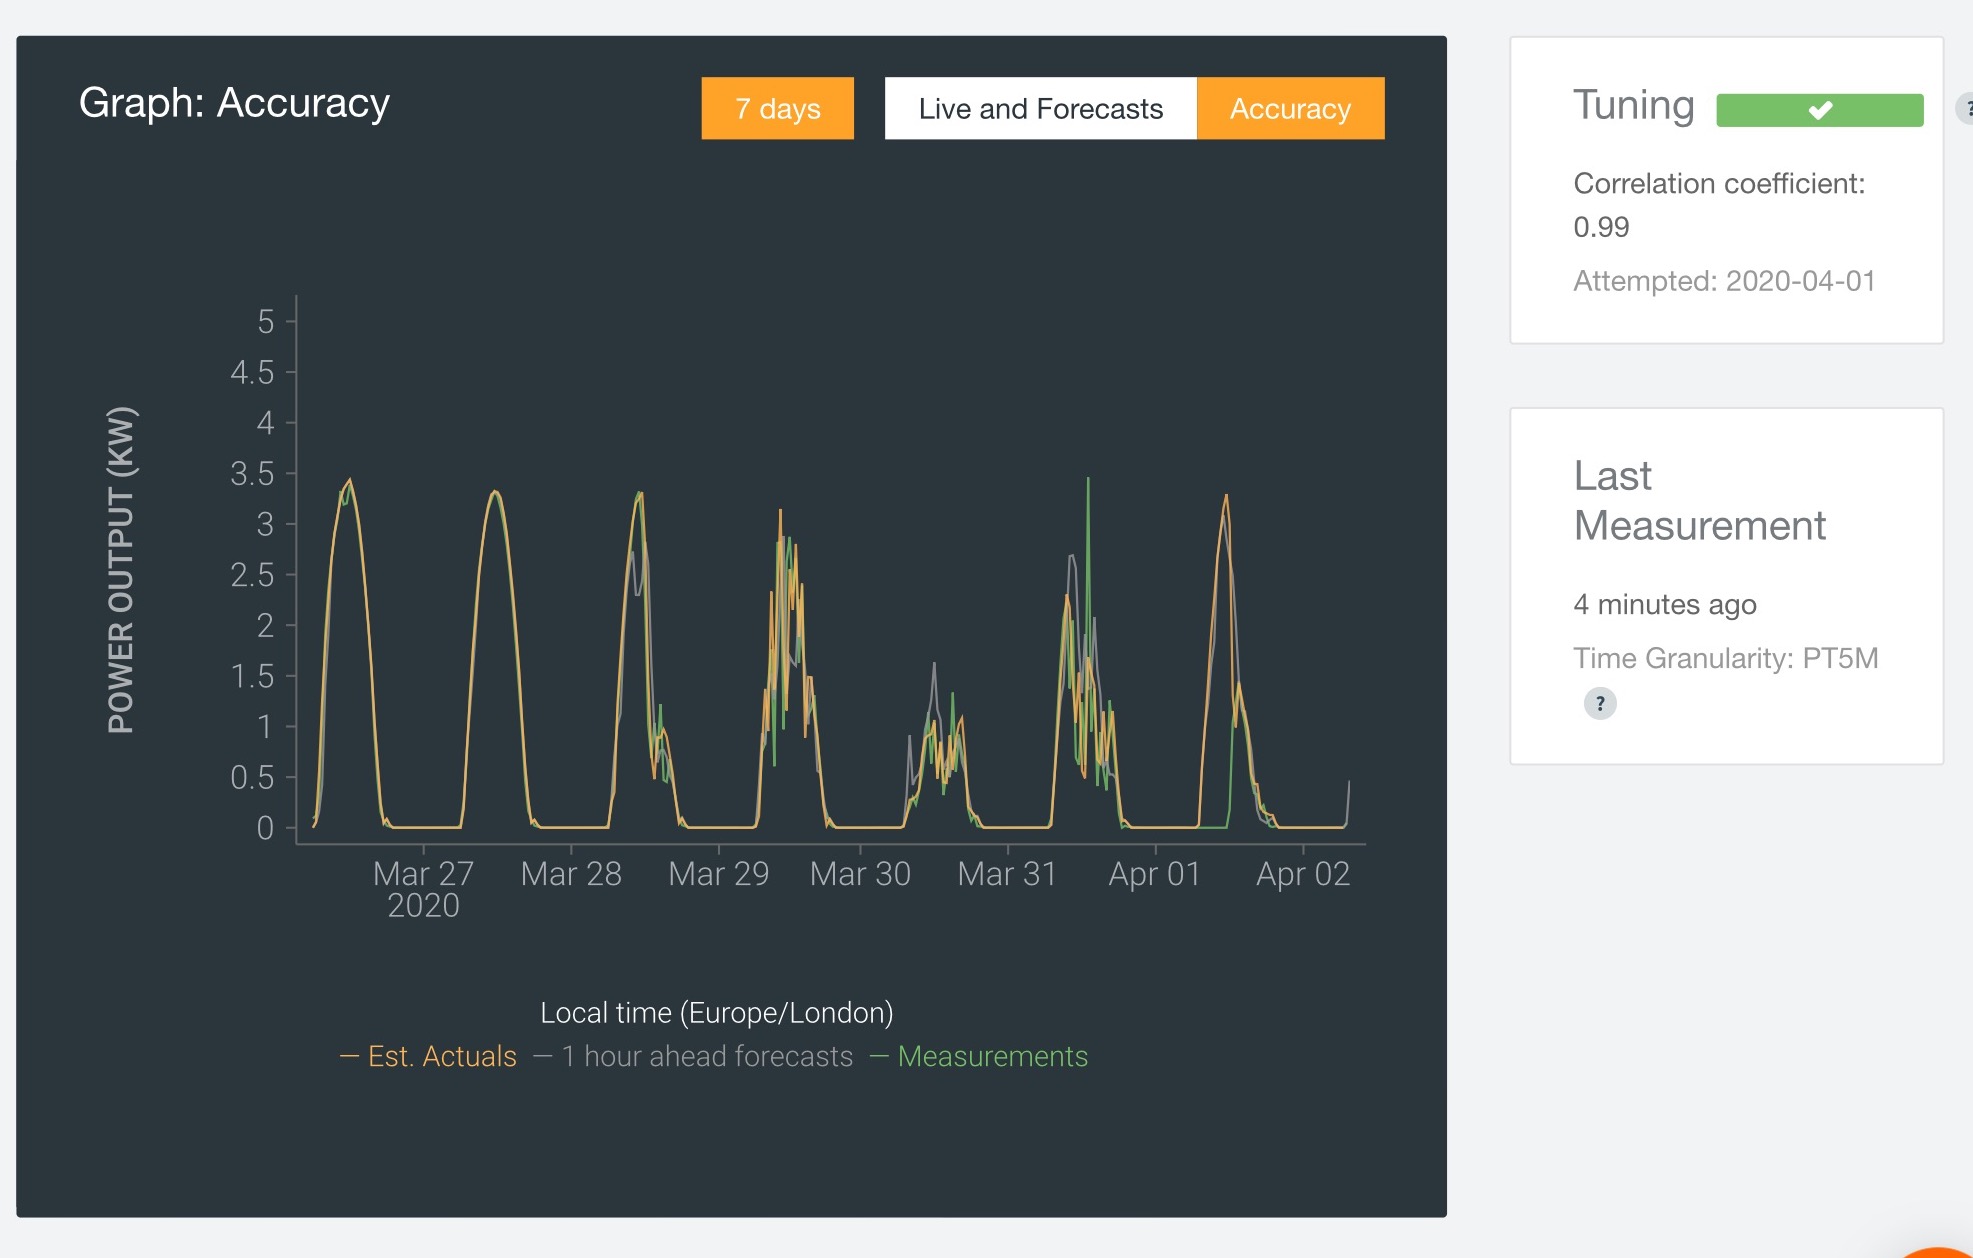
As regular readers will recall I’ve recently updated my battery controls with solar predication. For some years now my battery storage has automatically charged during sunshine and later discharged in the evening, and over the last year I added the HEMS to manage buying electricity including for the battery when the electricity cost was cheapest as there’s little solar in the winter, but now the HEMS has the ability to automatically adjust how much power is bought from the grid depending on how much output is expected from the solar panels in order to deliver a charged battery by the end of the day when the electricity price rises significantly. The battery charging can thus swing from all solar to all grid and all points in between entirely automatically based on the solar forecast.

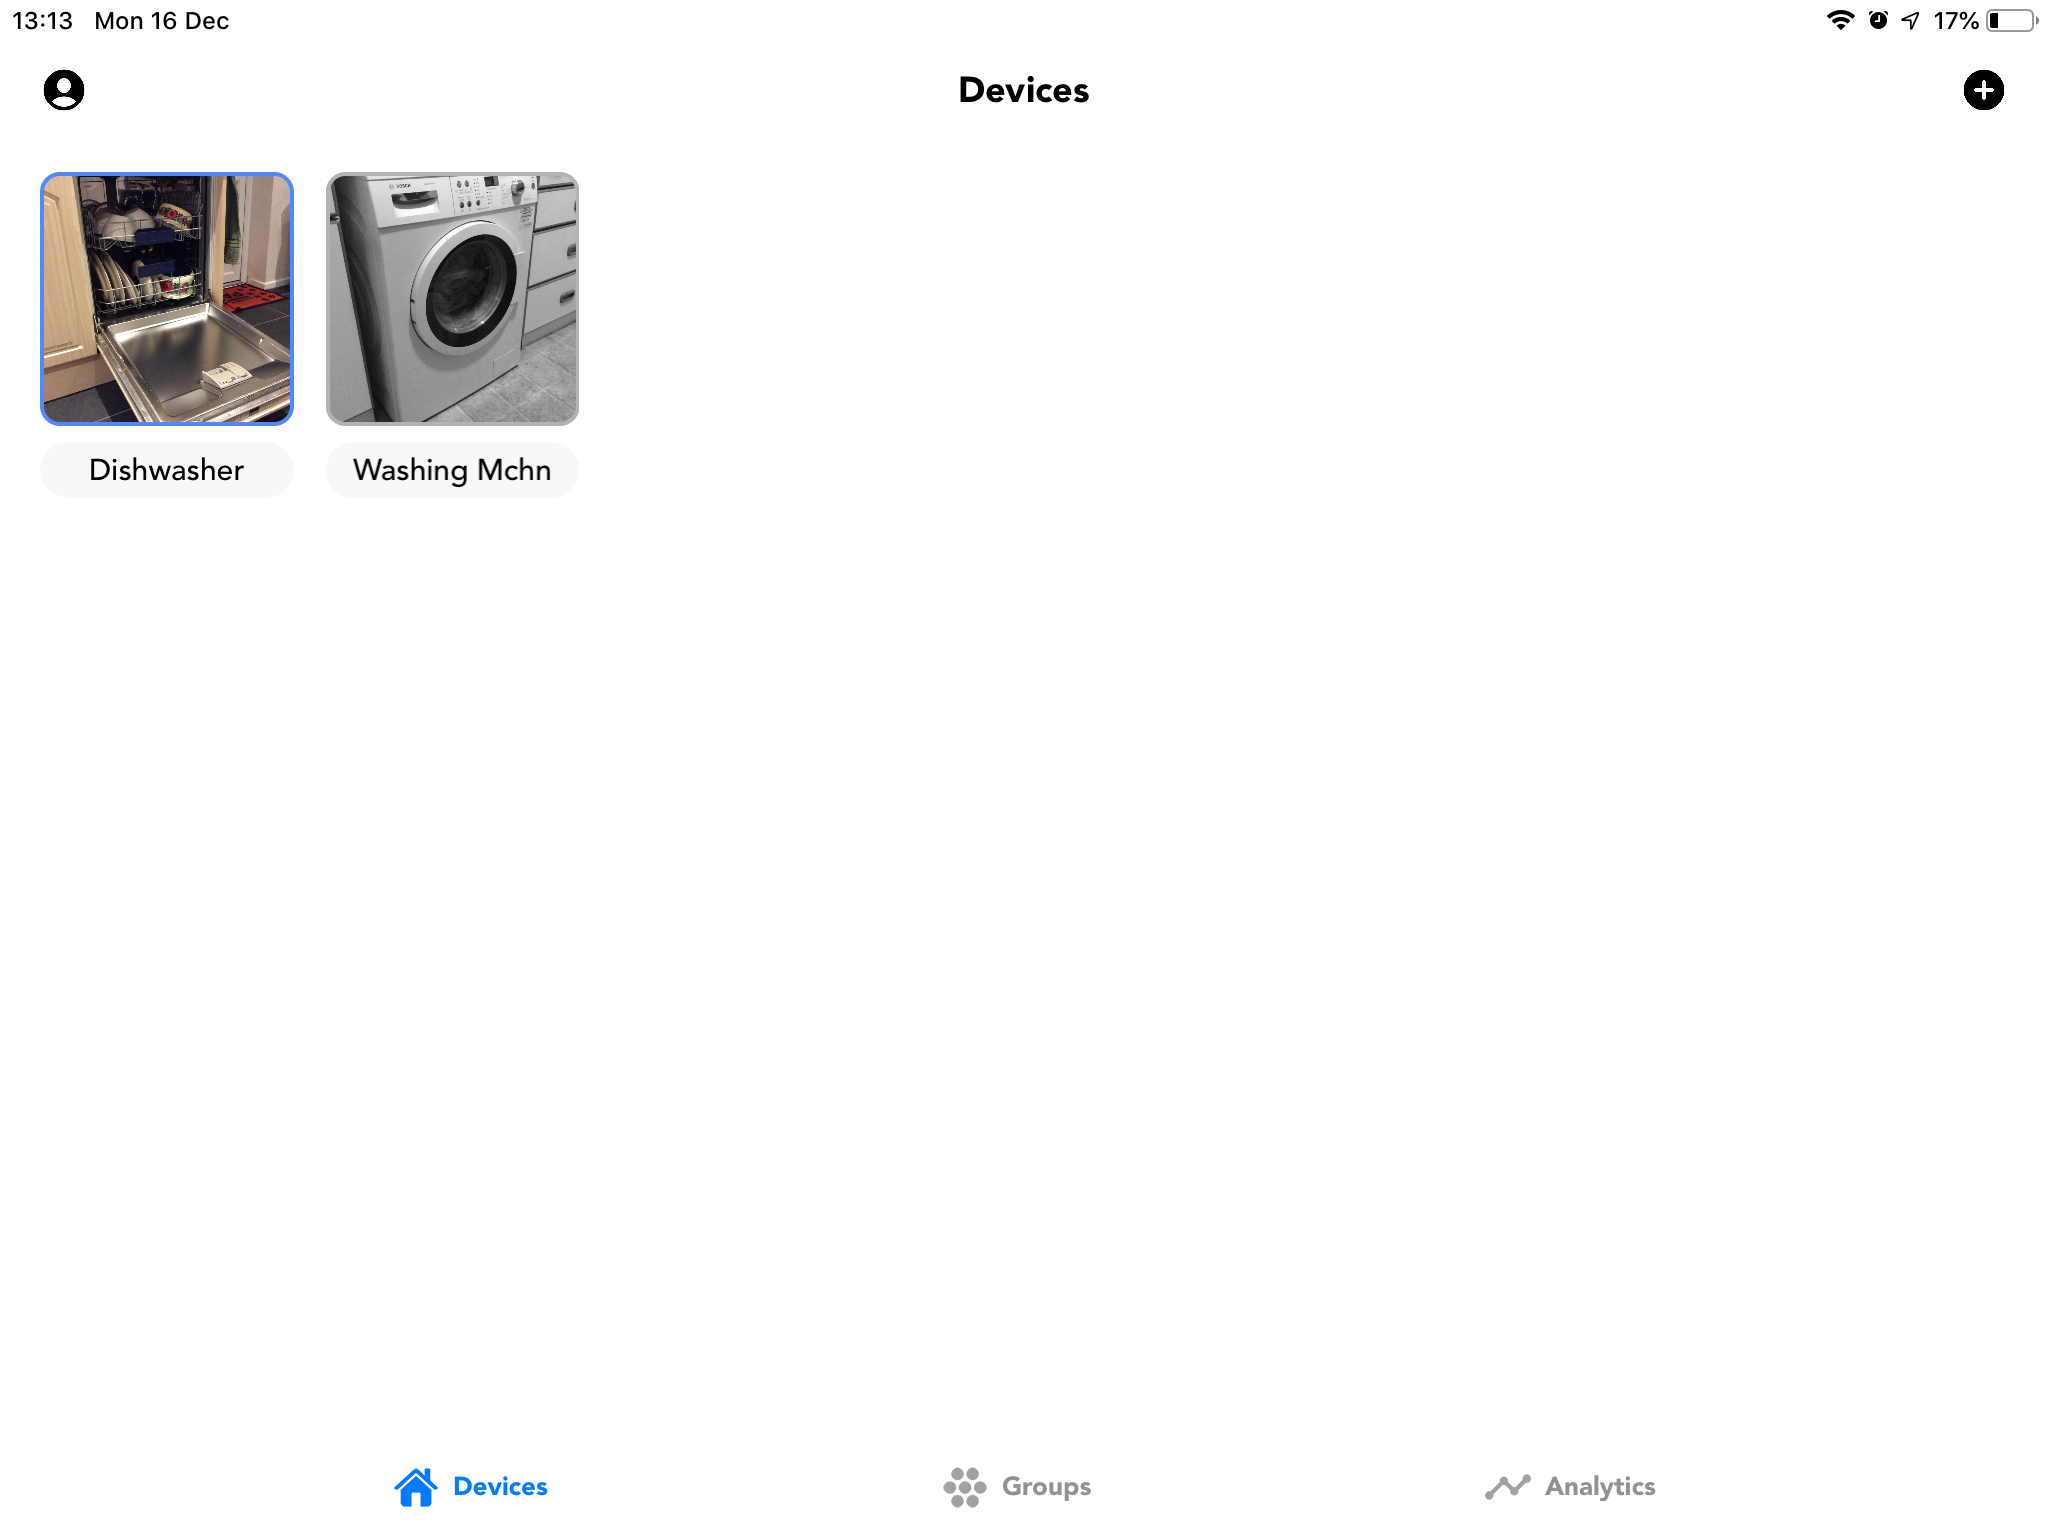
Now however I’ve also added the capability to adjust when the wet goods – dishwasher and washing machine – run as a function of expected solar panel output.
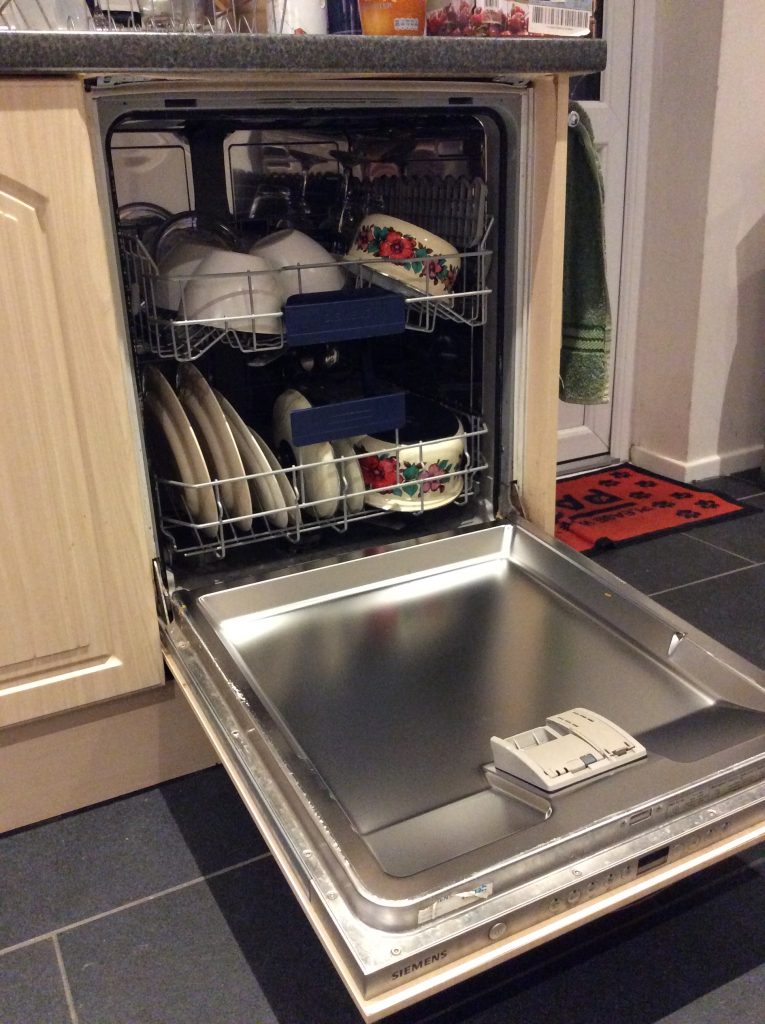
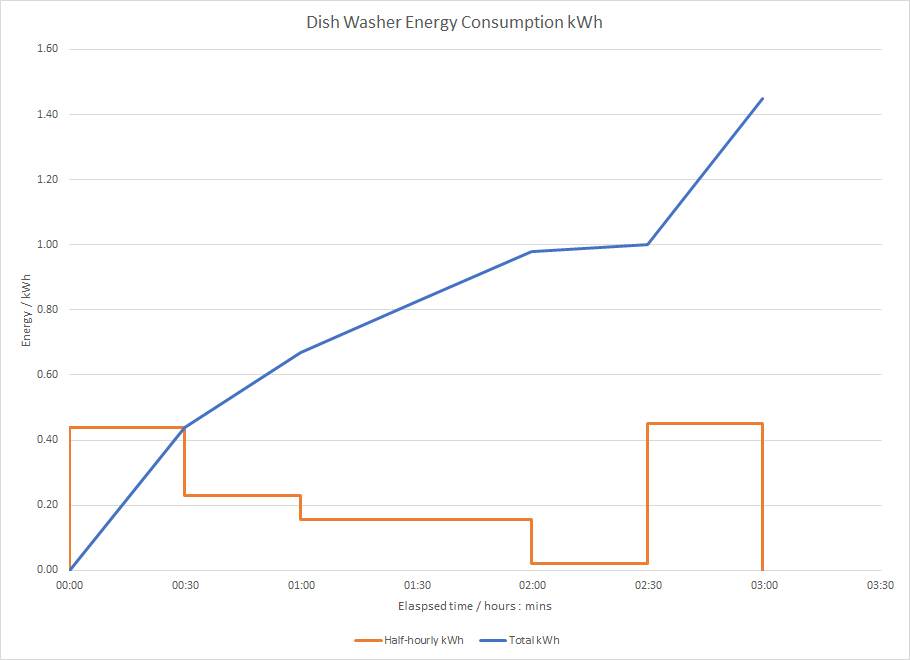
Siemens Dishwasher 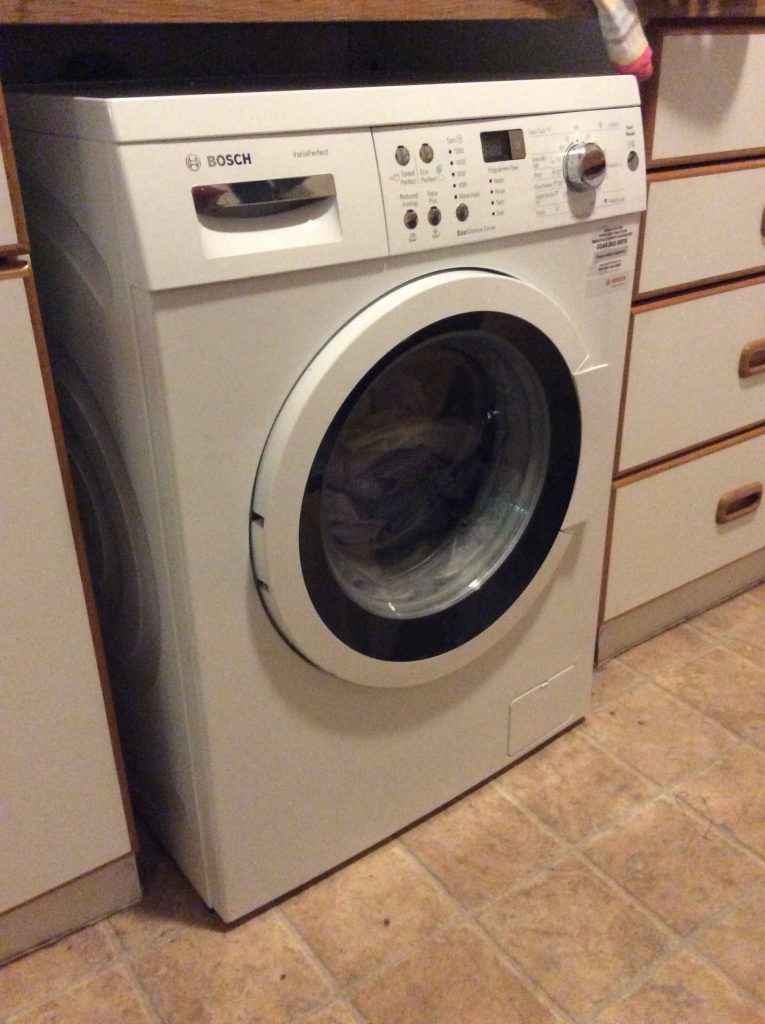
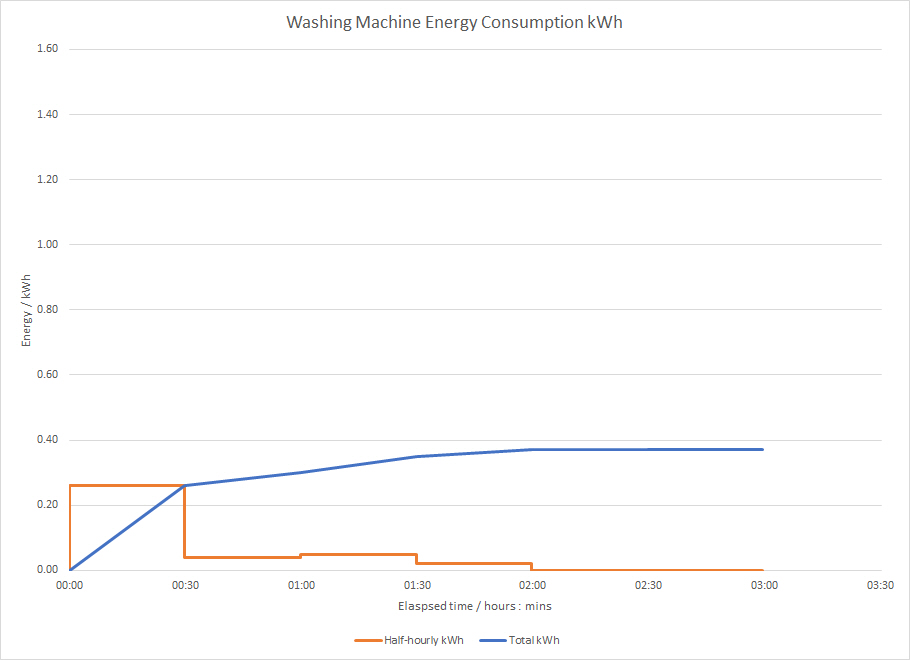
Bosch Washing Machine
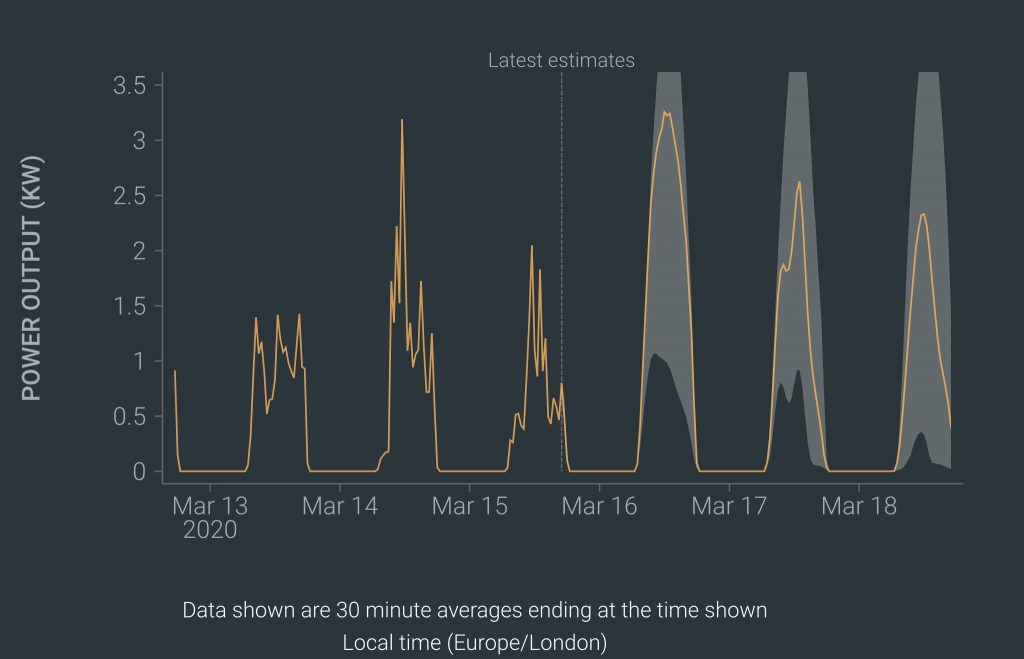
As with the battery controls, I don’t attempt to match generation half hour by half hour with device operation because of uncertainty around how precisely a solar forecast from the evening before will match actual solar production up to twelve hours later. Instead my solar algorithm extracts the number of hours of significant solar production and the earliest start time of that production. For the battery that information is used to modify the number of hours of battery charging to be bought from the grid and the end of the window during which those hours of charging may be bought. Now I’ve updated the controls for the wet goods similarly.
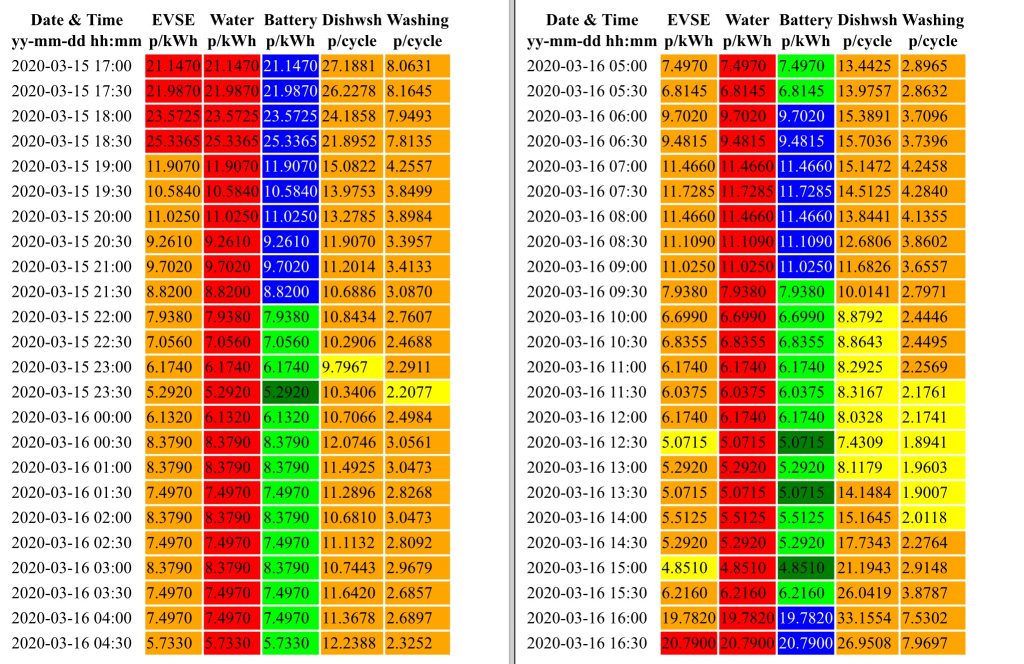
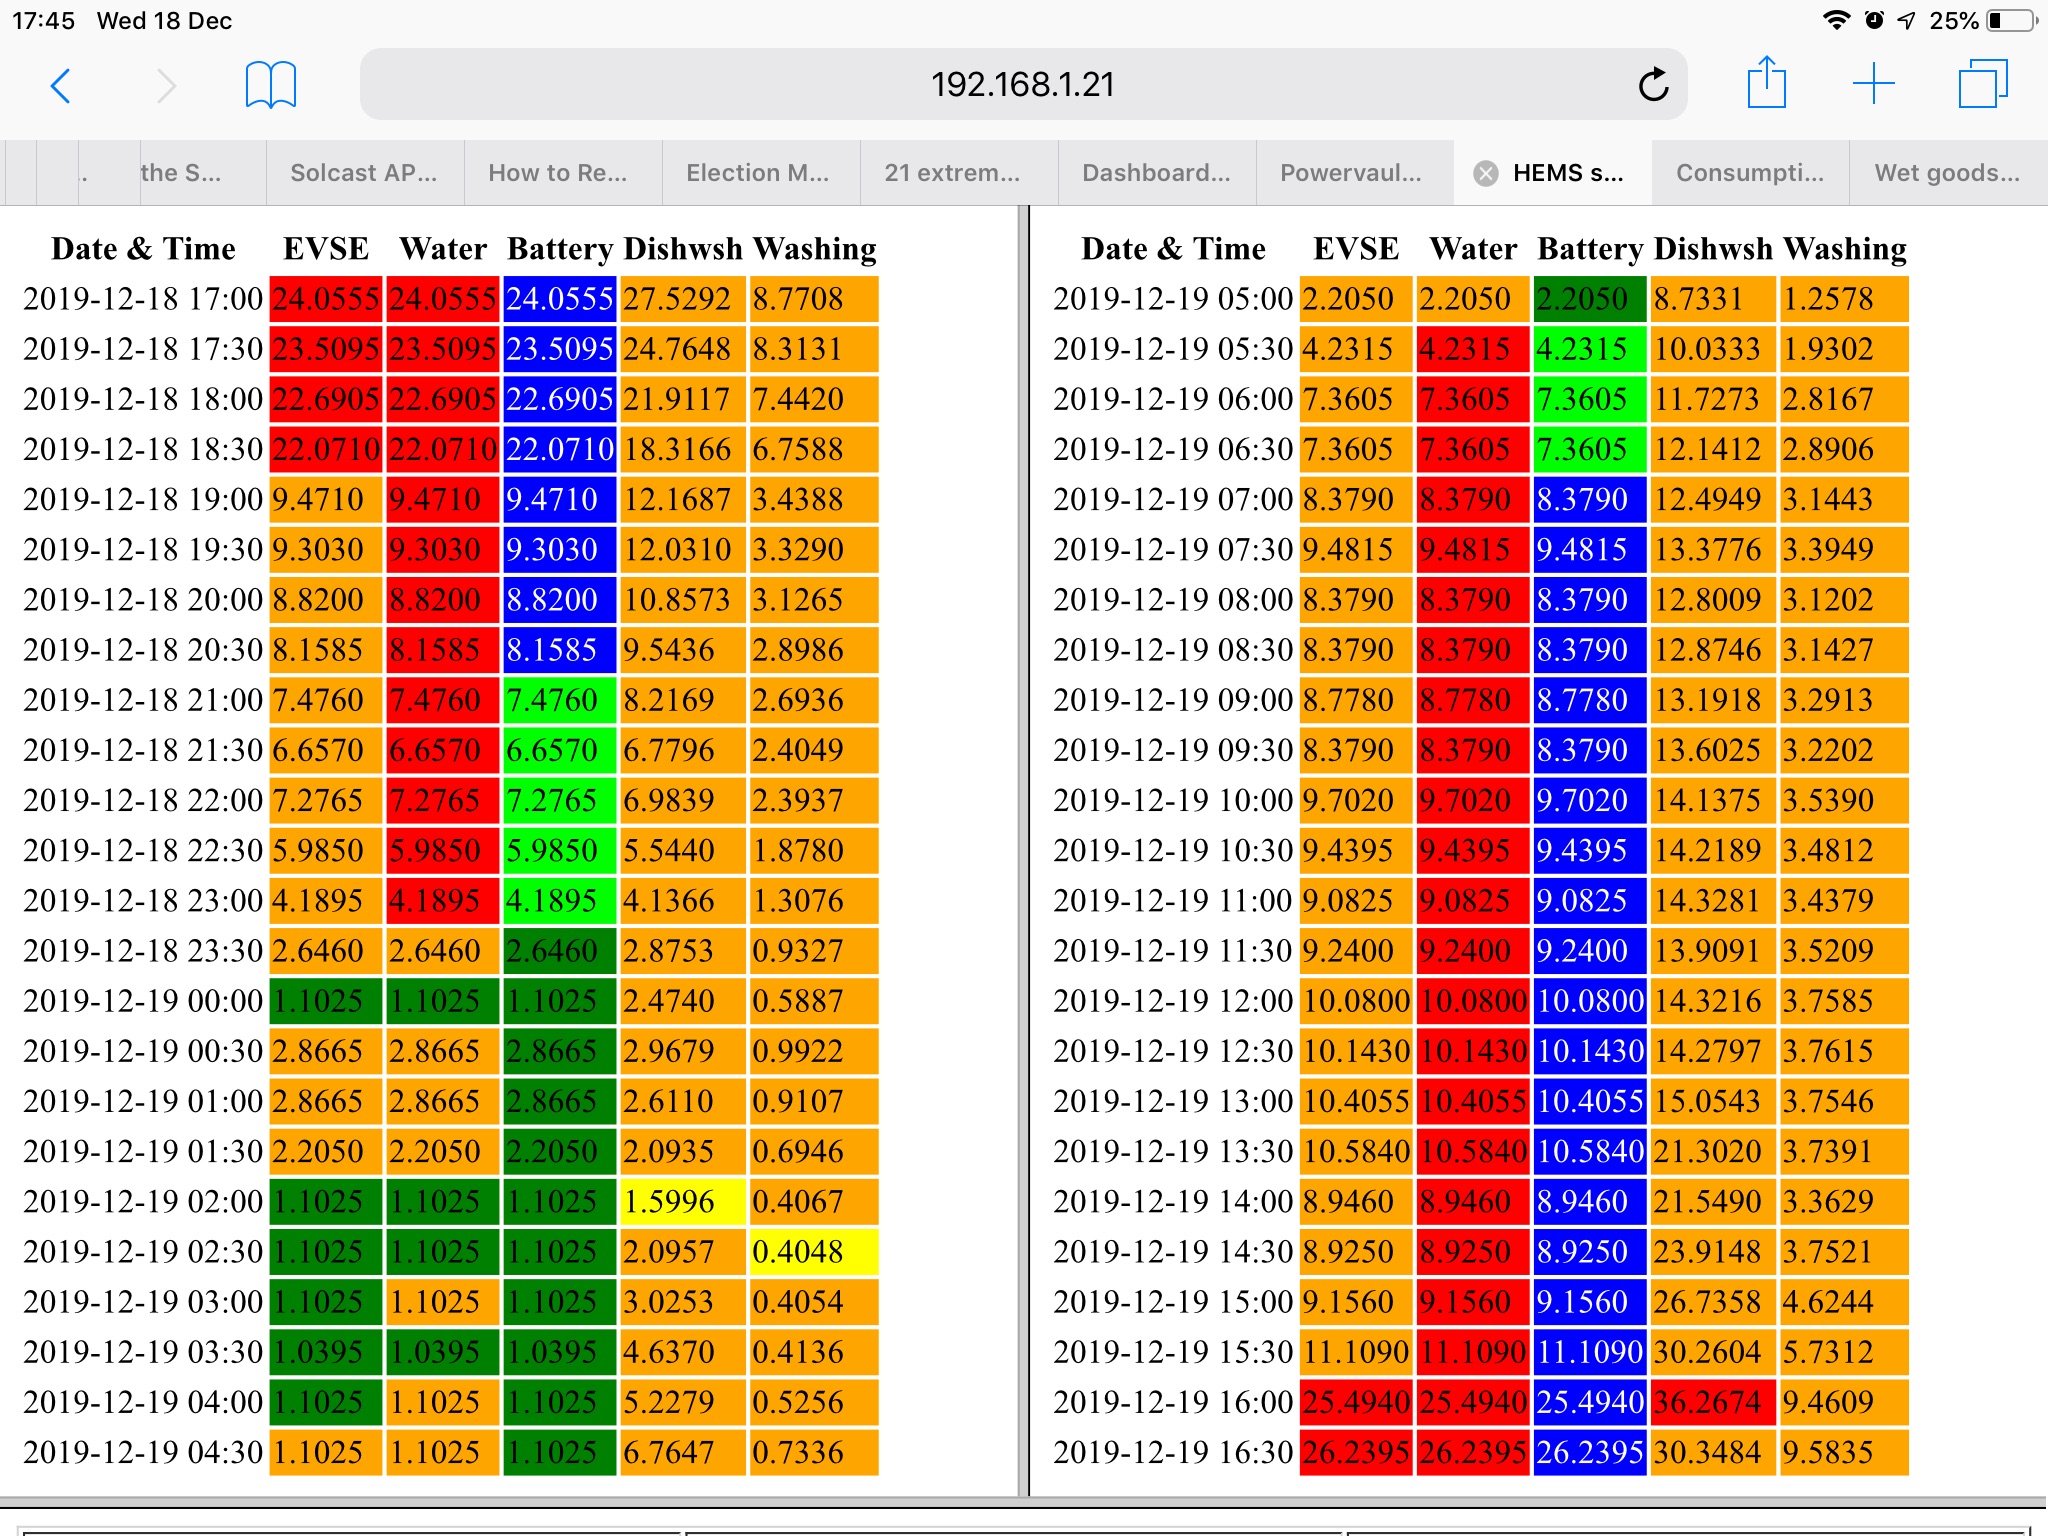
The existing wet good controls look to start the machine at the time when the electricity cost for the cycle is cheapest within a time window set by the user, so the user defines the earliest and latest acceptable start times and the algorithm finds the cheapest start time within that window. The updated wet goods controls assess the number of hours of solar charging available and if both (i) the window exceeds a certain size and (ii) the user’s time window includes the solar window then the user window is narrowed to start at the start of the solar window. The resulting start time between the start of the solar window and the end of the user window may not be absolutely the cheapest grid cost but my assumption is that the solar contribution (which could be up to 100%) will in practice make this the cheapest grid cost as any power needed from the grid will be at a relatively good price. If this start time in the solar window does not reflect absolutely the cheapest grid cost then a second start time may also be identified which is the cheapest grid cost.
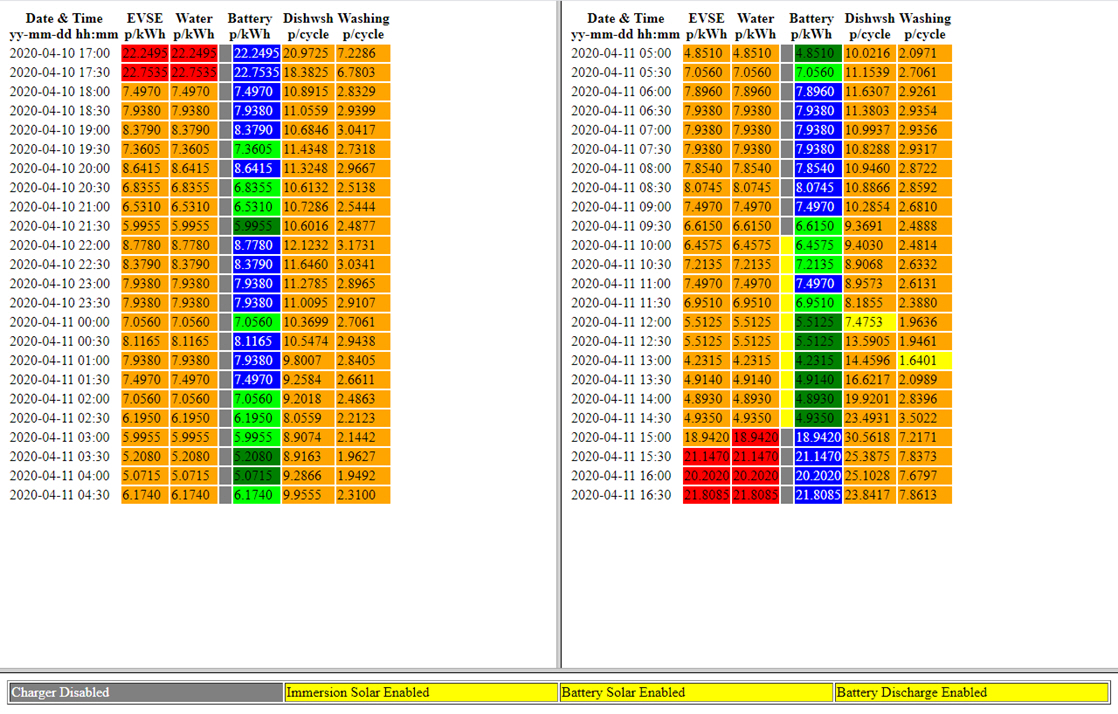
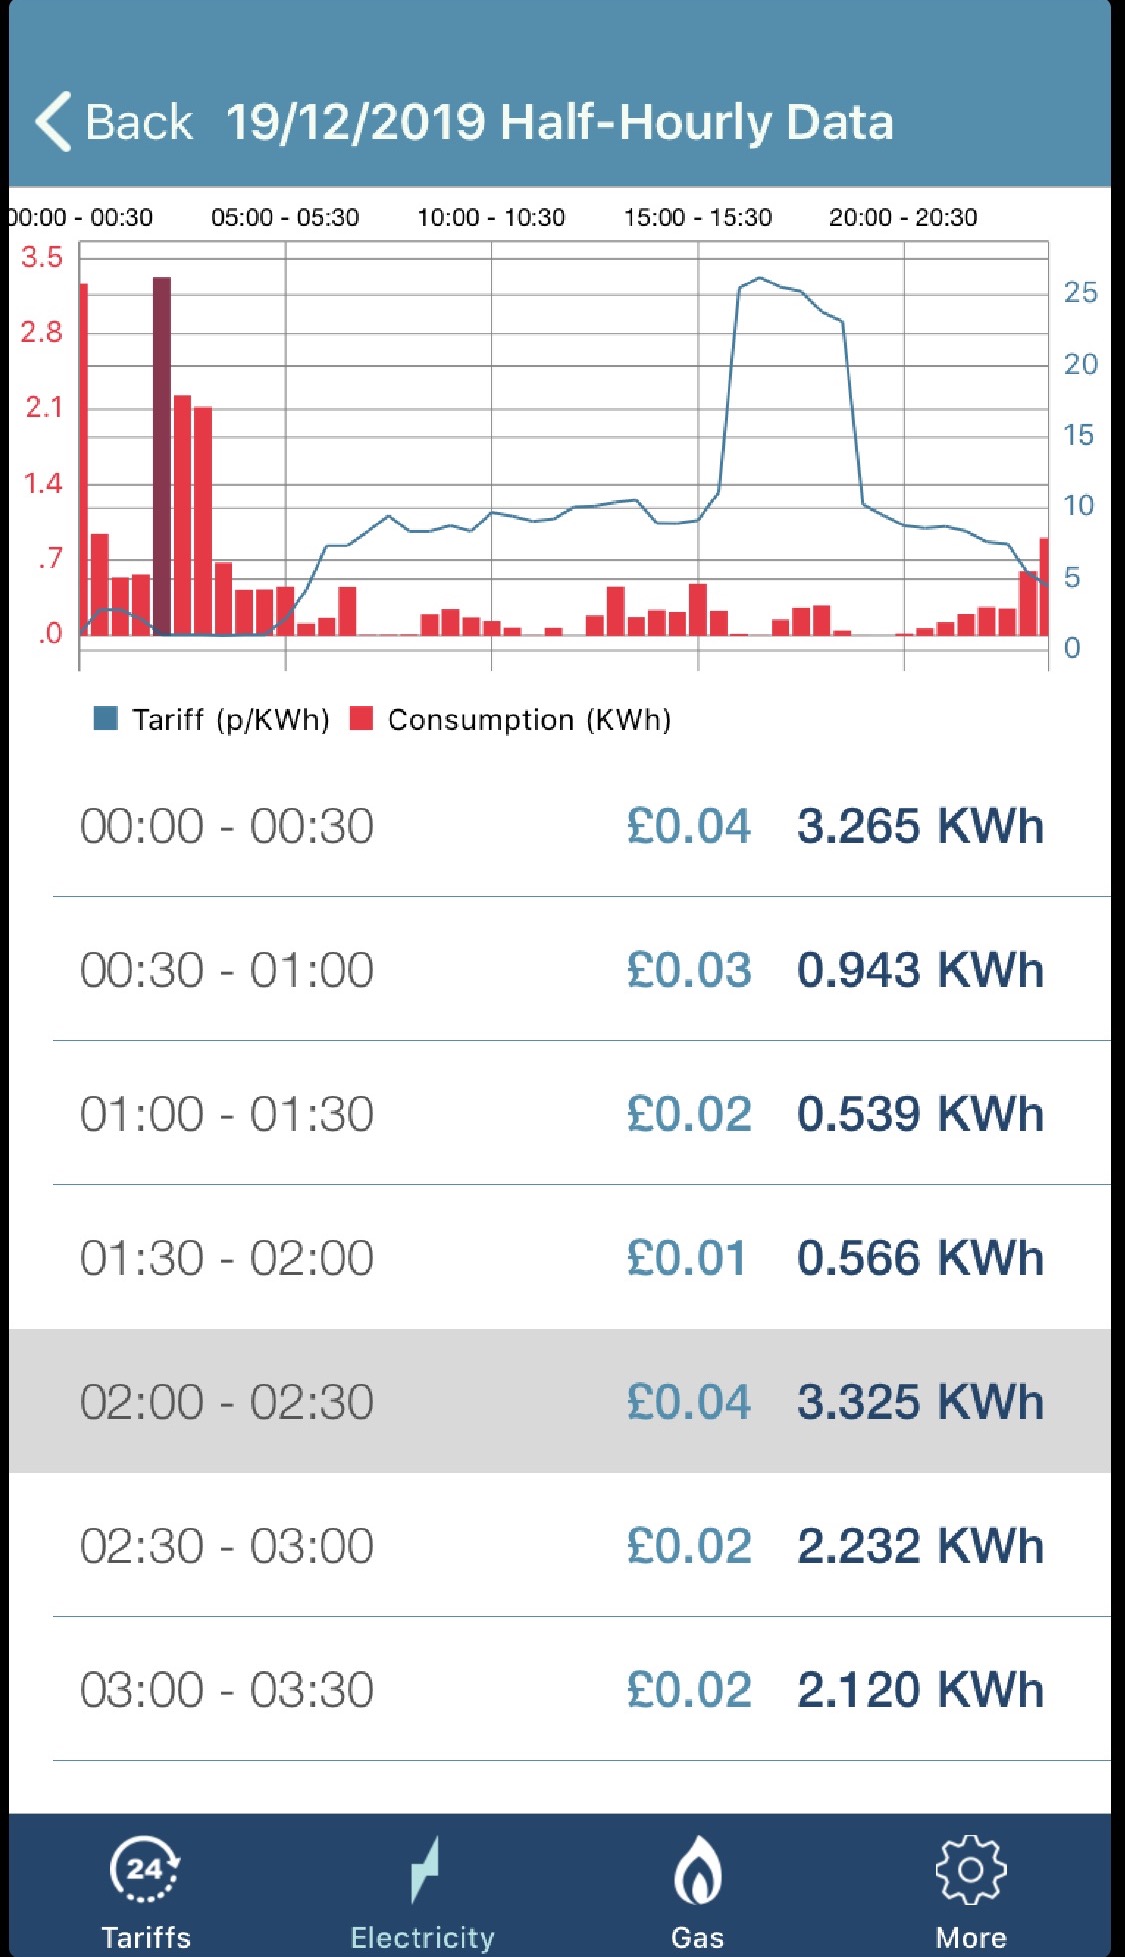
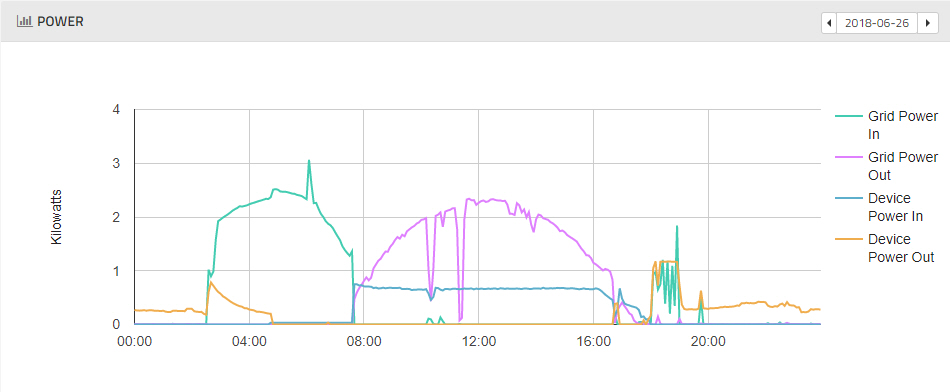
In the above example the start times are both within the solar window and the cheapest energy price, so no cheaper alternative is also offered. Start times within the solar window tend to be in the afternoon as the grid energy costs are lower. This also improves the probability that the battery may briefly discharge if the total load exceeds the solar output. However in the above example the energy price is so low that the battery is also force-charging (it’s dark green) so any surplus demand will come from the grid.
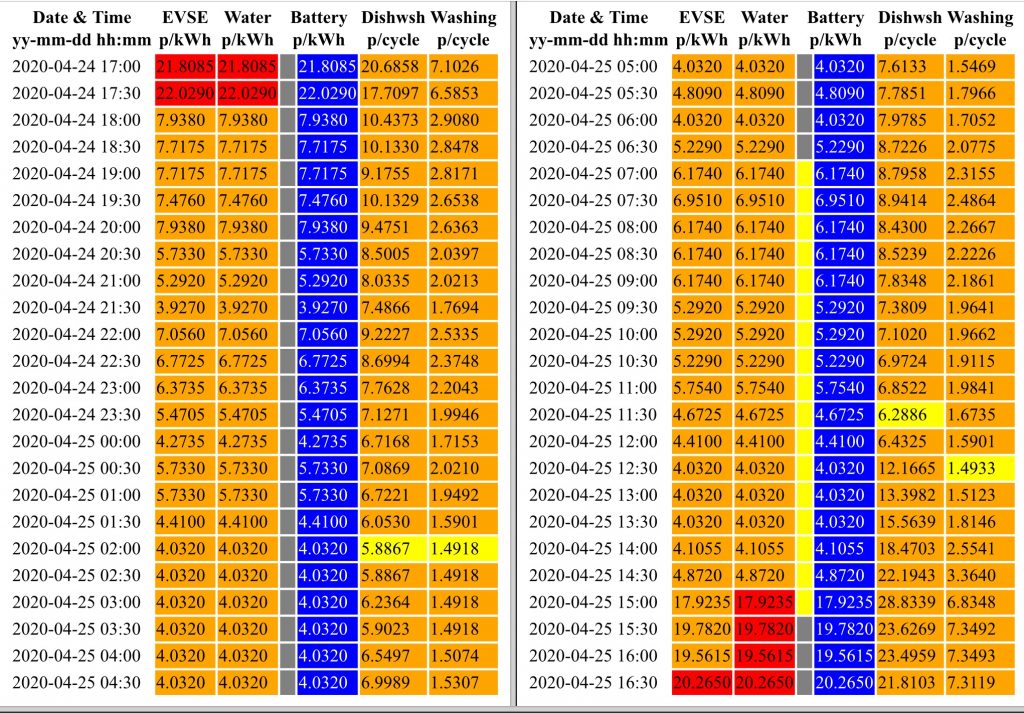
In the above example the cheapest time to run each cycle from the grid is at night, although given the availability of solar during the day then any small saving in grid costs at night is very likely wiped out by the ability to run some (if not all) of the cycle during the day from the solar surplus rather than the grid. Both start times are available – the absolutely lowest grid cost and the lowest grid cost during the solar window.
It’s probably also worth mentioning the implications of running the appliance alongside the battery status being different colours:
- Blue battery and state of charge being at or over 80% – appliance is prioritised over battery allowing battery to discharge to meet appliance needs as required – least likely to draw anything from grid (but likely highest cost to draw from grid)
- Light green battery or (blue battery and state of charge being below 80%) – appliance is prioritised over battery charging alone (so battery may not discharge to support appliance) – a little more likely to draw anything from grid (but likely mid cost to draw from grid)
- Dark green battery – battery charging and appliance are equal priority – most likely to draw something from grid (but likely cheapest cost to draw from grid, even to the point of being paid to draw from grid at times)