Category Archives: Water heating

HEMS in action

Yesterday provided a good example of my HEMS in action as the electricity price dropped quite low due to stormy weather conditions. Normally at this time of year the HEMS isn’t doing much with the storage battery as daytime solar output is enough to fully charge the battery, but yesterday low pricing was enough to automatically enable both battery charging and water heating overnight. Car charging was due to run anyway driven by the demand for an hour of charging, but battery charging and water heating was triggered by the low price rather than a needed to take power for a pre-defined period of time.

HEMS schedule 9th August

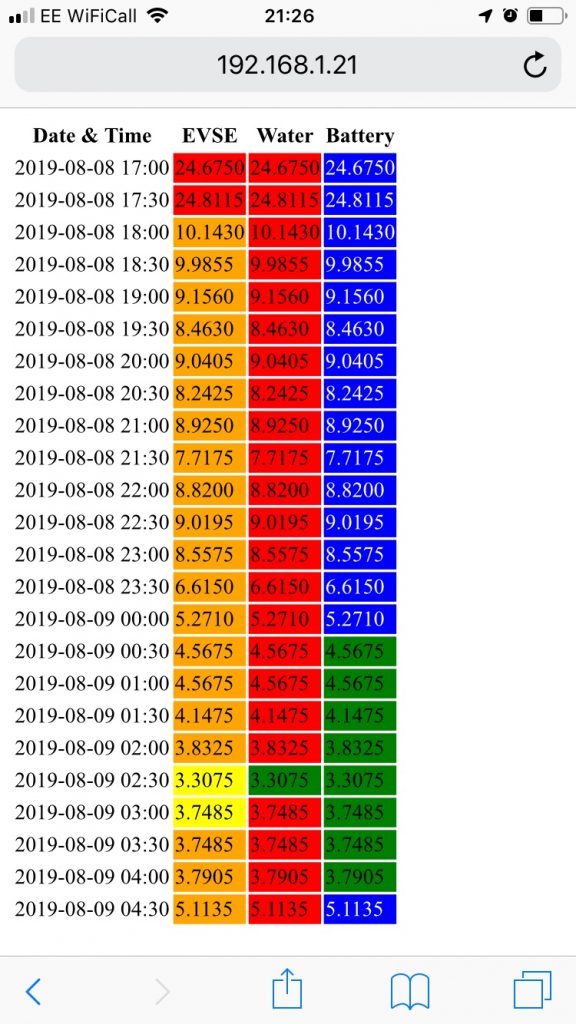
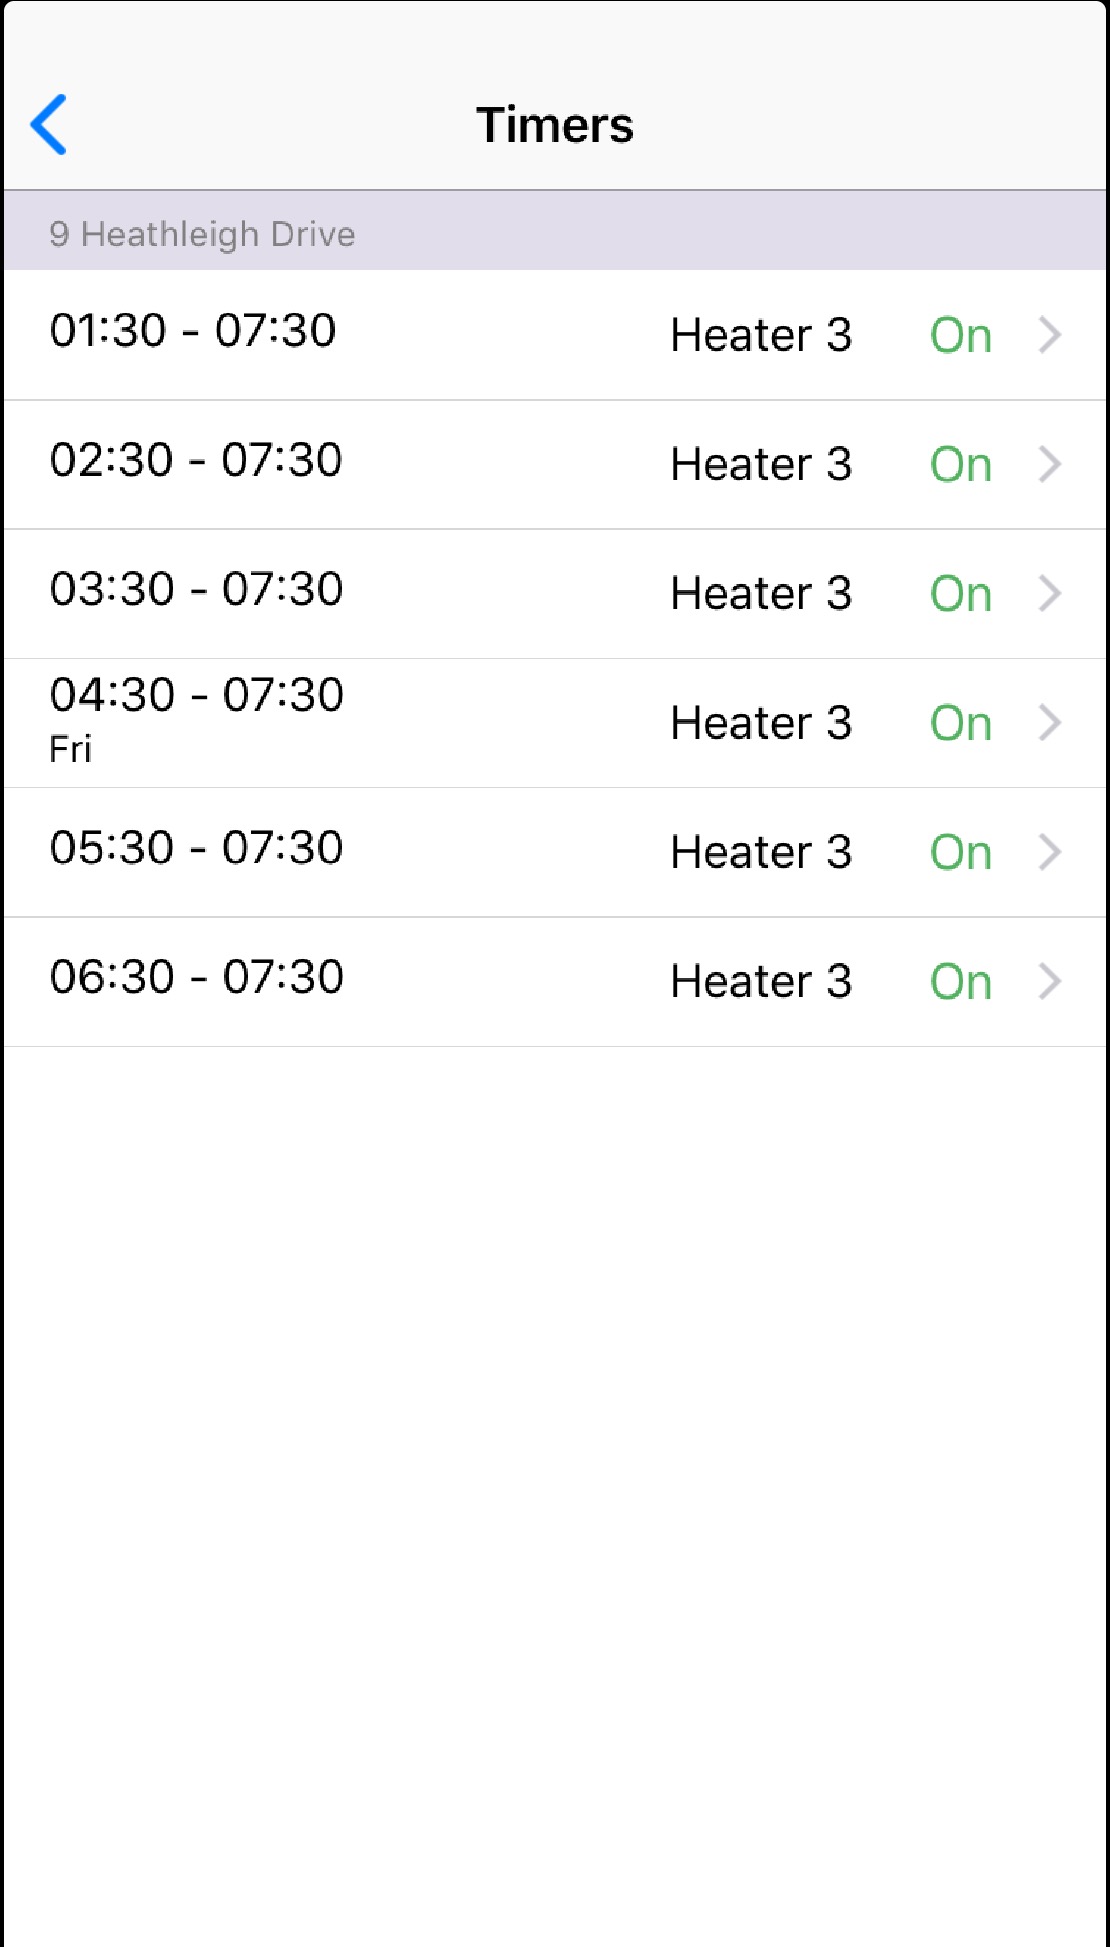
The screenshot above from my phone shows the HEMS’ plan for the the early hours of the 9th. The first price column shows one hour of car charging at the cheapest price. The second column shows half an hour of water heating as the electricity price has fallen below 3.5 p/kWh when it is assumed to be cheaper than gas. The third column shows four hours of battery charging when the electricity price is below 5 p/kWh.

Metered electricity consumption (HAN side) 9th August

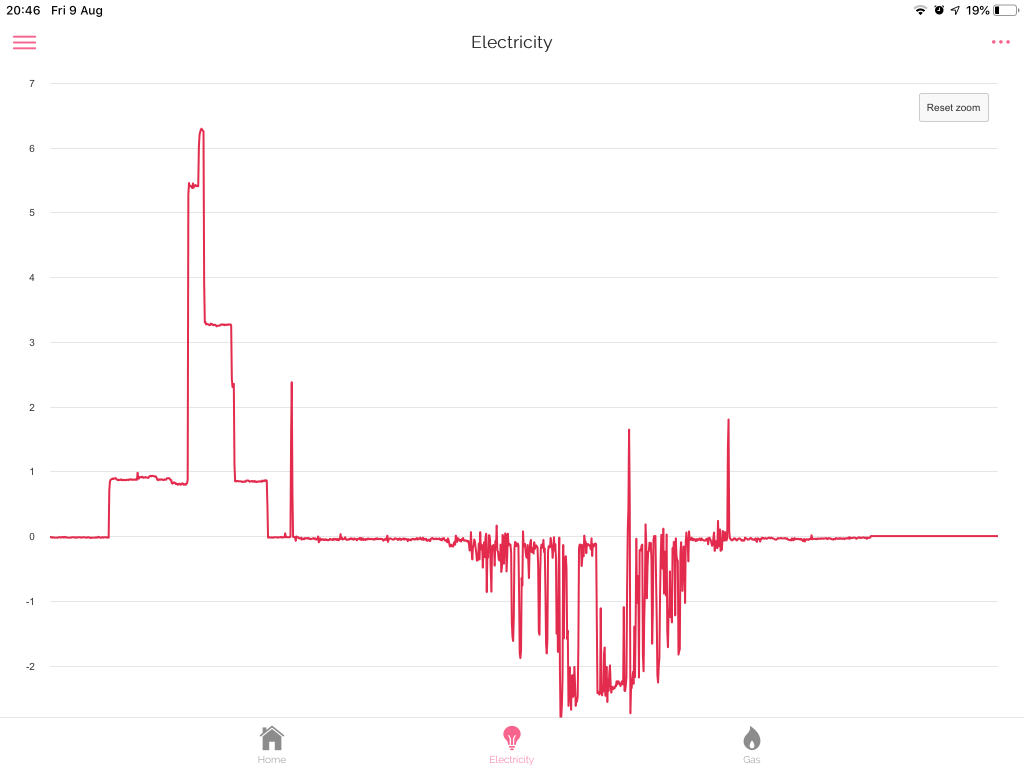
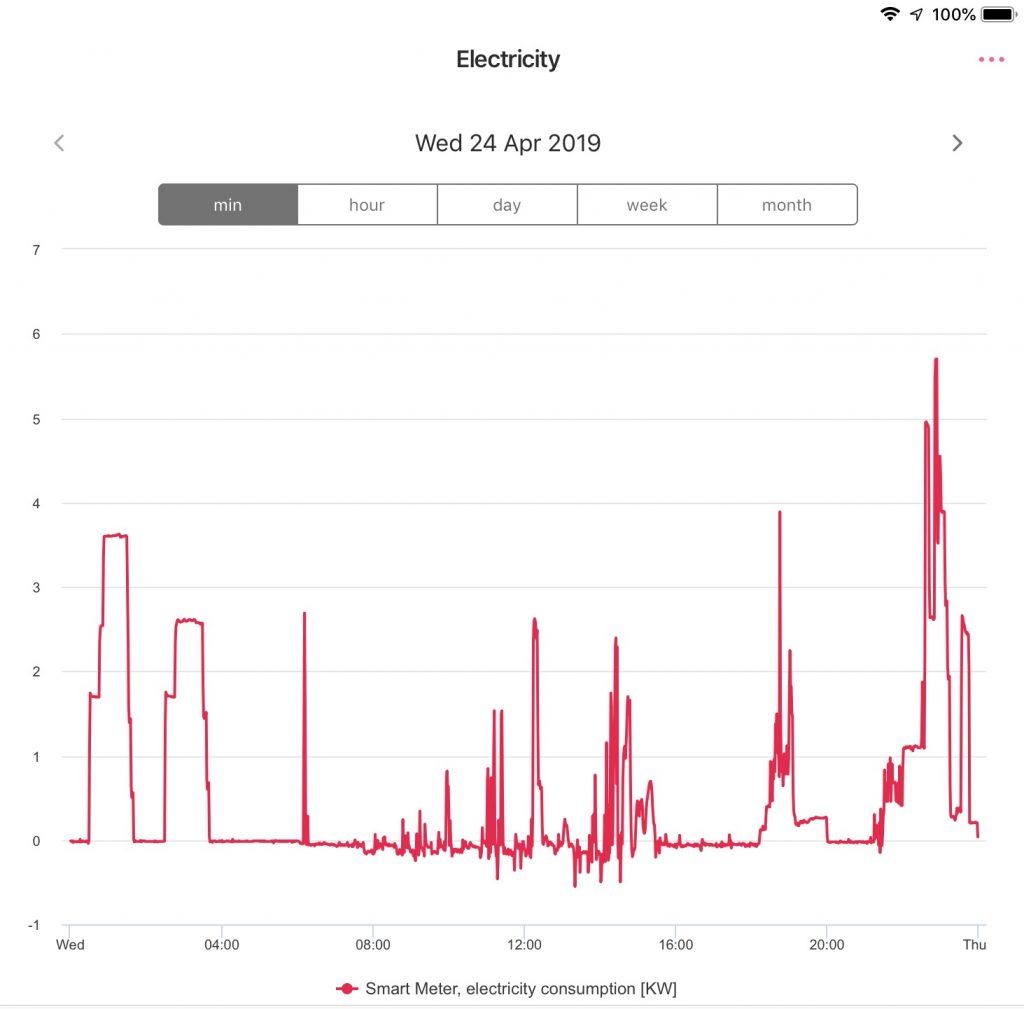
The above image from the HAN side of my smart meter shows the energy consumption of the house varying through the night in response to these requests from the HEMS – battery charging at the widest point, car charging above that for an hour, and water heating above that for 30 minutes.

Half-hourly metered consumption (WAN side) and electricity price for 9th August

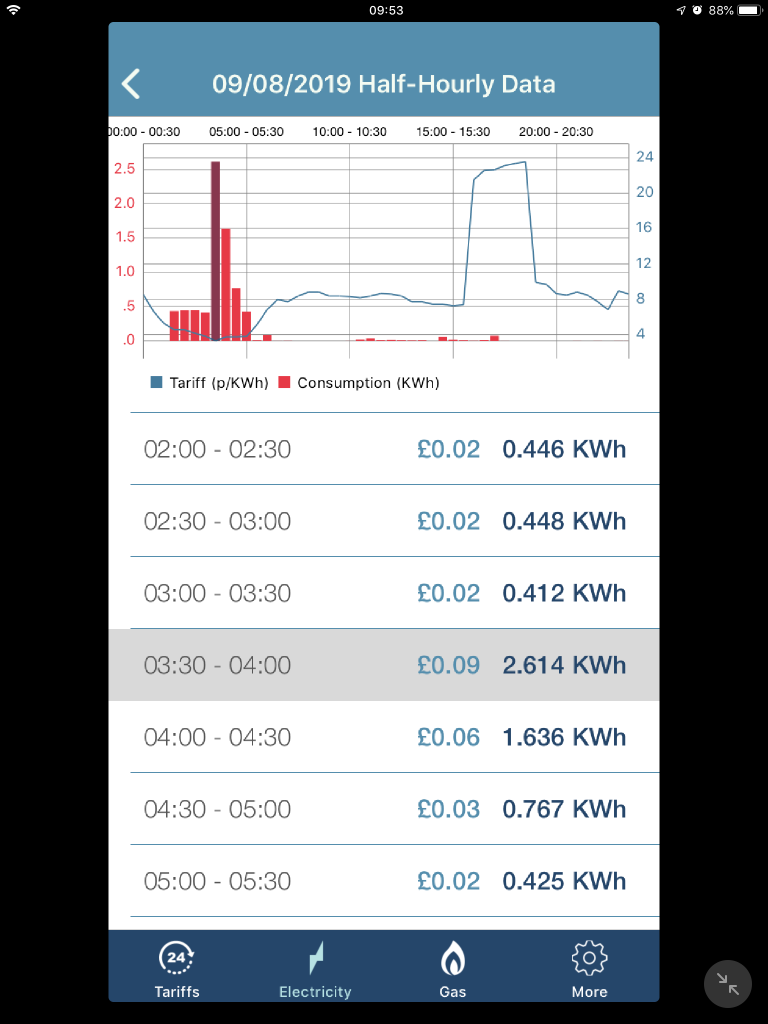
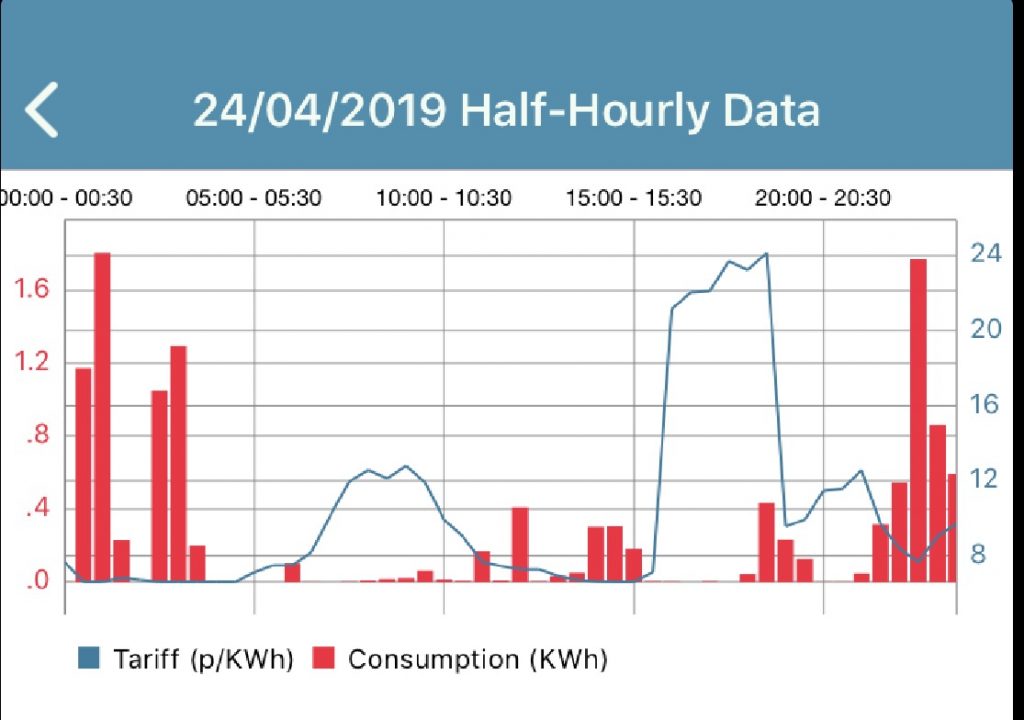
Finally this image shows the energy consumption versus price data for the same period shows how the action of the HEMS increases electricity demand as the price drops. Indeed on this day there was virtually no consumption at any other time.

For August 9th as a whole I paid 52 pence for 7.547 kWh of electricity. Taking off the 21 pence for the standing charge leaves 31 pence for the electricity kWhs alone, an average of 4.11 p/kWh.

The Big Picture

After a series of quite detailed posts, I think that the time has come for an updated high level overview of what we have.

Heat loss from the home

We moved to our early 1970s house almost 4 years ago bringing with us our electric vehicle. The house had already been refurbished with new double-glazed windows, had cavity insulation (although that wasn’t recorded on EPC so must have predated the prior owners), and a token level of loft insulation. The existing gas boiler was arthritic, couldn’t heat the whole house, but was quite good at heating the header tanks in the loft! We had gravity-fed gas hot water (i.e. no thermostat or pump on the cylinder) which was completely obsolete, the cylinder dated back to the building of the house and had no immersion heater (although we had the wiring for one). So what did we do?

Space heating:

Eve Thermo eTRV
  • We substantially increased the loft insulation to reduce heat loss.
  • We had a modern condensing gas boiler installed to improve efficiency.
  • We updated to smart controls using eTRVs to set both temperature set points and schedules at room level. I built a smart interface to the boiler so that heating can be enabled remotely. I programmed a series of rules into Apple Home allowing the smart thermostats to enable the boiler when any thermostat wants heat and disable it when no thermostat wants heat. Some rooms also have additional rules linking heating to open windows or movement sensors. All of this reduces heat losses by only heating rooms that are (or will be shortly be) in use.

Electricity supply:

Solar panels
  • We installed our own solar panels given 4 kWp generation. (I also own a small share of a solar farm although there’s no contract that I’m aware of between that farm and my home energy supplier)
  • I invested in an immerSUN to maximise self-use of our own solar by enabling loads when surplus solar is available.
  • We switched to a green electricity supplier so when we need to buy electricity it comes from renewable sources.
  • We bought a small storage battery 4 kWh to store some of our solar production for use later in the day. Subsequently I can also use it in winter to buy when the electricity price is relatively low to avoid buying when the price is relatively high.
  • We chose a dynamic smart tariff to buy electricity at the lowest price based on market prices established the day before. The prices change each half hour and are established in the late afternoon on the day before.

Water heating:

Hot water cylinder
  • We replaced the old hot water cylinder with a modern insulated one (to reduce heat loss) with a low immersion heater (to allow more of the water volume to be heated).
  • Our principal water heating is now by diverting surplus solar electricity proportionately to the immersion heater, that’s backed up by the gas boiler which is enabled briefly in the evening for water heating in case the water isn’t yet up to temperature, and when the electricity price falls below the gas price I can enable the immersion heater on full power.
  • All accessible hot water pipes are insulated.

Electric car charger:

Electric car charger.
  • I built my own electric car charger that takes an external radio signal to switch between four settings 0, 6, 10 and 16 Amps to help me adjust consumption to match to availability of output from my solar panels. (Subsequently such products were developed commercially with continuously variable current limits, but the limitations of my immersun and on/off radio signal don’t allow me to go quite that far. Having said that my car only does 0, 6, 10 and 14 Amps so I would gain no benefit from a continuously-variable charger paired with a 4-level car).

Smart electricity controls:

Smart controls
top: HEMS (to manage bought electricity) and junction box
mid: radio transmitter (to car charger)
bottom: immersun (to manage self-consumption)
  • We have two systems for smart control of electricity:
    1. The immersun to maximise self-use of our solar electricity by proportional control of loads.
    2. A HEMS to manage the purchase of electricity (when necessary) at the lowest price by maximising consumption when the price is lowest.
  • When both systems want to enable loads (because the bought price is low and we have a surplus from our own panels) then cost is prioritised, so we’ll buy from the grid any demand not being met from our own panels.
  • Both systems are linked to 3 devices:
    1. Battery storage. The immersun is configured to work alongside the battery storage with the battery storage as the top priority to receive surplus solar PV. The HEMS can switch the status of the battery as required to charge from the grid when the price is lowest, or to discharge when the price is highest, or indeed to revert to default behaviour.
    2. Car charger. Second priority for the immersun after battery storage.
    3. Immersion heater. Third priority for the immersun after car charging.

The future

I have no firm plans for the future. I’m toying with adding to the HEMS various features including:

  • Making the display switch between GMS and BST as appropriate (it’s all UTC at the moment).
  • Edit configuration via the web interface rather than a virtual terminal.
  • Control a domestic appliance. Our washing machine was replaced relatively recently, but the dishwasher is playing up a little and may be a candidate for HEMS integration where the optimum start time is selected to deliver lowest energy price.

Different perspectives

The above images show four different perspectives on the same day of data (April 24th) from different sources within the home.

Smart Meter HAN

Firstly, the Smart Meter HAN image shows bought electricity to the home. Each smart meter sits on a Home Area Network (HAN) which is how the In-home display provided with the meter gets its data. The in-home display is an example of a Consumer Access Device (CAD). In my case I also have a Hildebrand Glow Stick as a CAD. The Glow Stick, which looks something like an oversized USB stick, also connects as a CAD to the smart meter allowing the meter to be read. An associated app, Hildebrand’s Bright, allows the Glow Stick to be read via the cloud. In principle the Bright app can display either energy in kWh or cost, but in my case can only display energy in kWh as Octopus don’t push the price data into the smart meter so energy cost always reports as zero. The data is presented by the minute.

Smart Meter WAN

Secondly, the Smart Meter WAN image shows the same data but from the perspective of the Wide Area Network (WAN) whch connects the smart meter to the energy retailer (Octopus for me). This half-hourly data is reported via the Octo Watchdog app. The data reported is cost per kWh (the blue line) and energy consumer / kWh (the red columns). The energy data in the red columns follows that of the red line in the prior illustration but in lower resolution (half-hourly versus minute-by-minute). You can clearly see most energy being bought when the price is lowest.

Powervault

Thirdly, the Powervault image shows grid in/out and battery in/out. The green grid-in line mimics the red data from the above images. The battery in/out data is solely visible in this image. The resolution is good enough to see shorter events like kettle boil cycles.

Immersun

The final image, from the Immerun, is probably the most useful although it lacks energy price and hides battery in/out within the House data (hence ‘House’ being zero at times). The immersun alone reports output data from the solar panels and diversion to the immersion heater. It also lumps the car charger energy within ‘House’, indeed none of these views can directly report the car charger behaviour although its the dominant energy consumer here.

I’m planning to construct my own view showing all the different prices of data together in one place. I already have access to:

  1. The Immersun data via the same API called by their app. I came across a blog post that described how to do this.
  2. The Powervault data API (I only have a control API at the moment) which should give me battery in/out (at least I’m on a promise of the API at the moment).
  3. The Hilbebrand data which duplicates the Powervault Import/Export at the moment, but has the potential to provide independent monitoring of my car charger.

In principle then that would leave me able to report 3 x energy sources (grid, panels and battery; of which grid and battery would be bi-directional) and report 3 x energy consumers (car, water heating and home).

Home Energy Management System (HEMS) hardware

My current energy management arrangements are designed to maximise use of the output of my solar panels for lowest energy cost by diverting any excess to PowerVault storage system, car charger or immersion heater.  I can also manually configure the PowerVault and ImmerSUN to minimise costs of bought energy from the grid (I get 7 hours of cheaper night time electricity) by setting time periods for charging.

However as I move to a smart meter and smart tariff then I’m looking to start automating the selection of when to draw power from the grid based on costs that change half-hour-to-half-hour and day-to-day.  The hardware to achieve this is illustrated here.  To the right is a Raspberry Pi – a small computer with a wide range of connectivity – and to the left is a module that sIts on top and has four relays able to switch mains loads, although at the moment I only anticipate needing 2 of them.

One of the relays will switch the boost input to the ImmerSUN to enable water heating, potentially when electricity is cheaper than gas, and a second relay will operate the transmitter that turns the car charger on alongside the ImmerSUN’s relay output during the cheapest available energy times.

The image to the right shows the timers that can be used to enable the ImmerSUN outputs to draw power from the grid.  I never use this for water heating as currently gas is always cheaper than bought electricity, but do use it to more or less effect seasonally to charge the car from cheap night rate power when there isn’t enough daytime solar.  For the new HEMS I plan a table of 7 days specifying the number of hours required for each output and let the HEMS find the cheapest half hours to deliver the total hours required and enable the charger or water heating as required.

Gas Usage to July 2018

This chart shows our gas consumption by month and year since we moved here in August 2015 (the first full month shown is September 2015),  Along the way several changes are marked which might be thought to influence gas consumption, although with natural variation month-to-month and year-by-year the effect of those changes isn’t dramatically obvious.

What is of course obvious is the dramatic difference in gas consumption between summer and winter as gas is our main means of space heating, and there’s no need for space heating in summer.  Most homes would exhibit such a pattern.  Ours is probably a bit more marked than many because of our water heating.  Many homes with gas will use the gas for both space and water heating, but for us the gas water heating is the back-up not the primary water heating system.  Our home is set up to divert surplus solar electricity from the PV panels to water heating during the day.  Only in the evening is gas water heating enabled and then it does no heating if the water is up to temperature.  The gas water heating thermostat is also set a few degrees colder than the immersion heater, so gas is separated from electric water heating by both time and temperature to prioritise electricity.

Previously I had just disabled the boiler in summer, but occasional dull days would leave my wife complaining about lack of hot water.  The new arrangement with the boiler operating later and with a lower temperature set-point has avoided that and is robust as long as your hot water cylinder is big enough for your daily needs so you only need to fill it once with hot water which is then stored available for use until the next day.

Over time 3 changes are called out which should reduce gas consumption further:

  1. In December 2015 we replaced the boiler, hot water cylinder and controls.  The previous boiler had demonstrated that it was incapable of heating the whole home as we went into our first winter so a replacement was rapidly arranged.  The new boiler is considerably more efficient which should reduce gas consumption for a given heat output, but it now heats the whole house, so that might counteract the improved efficiency.
  2. In late 2016 we upgraded the loft insulation from 100 to 270 mm which should be worth £73 in gas per year according to our EPC.  February, March and April 2017 do seem to show some benefit compared to 2016, but then there also variation in the weather year-to-year.
  3. In May 2017 we started adding smart heating controls which has gradually expanded over the following months.  The overall concept here is that most rooms now have smart radiator valves which are both thermostatic and contain their own schedule.  The schedules allow rooms to be heated for fewer hours: for example lounge not heated on weekday mornings, playroom not heated after children’s bedtime etc.

Clamp orientation for ImmerSUN and PowerVault

In the last few days I’ve been assisting a reader of this blog who also has an ImmerSUN immersion heater controller plus PowerVault storage battery combination.  Like me, he had the immerSUN first and later added a PowerVault, but had immediately disabled the ImmerSUN to get the PowerVault to work.  Left to their own devices, the ImmerSUN will normally take the surplus power first before the PowerVault has chance to respond since it has a more dynamic control system, however economically it makes more sense to prioritise the PowerVault.

I previously posted on this topic in Prioritising smart loads for self-consumption but wanted to provide more clarity on the orientation of the clamps.

Both ImmerSUN and PowerVault rely on current clamps to get their control signal. Such clamps fit around an electrical cable and measure the flow of electricity through that cable.  Normally clamps for both these devices alone would be around the live in the incoming mains cable, but do that with both and the ImmerSUN will always take the available power first which is undesireable.

The illustration shows my solution, as per the prior post, where the PowerVault clamp surrounds both the incoming live and the live output to the immersion heater.  If the clamps are correctly orientated, this allows the PowerVault storage battery to be prioritised over the ImmerSUN immersion heater controller.  When the PowerVault clamp surrounds the two cables, it is important that outgoing power to the grid and outgoing power to the immersion heater from the consumer unit pass through the clamp in the same direction.  This solution should work for clamp-driven solutions too.

The PowerVault clamp is directional – it has an arrow which should point towards the consumer unit.  That means, if you pair the two cables as I described, so outgoing power flows in the same direction in both cables through the clamp, then the arrow should point in the opposite direction i.e. towards the consumer unit.

Fundamentally it doesn’t matter which way the ImmerSUN clamp faces, as during commissioning the ImmerSUN will work it out by cycling the power several times, but you shouldn’t change it after commissioning.

Solar PV Installation – 2 years on

The end of 2017 sees 2 full calendar years of output completed (plus a few months at the end of the prior year) so it seemed like a good time to assess performance and return.  Return comprises two parts – firstly the payments received for electricity generation (and export) the so-called feed-in tariff or FiT and secondly the savings obtained from using that free energy myself instead of buying it from the grid.  In my case I can use and store my solar electricity directly, or use it to heat water via the immersion heater thus replacing gas.

I’ve summarised the status in the following table:

Nominal20162017
Generated366840564033kWh
FIT£629.36£639.61
Electricity self-use50%41%64%of Generated
183416632596kWh
£159.65£251.12
Gas replacement27%23%of Generated
1095941kWh
£41.20£27.66
Export50%32%12%of Generated
Return in calendar year£830.46£918.40
13.6%15.1%of PV cost
Return cumulative£830.46£1748.86
13.6%28.7%of PV cost

Summary:

  • Output from the panels was slightly reduced in 2017 versus 2016, but still significantly above the performance projected in the quotation.  I put the slight reduction down to year-to-year differences in the weather.  Over time I would expect panel output to decline, but I think it’s too soon to attribute any decline to this.
  • Income from FIT was slightly higher as inflation on the price / kWh has overcome the slight output reduction.
  • Electricity self-use is up considerably from 41% to 64% due to my 4 kWh storage battery.  The costs of that battery are not reflected in the table.  Return would have been 8.8% in 2017 (rather than 15.1%) if the cost of the battery was included.
  • Gas replacement is down from 27 to 23% versus 2016 as more of the electricity from the panels is used for high value activities like charging the storage battery or my electric car, and less is left over for water heating.  The low price of gas per kWh makes gas replacement my lowest priority for self-use.
  • Exported electricity (i.e. what’s left-over that I cannot use myself) is considerably reduced from 32 to 12% largely as a result of increased electricity self-use.
  • Financial return in calendar year 2017 is improved from 13.6 to 15.1% neglecting the costs of the battery, or reduced from 15.1 to 8.8% taking into account capital costs of the battery.
  • It will take approximately 7 years (i.e. 2 past + 5 future years) for the combination of the solar panels and battery storage to pay for the solar panels (neglecting the battery costs), and a further 2 years of system savings to pay for the storage battery.

Electricity use 2016

The immerSUN provides a useful app showing electricity use which includes an annual option.  The graph below shows the 2016 annual data:
Although some of the data was only collected from mid-March 2016, the graph still shows useful information. I think that the graph overstates bought / imported electricity in January to March but understates generated electricity proportionately in the same period.

The purple line shows monthly electricity consumption and is broadly consistent month-to-month.

The green line shows the generated electricity from the solar PV system.  Its seasonality is clearly visible.  Solar generation exceeds electricity use in four summer months, and is very close in a fifth.

The red line shows bought electricity.  It’s generally a mirror image of the green line reflecting more purchased electricity in winter and less in summer, but is not zero even in months where generated electricity exceeds used electricity due to time of day issues – cooking and car charging often occur at times when solar output is low such as cooking in the evening and charging at night.

The blue line shows surplus day-time electricity being used to heat water, and thus saving gas.

The turquoise line shows surplus day-time electricity being exported once the water has reached its set point.

It will be interesting to see how this changes in 2017 as a result of a full year of solar car charging in its current mature condition and with the new battery storage that should help get more of the generated electricity used by saving it for evening use.

Best use of generated power (cont.)

In order to illustrate how the combination of battery and immerSUN distributes generated electric power at different levels of generation I created this chart.

For different levels of power generation across the bottom, the chart shows how the power is divided between battery charging (and occasionally discharging), electric car charging, and water heating; which are generally prioritised in that order. My prior post explained the rationale for the 500 Watt switching threshold for the vehicle charger – based on 1.4 kW of mid-value car charging being better value than a mix of 800 Watts of high value battery charging and 600 Watts of low value water heating.

Alternatively you might like to consider that the horizontal axis represents passing time after daylight comes and that the chart shows how diversion changes as the sun reaches its zenith.  You might then view the end of the day as a mirror image of this as the output of the panels ramps down in late afternoon, although at the end of the day there’s the greatest possibility that one or more of the storage devices is/are full and thus the greatest chance of electricity being exported.

Of course all of this assumes that the storage devices aren’t already full, and indeed that the electric car is present at all. As storage devices fill, or indeed if the car is absent, the system automatically switches to the next best value alternative:

  • Battery full – more car charging and/or water heating.
  • Car full or absent – more battery charging and/or water heating depending on power output.
  • Hot water at maximum temperature – this is the lowest priority electricity use so when this is full we don’t currently have another use to divert power to. However there is an unused output on the immerSUN so it would be possible to drive another load. The underfloor heating in the kitchen would be a possibility, although there’s unlikely to be much overlap between days when there’s enough surplus to reach this point and days when kitchen heating is required so it may never repay the cost of fitting the cables.

Best use of generated power

Over the last few days I’ve been rethinking the best use of generated power.
The prioritisation of battery charging over water heating is clear due to the significant cost difference between day time electricity and any time gas, but the situation on car charging is more complex. It occurred to me that there could be times when prioritising battery charging and water might not always be the lowest cost solution since car charging avoiding mid-price nighttime electricity might be a bigger saving than a lesser amount of high value battery charging combined with low value gas-replacement.

For example, if we look at the lowest level of EV charging that amounts to about 1.4 kW. With our night-time rate of 7.87 p/kWh, 1.4kWh of solar power used for car charging saves 11.0 p of night time electricity.  If the battery is maxed out at 800 VAh that saves 7.34 p of later day time electricity. The water heating using the balance of 0.6 kW saves a further 1.76 pence of any time gas. Thus the total save from 1.4 kWh used for a combination of battery charging plus water heating is 9.1 p, compared to 11.0 p from car charging – so it would appear to be better value to do 100% car charging when a 1.4 kW surplus exists.

A bit of further analysis aimed to establish the point at which it became better value to charge the car, rather than combine battery charging and water heating, even if that involved a small level of mains import. The answer is that, with my energy costs, it makes sense to enable 1.4 kW of charger when 1.3 kW of export would have existed thereby potentially importing 0.1 kW. In practice this 0.1 kW may be supplied by the battery.

Given that the battery has priority by the way it’s wired, and takes up to 800 VA, then I intend to try a 500 W export threshold to start the car charger since 800 VA + 500W ~ 1.3 kW.