We will shortly have been in this house for six years. During that time I have created three smart control systems that improve my energy costs or efficiency:
- heating controls to minimise gas purchase
- self-consumption controls of the electricity generated by my solar panels to maximise value of self-consumption
- smart tariff controls to buy grid electricity at the lowest price
Heating Controls
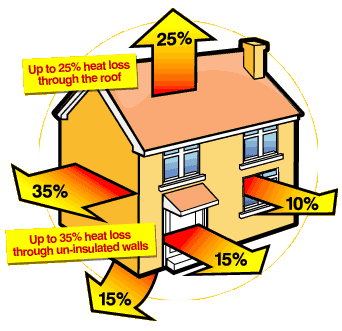
Most homes have a single heating zone with one timer and potentially one thermostat controlling the whole house with perhaps some thermostatic radiator valves (TRVs) capping the temperature in specific rooms.
By contrast we have seven heating zones created by electronic temperature control valves (eTRVs). Each zone has its own timer. There is no central timer or thermostat. Each eTRV can summon the boiler on when cold rather than simply cap the maximum temperature like a TRV.
Some rooms also have links to other smart devices such as disabling room heating when the window is open or turning off heating early when there’s no movement in the room.
The intent is to save energy by only heating rooms that are in use.
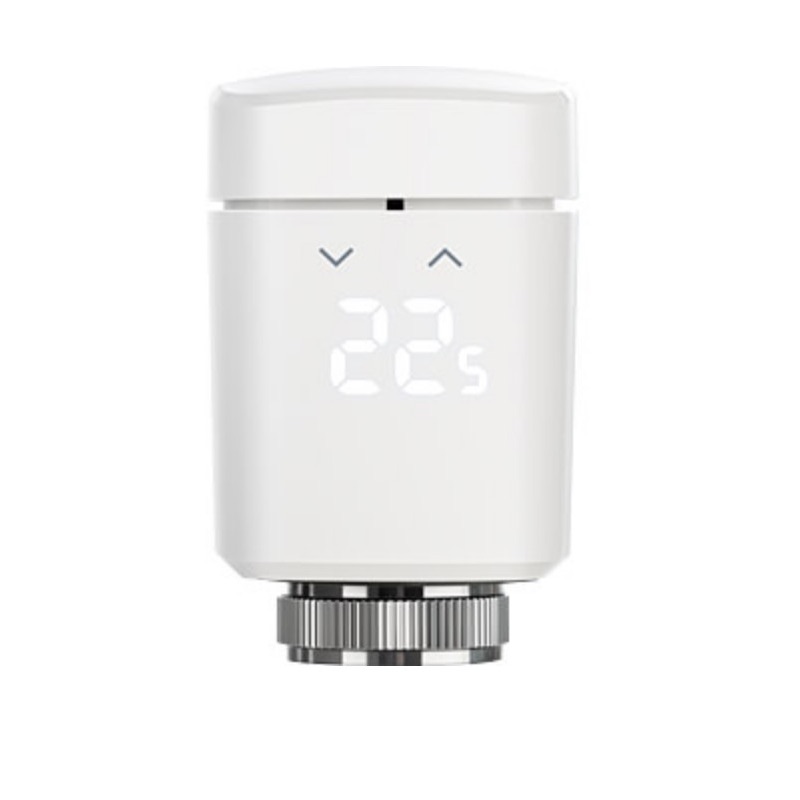
New Eve Thermo eTRV 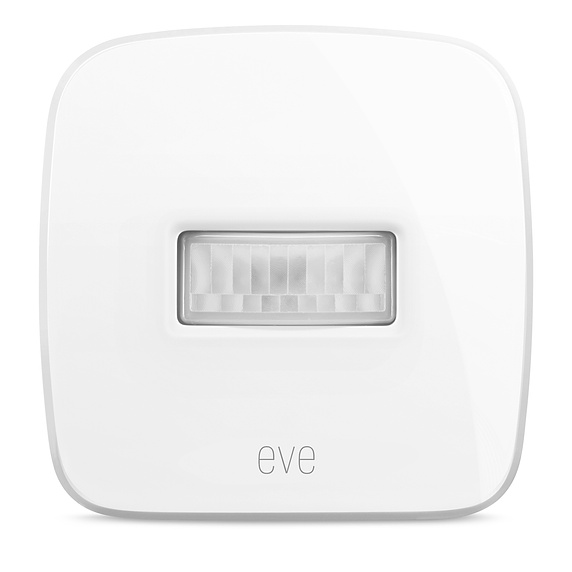
Eve Motion 
Eve Door and Window 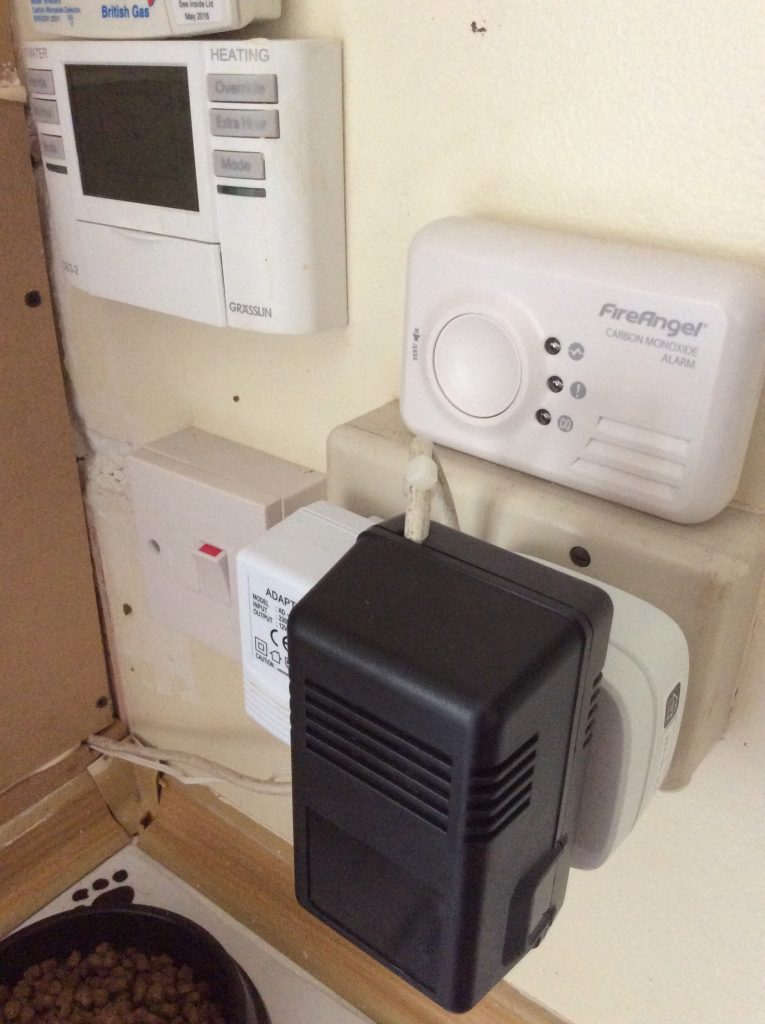
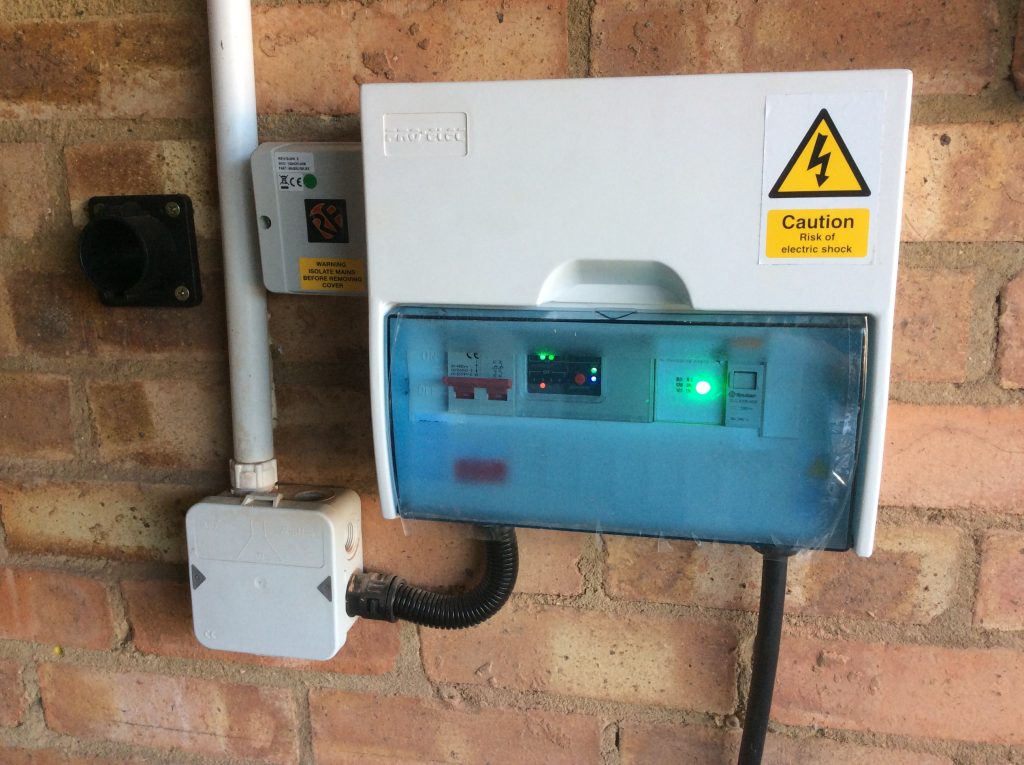
Boiler control


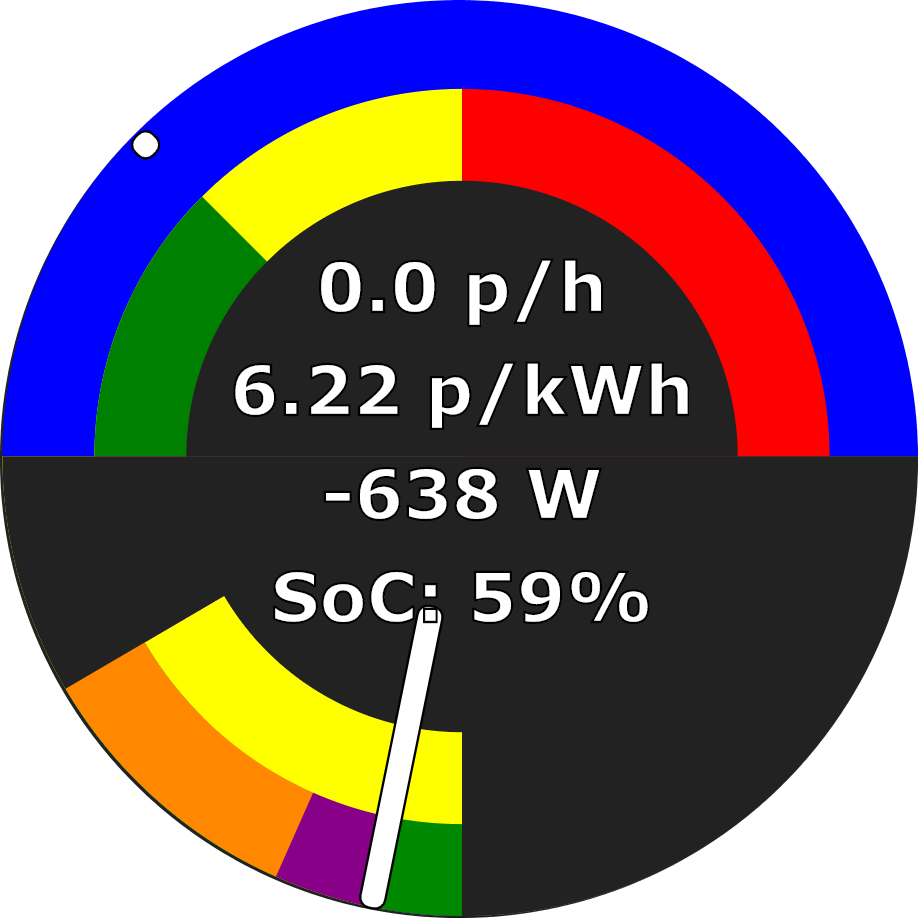
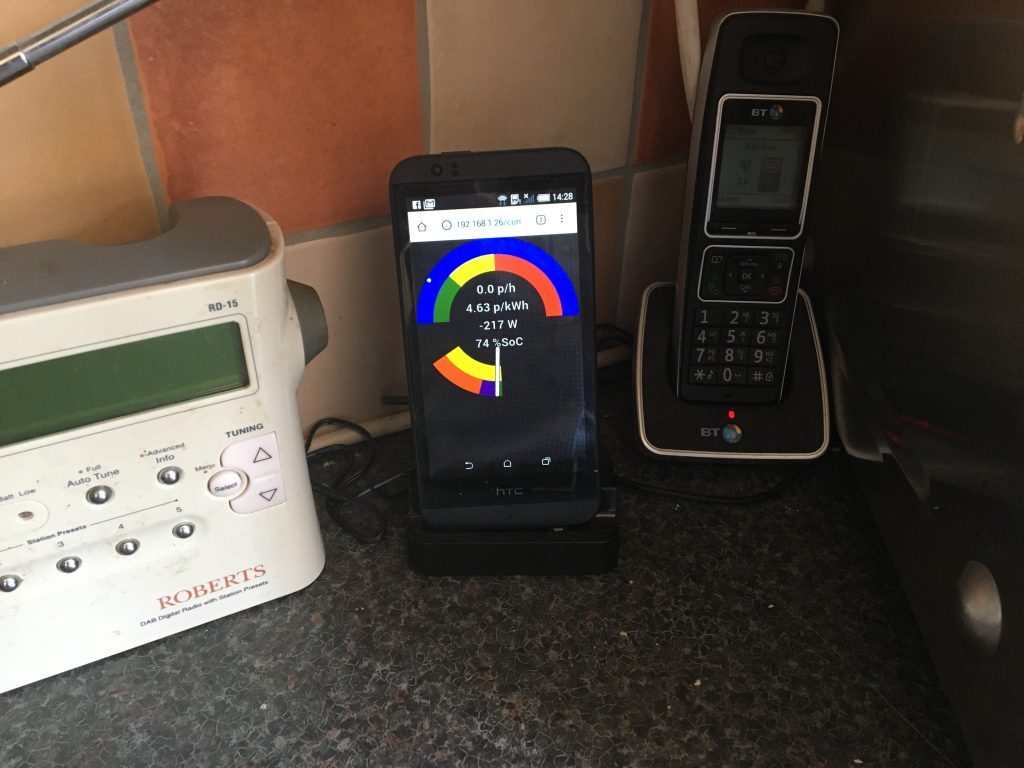
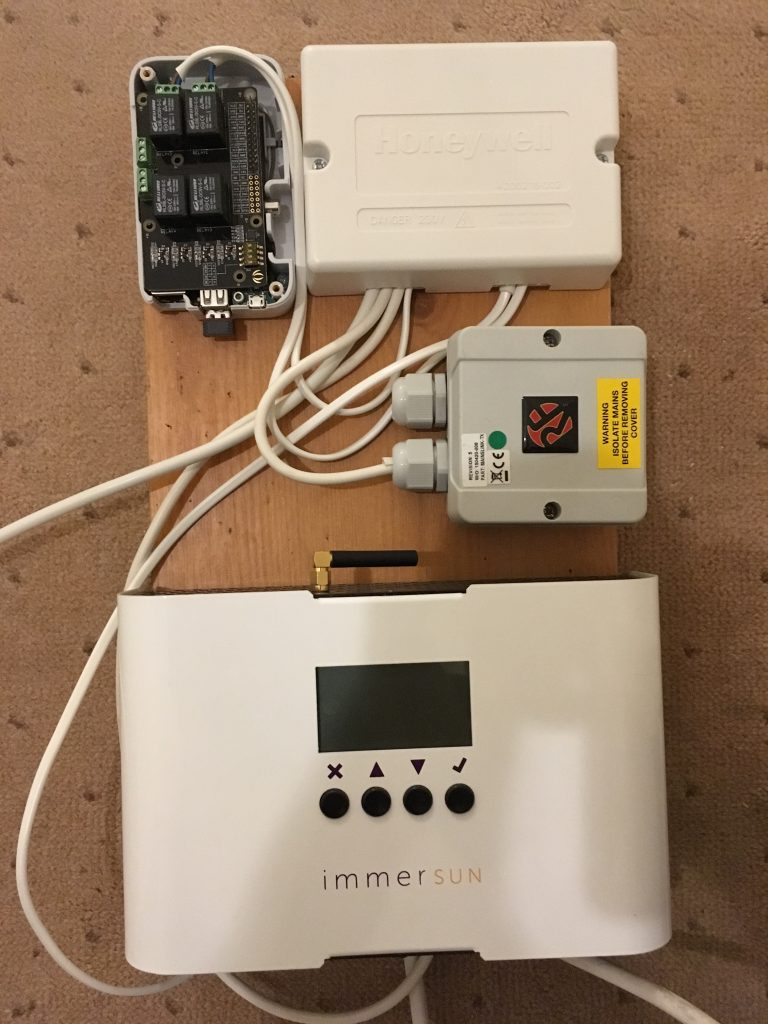
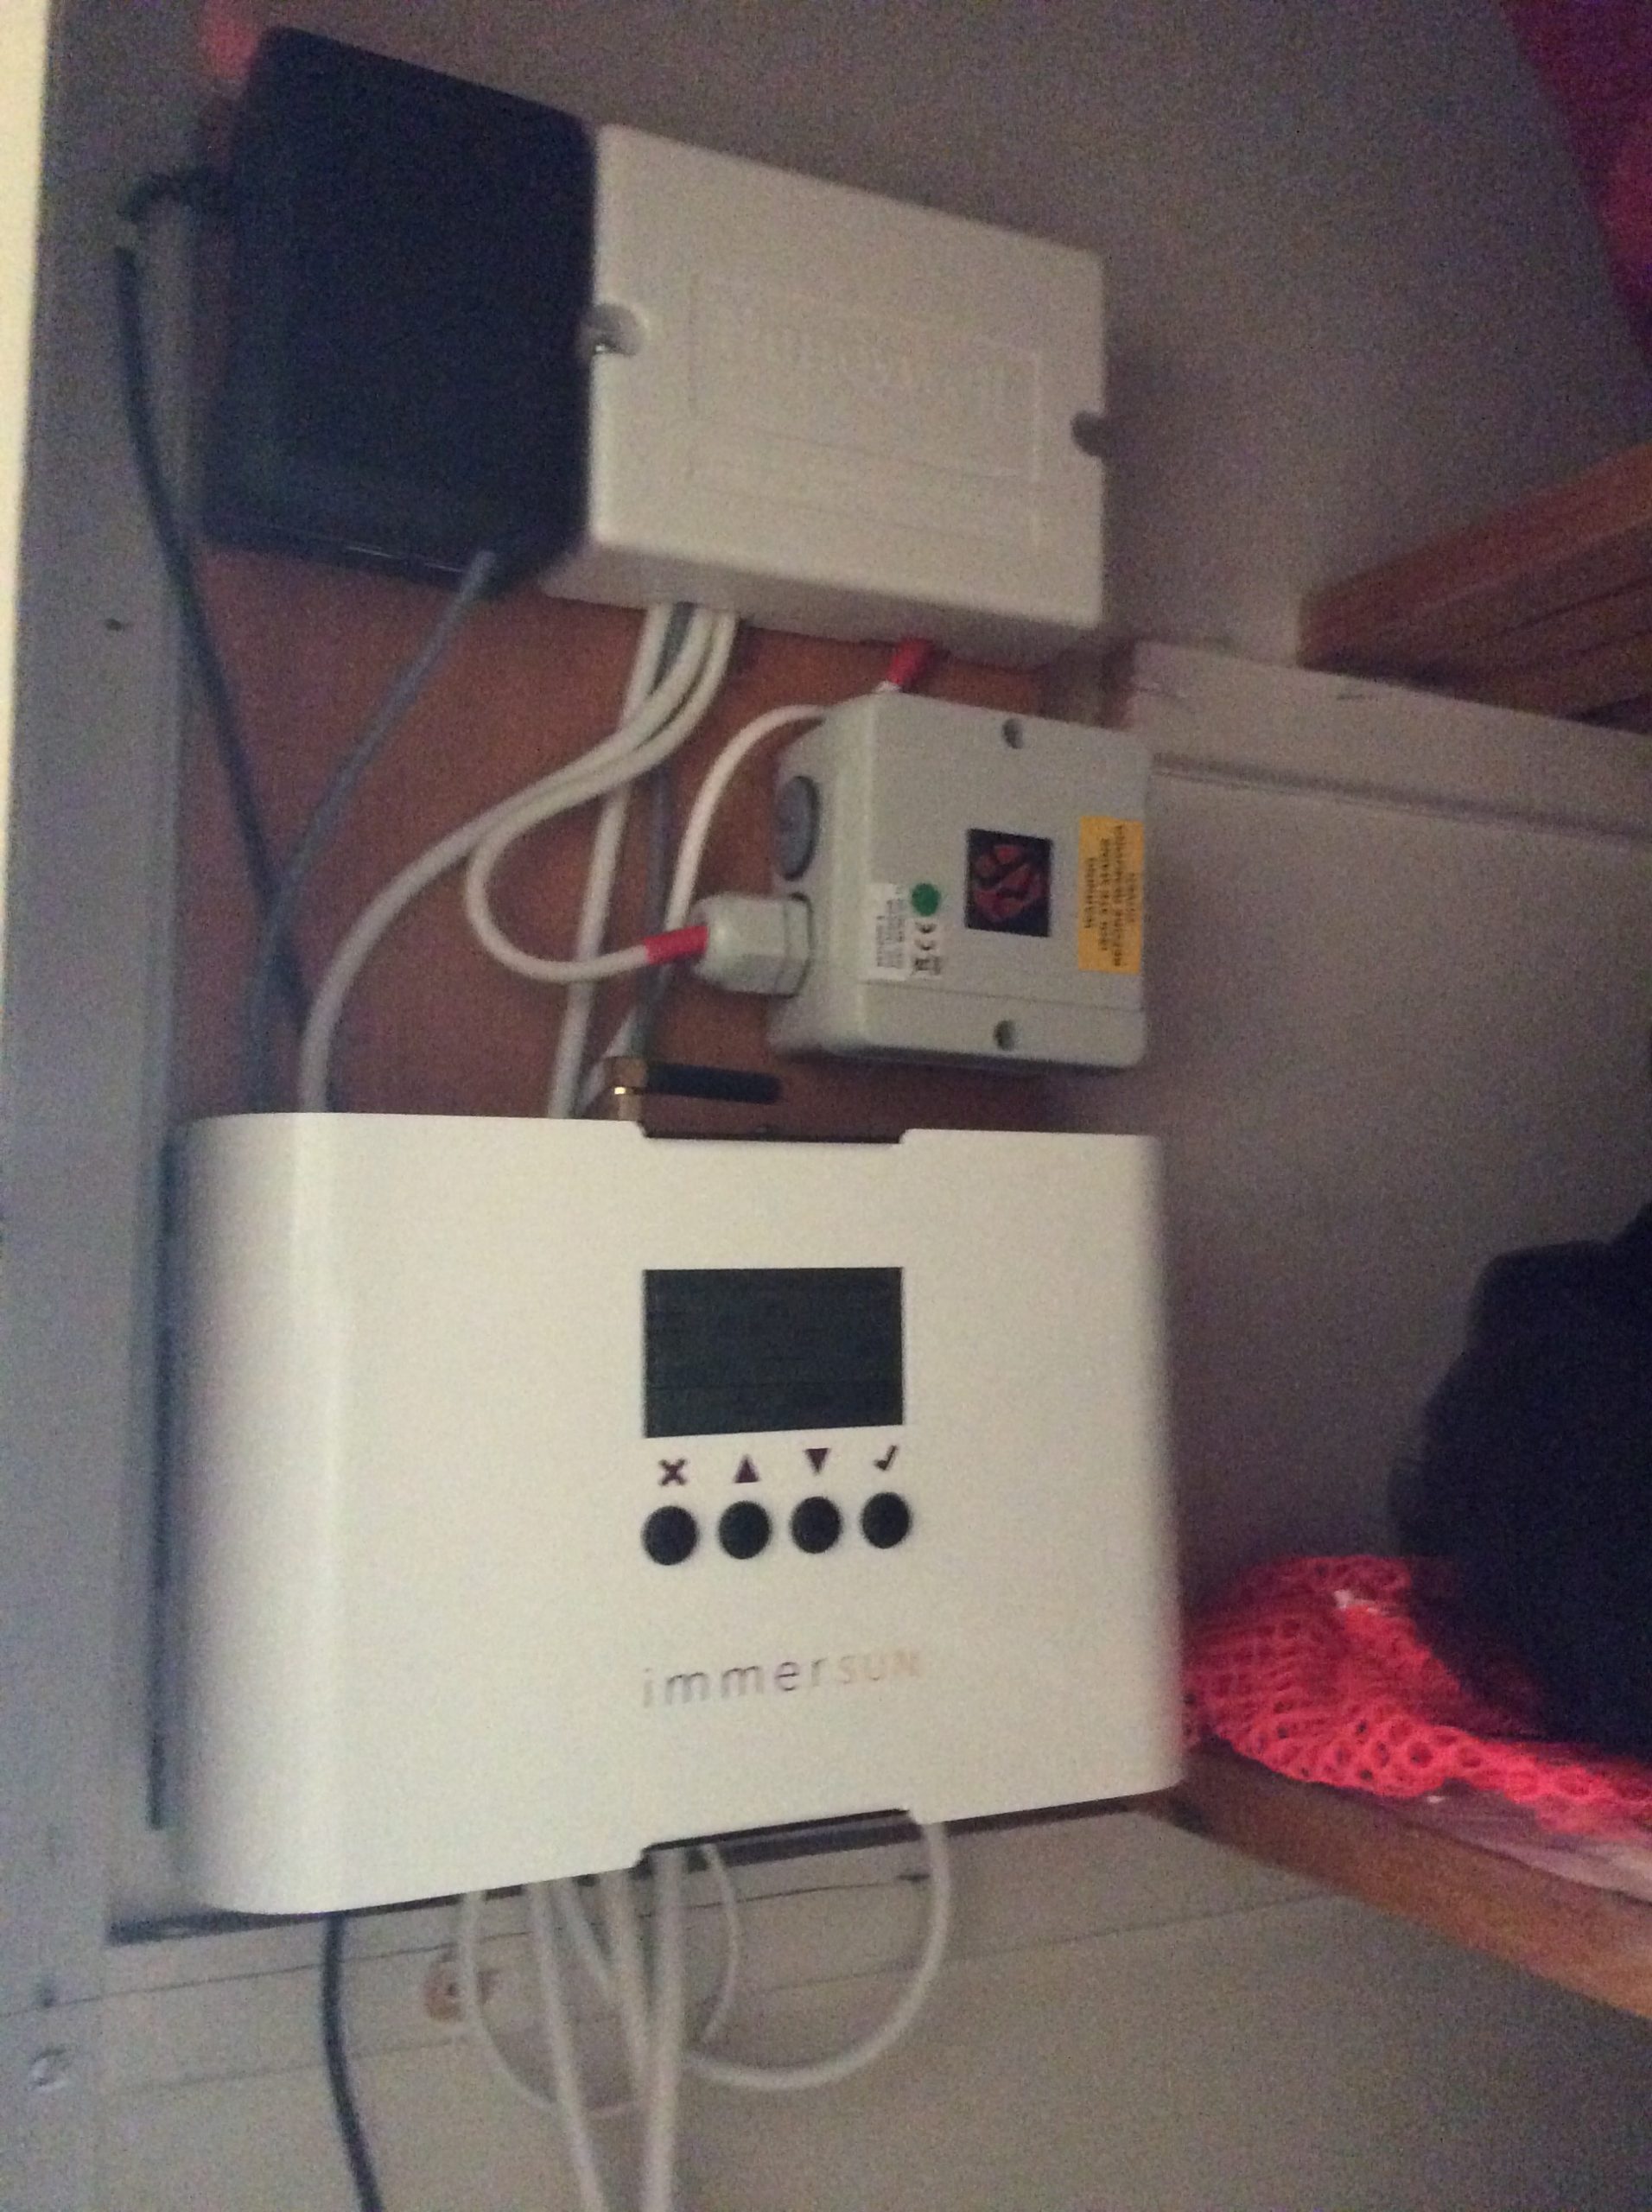
Smart controls – HEMS and immersun. 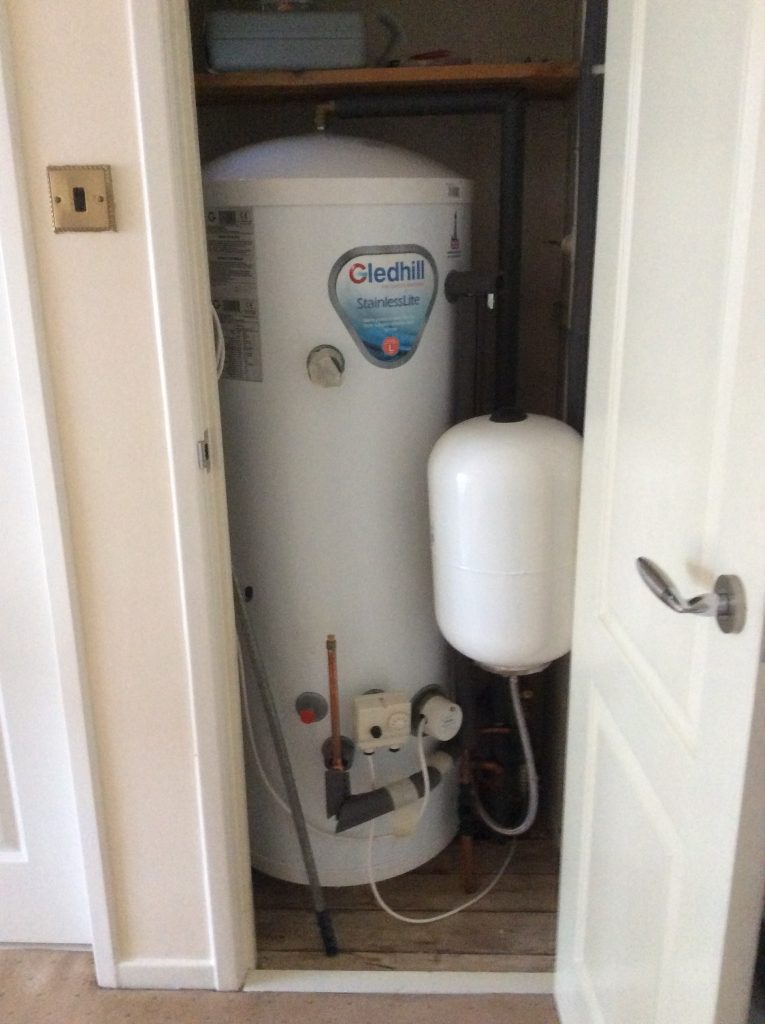
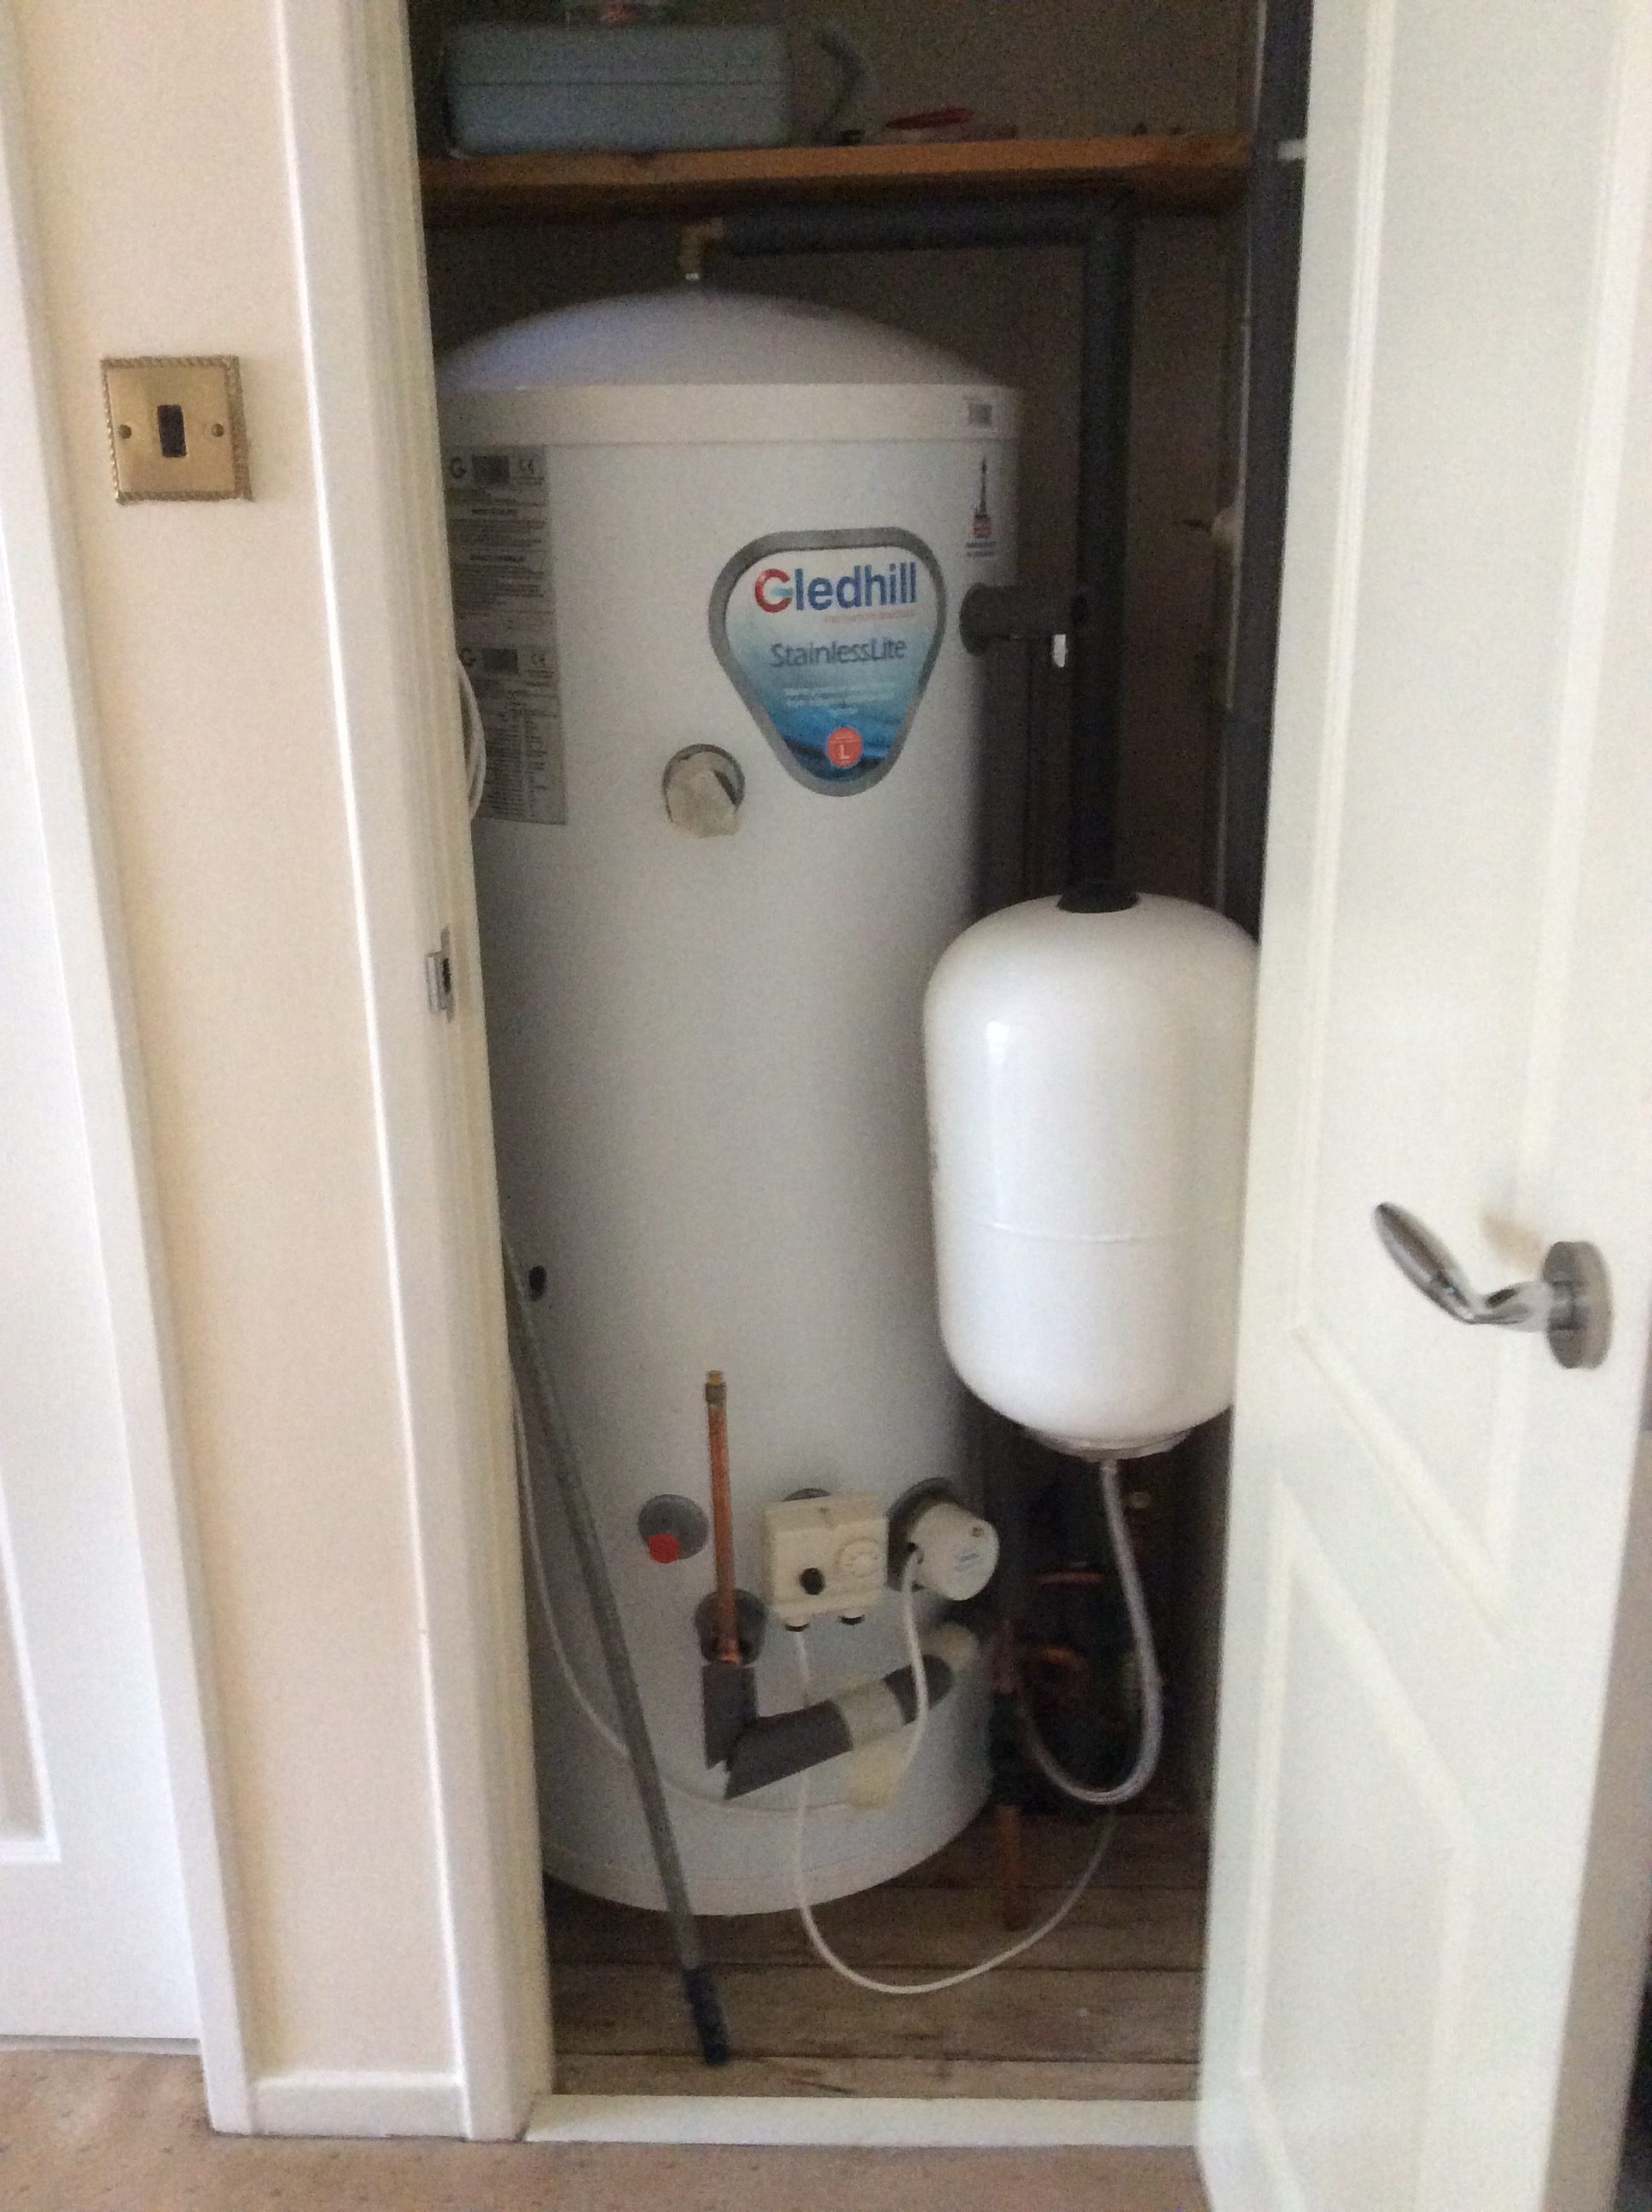
Hot water cylinder with immersion heater 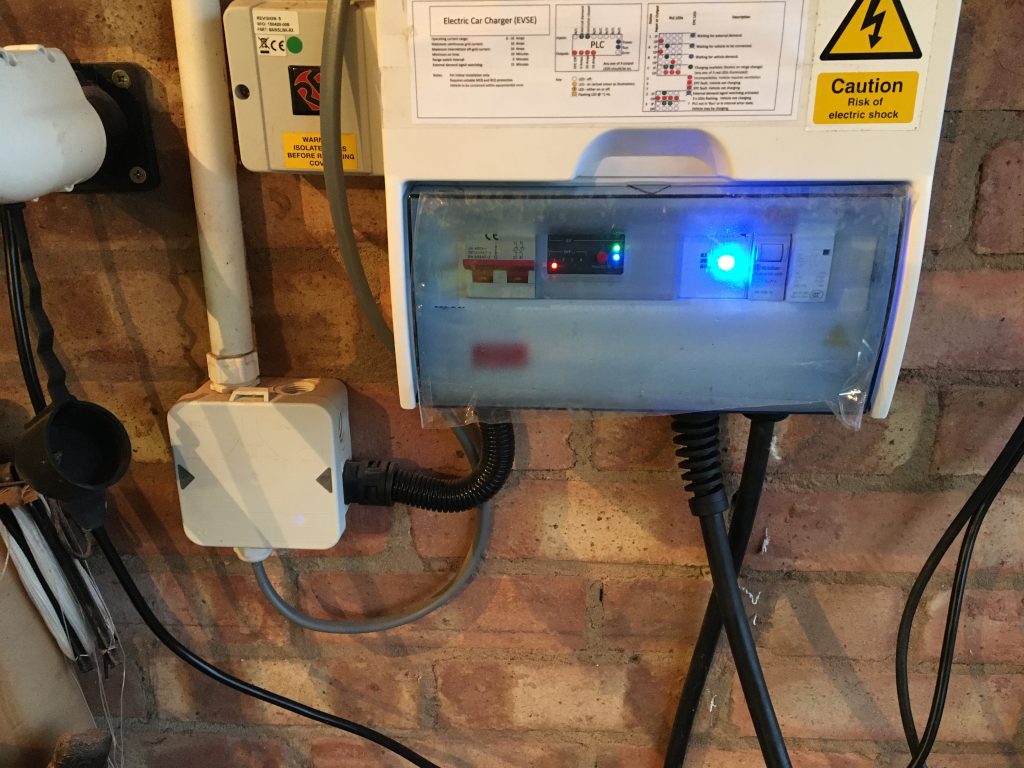
Car charger 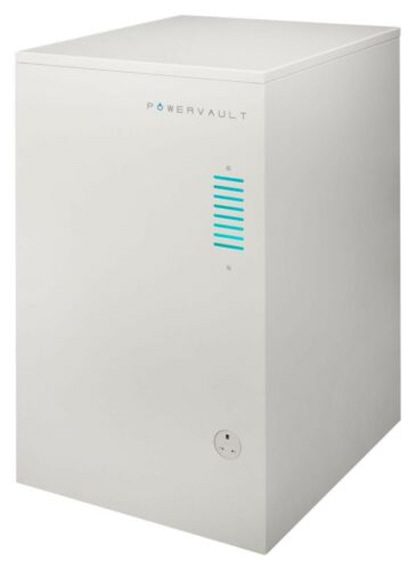
Powervault storage

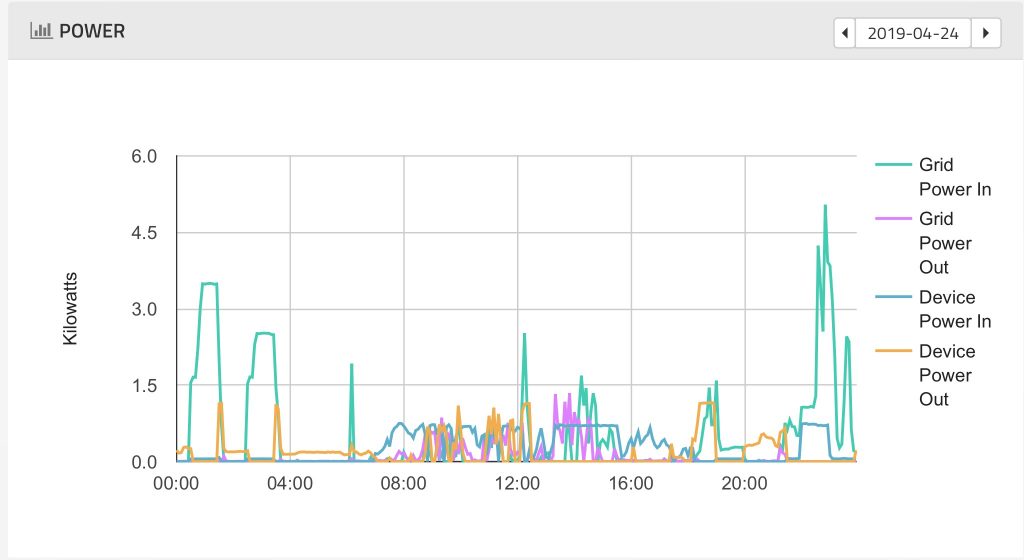
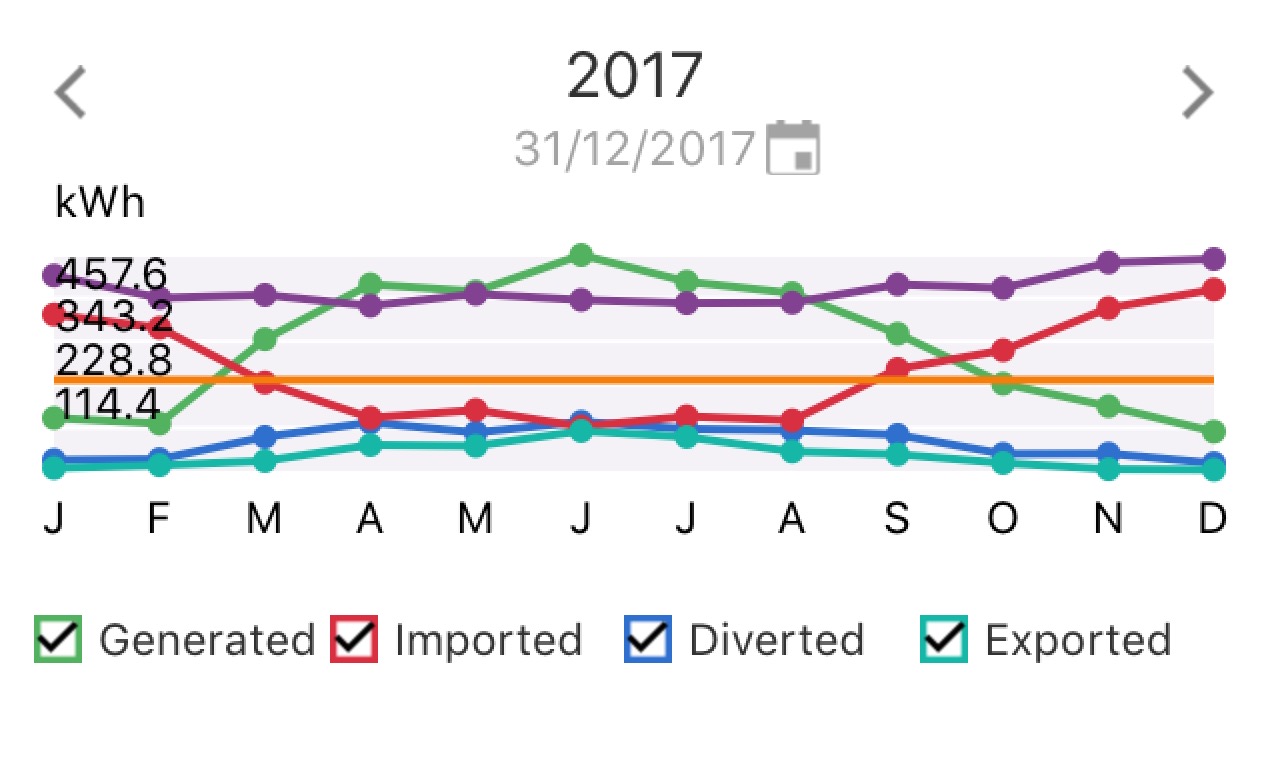
Self-consumption Controls
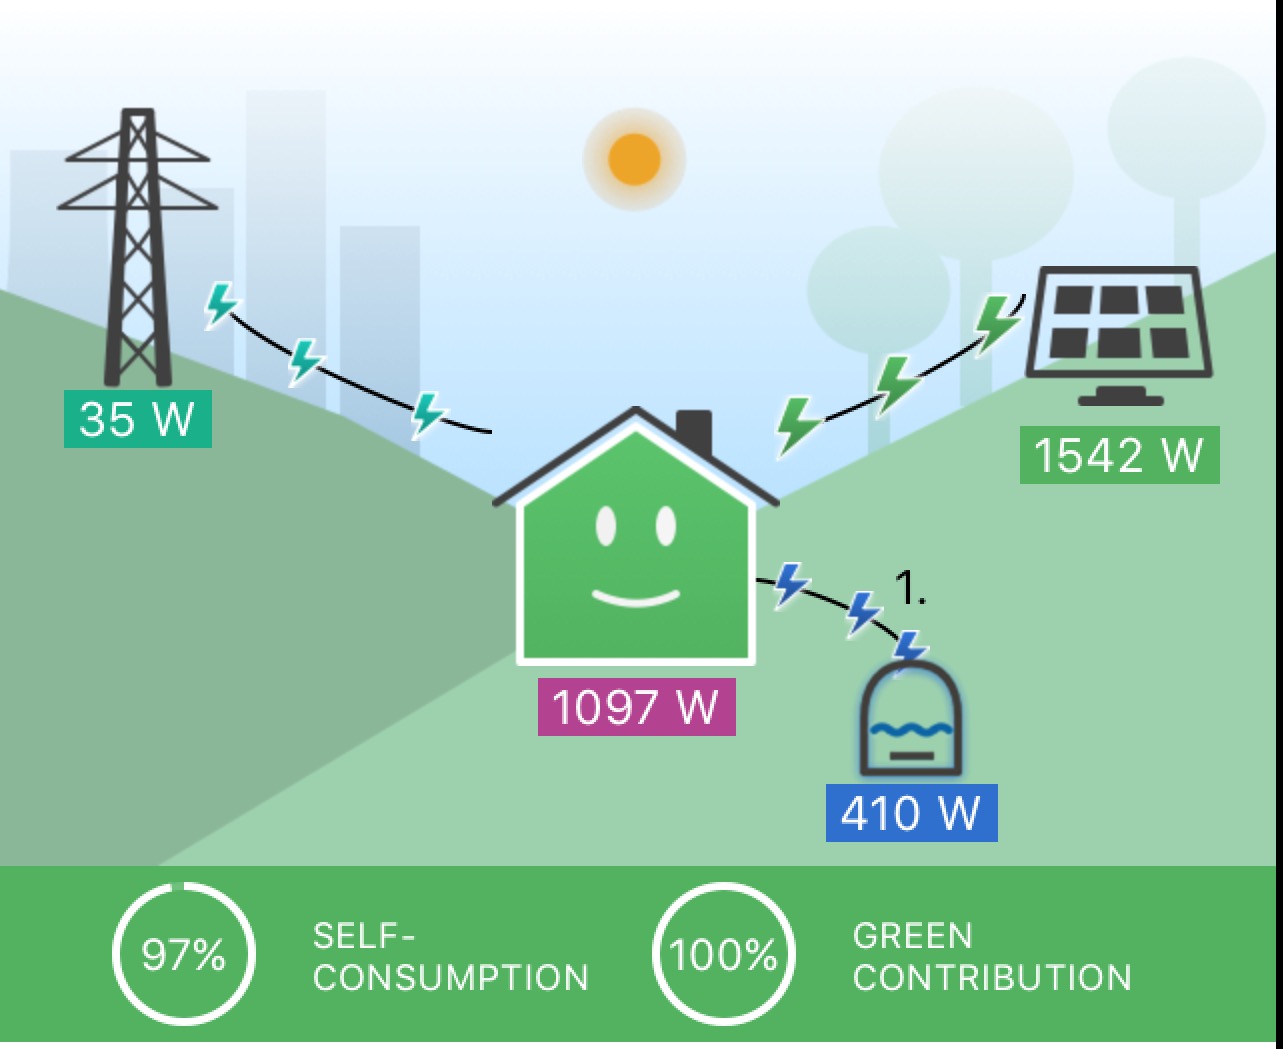
These controls manage the diversion of any excess output from my solar panels rather than give that energy to the grid. The loads are prioritised as follows:
- Powervault storage battery (fully proportional)
- Car charger (stepped proportional driven by ImmerSUN relay output)
- Hot water (driven by ImmerSUN fully proportional output)
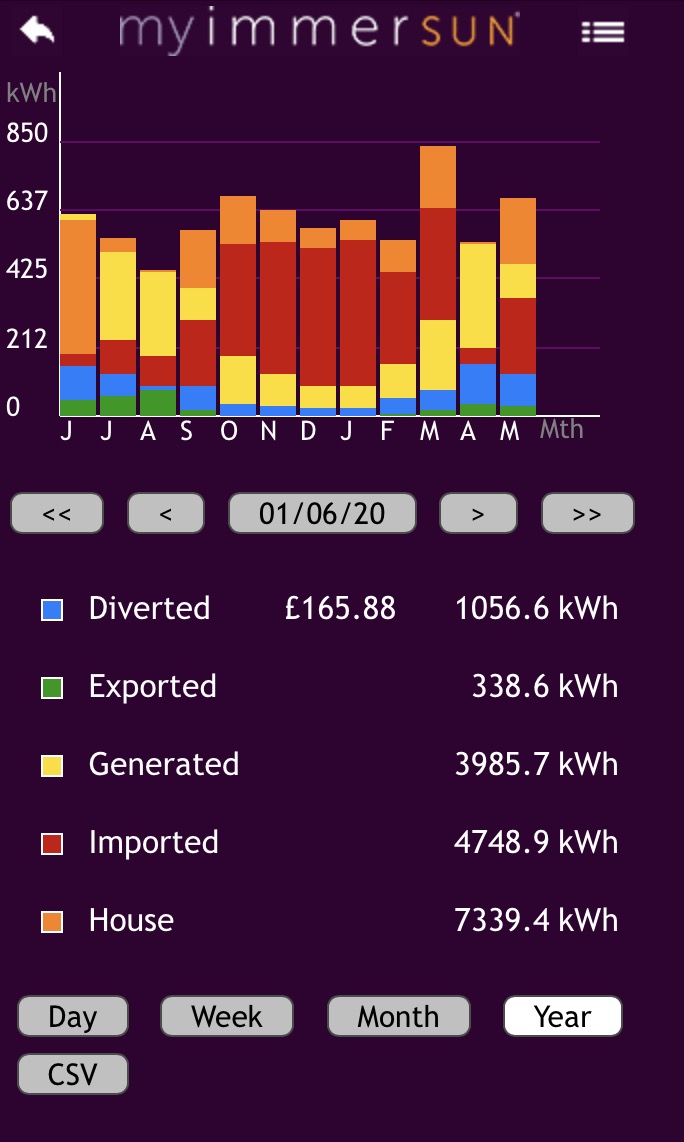
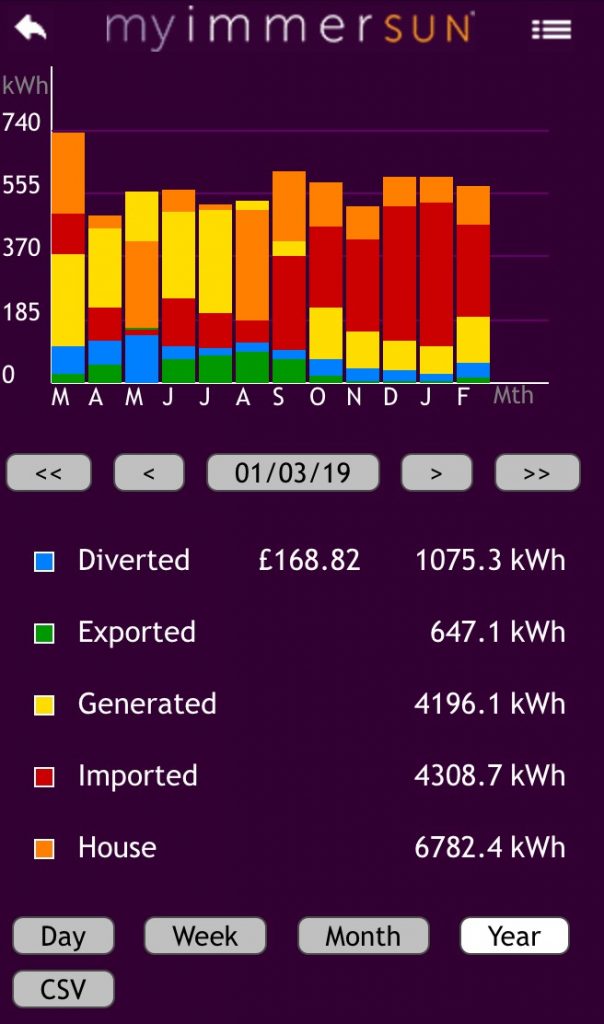
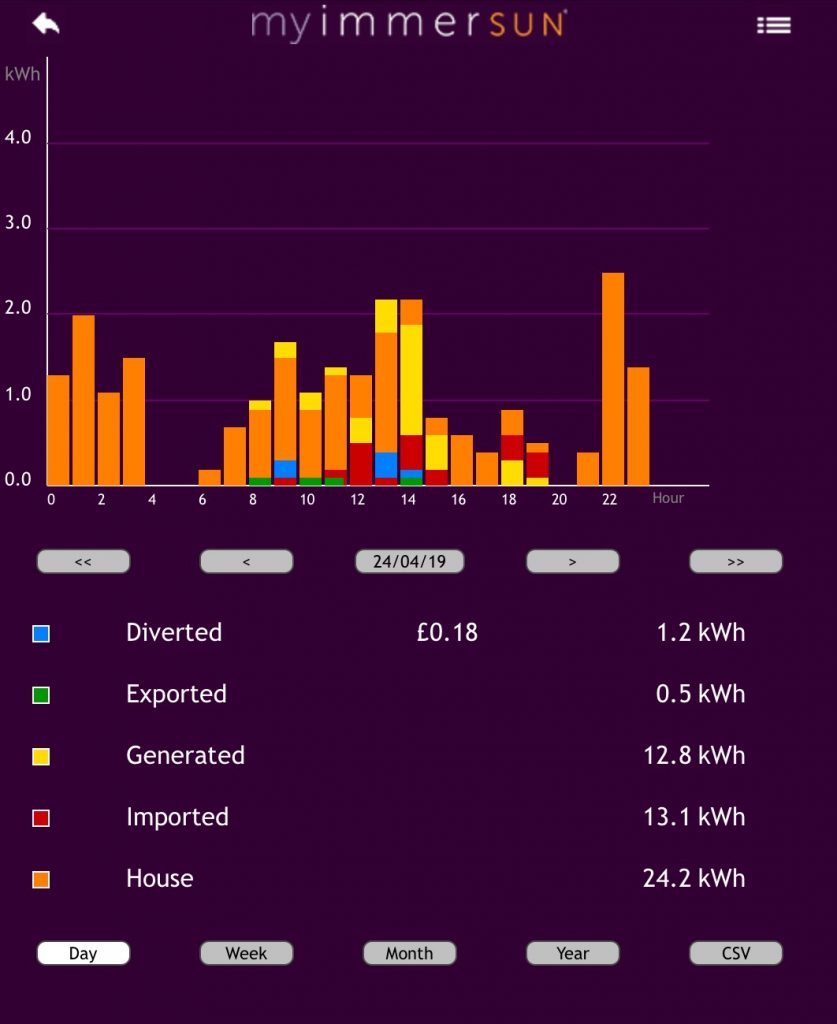
Last year these controls helped me to use over 90% of the output of my solar panels avoiding buying £100s of electricity and gas. The priorities are set to maximise value – #1 avoid daytime electricity use at 16 p/kWh, #2 avoid car charging at 5-16 p/kWh, and #3 avoid gas consumption at 2.96 p/kWh.
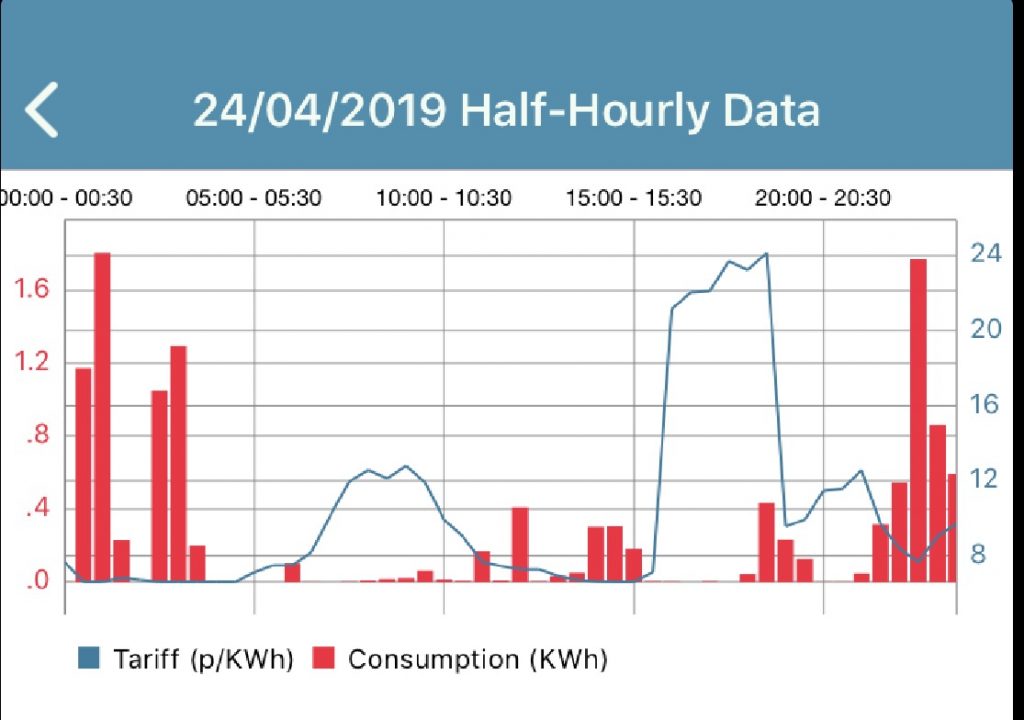
Smart Tariff Controls
These controls manage my electric devices for lowest grid energy cost. The controlled devices are:
- Battery storage (Powervault)
- Dishwasher
- Electric car charger
- Hot water heating (ImmerSUN)
- Washing machine
The hardware that has this control is known as a Home Energy Management System (HEMS). My HEMS is based on a simple computer known as a Raspberry Pi. The HEMS uses foreknowledge of the electricity price and predicted solar panel output to determine when best to run the above devices. It was designed around a tariff called Octopus Agile which has 48 half-hourly prices that change daily, but is currently working with a simpler two-rate smart tariff.
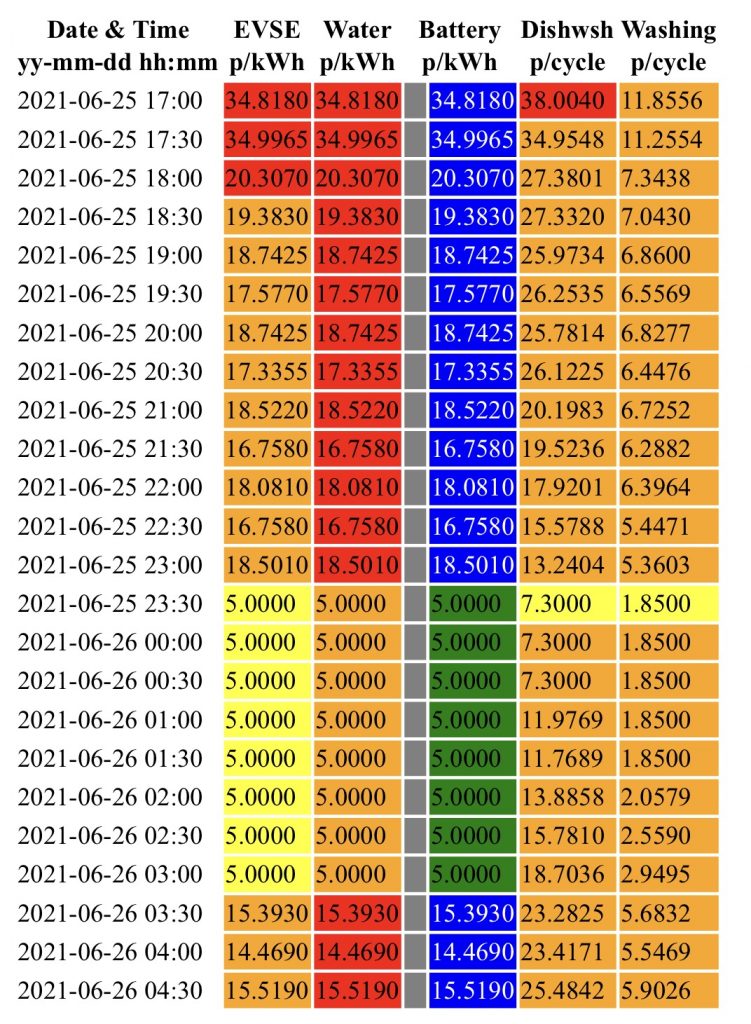
Hybridised Agile and Go 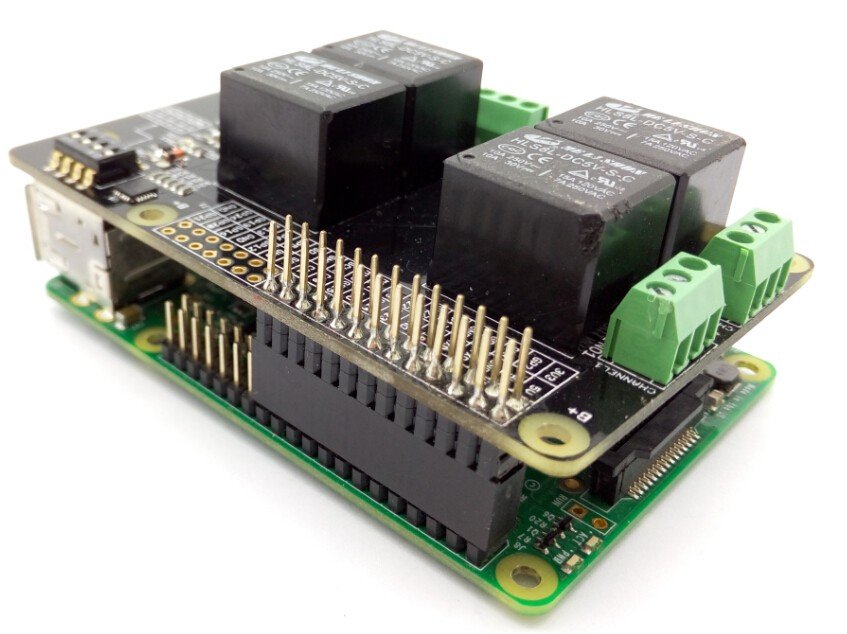
Raspberry Pi as HEMS 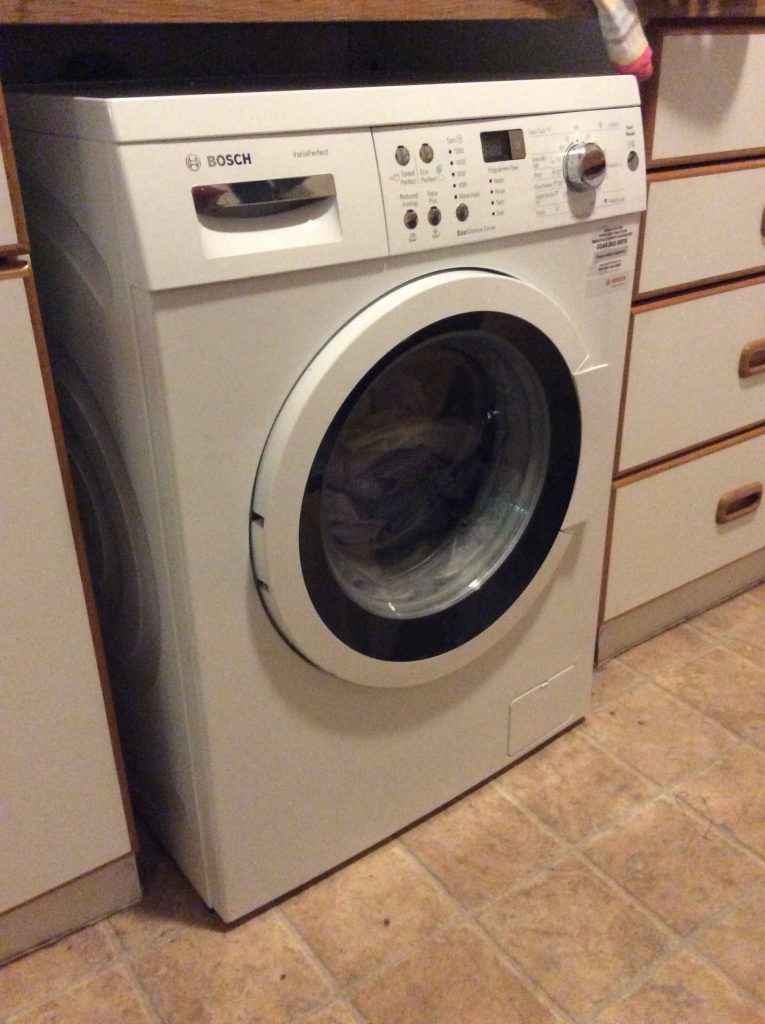
Bosch Washing Machine 
Siemens Dishwasher


| device | Central Heating | self-consumption | smart tariff |
|---|---|---|---|
| Battery Storage | #1 | X | |
| Central Heating Boiler | X | ||
| Dishwasher | X | ||
| Electric car charger | #2 | X | |
| Hot water heating | #3 | X | |
| Washing machine | X |
Most of these solutions are made up of commercially-available items that I have perhaps combined in a way not anticipated by their manufacturers. In particular:
- I created a relay module to enable the gas boiler to be turned on remotely and programmed a series of logical rules for the Apple TV’s that act as the controllers.
- I identified a way to prioritise different self-consumption devices by configuring their current clamps.
- I built my smart car charger integrating various items of hardware and writing the ladder logic program that runs it.
- I built the HEMS from commercially-available parts and wrote the software that runs on it to control my devices.