Category Archives: Energy

Smart meter and tariffs

Earlier in the week I received notification from my electricity and gas supplier that my 12 month contract was coming to an end.  I did my usual search for the best value Economy 7 tariff but drew a blank – everything including renewal with my existing supplier was rather more expensive than I’m paying now – so I decided to be rather more adventurous.

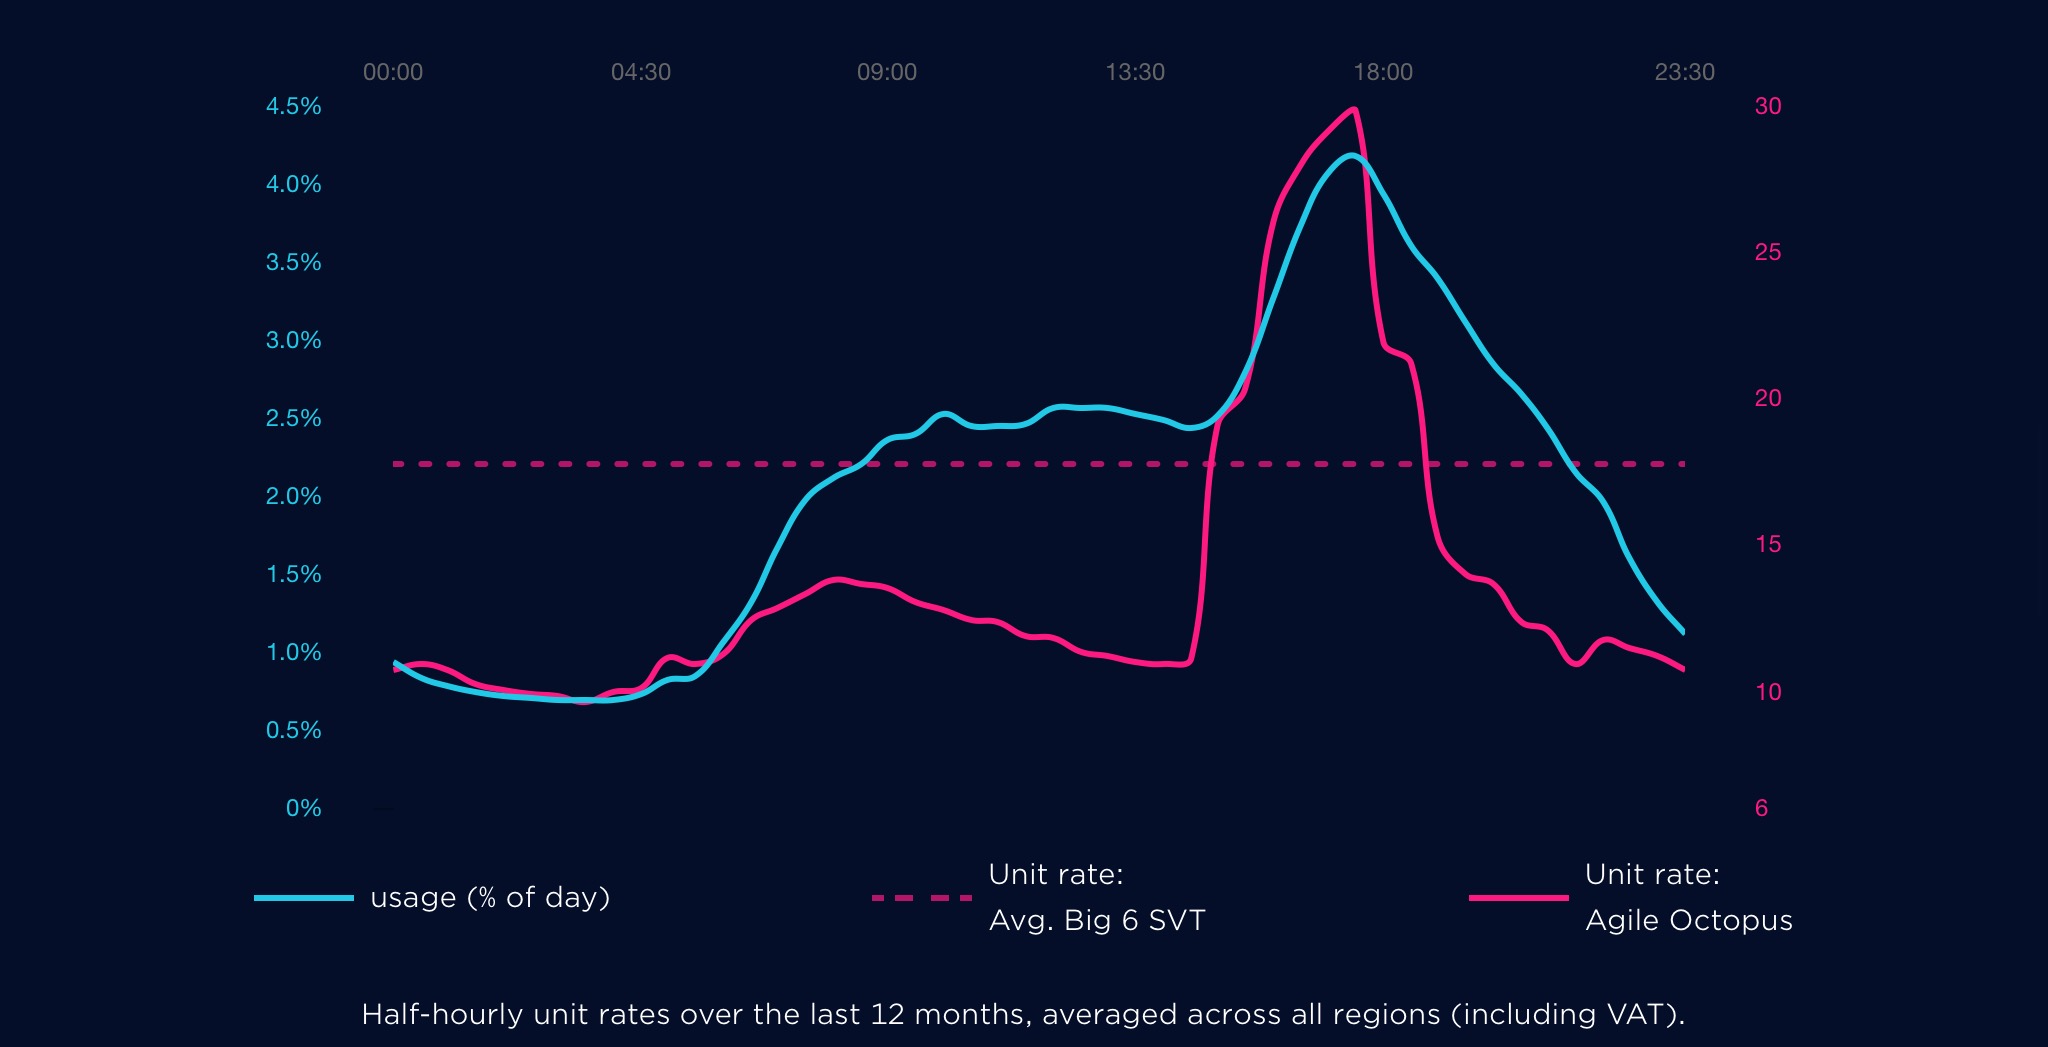
My decision was a significant change – not just a move from Economy 7 to a smart meter, but also the addition of a smart tariff (one that changes rate multiple times per day), and indeed my chosen tariff is dynamic so it potentially changes every half hour and day-to-day.  As I don’t yet have a smart meter then I’ll continue on Economy 7 until the meter is replaced, but then adopt the dynamic tariff.  With flexible loads like electric car charging and my storage battery then I should be well equipped to make the most of such a tariff.

On the dynamic tariff rates are published each day at 4:00 PM for the next day.  Some times (not very often!) prices even go negative so one is being paid to consume.  At other times electricity is relatively expensive (early evening’s principally) but the battery should help me minimise purchases during such times.

I’ve already checked the battery storage and it has the ability to be programmed very flexibly around different electricity prices at different times of day so that it doesn’t just absorb surplus solar but charges at lower cost times to discharge at higher cost times.

I also want to explore opportunities to automate the response to tariff changes – potentially linking storage battery, car charging, and water heating to tariff as well as self-consumption.

Electricity Purchase to July 2018

In the last few days I’ve reported our status on electricity generation from our solar panels and our gas consumption, so here comes some thoughts on electricity purchase from the grid.

Starting in late 2015 after the meter was changed to Economy 7, there’s a general downward trend from November 2015 to March 2016, before my car charger project kicks in maximising use of my own solar electricity to charge my car (when available) which causes a significant drop in purchased electricity between march and April 2016.  That seasonal saving gradually drops through the autumn, although it’s interesting that by November 2016 we’re back on what seems to be a continuation of a downward trend from January to March 2016.  Electricity purchased is also significantly lower than 2015 as we enter the second year.

The second significant change is the addition of the storage battery in December 2016.  However from January to August 2017 (yellow) electricity purchased is significantly below the prior year (magenta) – potentially showing the benefit of the battery in saving electricity generated during the day to reduce consumption later in the day.  This benefit largely disappears from September to December 2017, presumably because my increased vehicle mileage after my daughter started school is offsetting the prior savings.

2018 (orange) generally falls somewhere between 2016 and 2017 as it combines both the storage battery and the higher vehicle mileage throughout the year to date.

The August 2018 figure is a projection based on the first few days of the month only, but may yet come to represent the month as a whole being a function of:  (i) record solar outputs, (ii) continuing battery storage availability, and (ii) no school in August leading to reduced mileage.

Mid-year thoughts

Summer is definitely upon us now as we enjoy the glorious summer weather.  Disappointing weather earlier in 2018 has given way to two record months in May and June which yielded the highest monthly outputs for their respective months since the system was installed back in 2015.  Some days we buy no measurable electricity or gas  (given that the electricity meter has a resolution of 1 kWh) depending on what the need to charge the car.  If the car is at home then I can fully charge it from the solar panels, whereas if the car is at away from home during the day then I may need to give it some charge overnight.  When charging overnight I have been tending to charge for the minimum number of hours up to 7:30 AM when I typically leave home on a weekday – that pattern provides for mostly Economy 7 Energy from the grid less whatever comes off the solar panels from the rising sun less whatever might be left in the PowerVault from the previous day as illustrated below:
The green ‘hill’ from around 3:30 to 7:30 AM is created by car charging.  Normally this would be seen as a rectangular block as the car charger effectively runs at a constant 10 Amps (2.3 kW) through the operating period.  However in the illustration the charging event (at least in terms of power drawn from the grid) seems rounded at both the beginning and the end.  At the beginning of the car charging period the mustard ‘Device Power Out’ curve shows the last remaining stored energy from yesterday being drawn from the PowerVault, while at the end of the charging period the ramp down is a result of increasing output from the solar panels reducing the need for power from the grid.  Hence at the moment the car charging ends there’s a sudden switch to charging the PowerVault at full power (the blue line) and some surplus power not used by the PowerVault (the purple line) – suggesting that something around 1 kW is suddenly available.  Although the purple line is described as ‘Grid Power Out’ that’s not strictly true here as much of that surplus is being diverted to make hot water (although this is invisible to the PowerVault).

After that digression, my actual purpose in making this post was to reflect upon relative energy costs and the best use of my solar power to reduce energy cost.

Energy usagePetrolDaytime ElectricityNighttime ElectricityGasSolar Electricity
Battery Storagen/an/a - no economic case to charge battery from grid during dayOptional - need to consider value of saved energy versus cost of 1 cycle of battery cycle-lifen/aSelf-use Priority #1 via PowerVault (daytime electricity -> solar)
Car ChargingManual 3rd backup (typically only used for long journeys when charging en-route becomes impractical) Manual 2nd back-upAutomated 1st backupn/aSelf-use Priority #2 via ImmerSUN (nighttime electricity -> solar)
Water Heatingn/aManual 3rd backup (never used in 3 years)Manual 2nd backup (never used in 3 years)Automated 1st backup for dull daysSelf-use Priority #3 via ImmerSUN (gas to solar)
Space Heatingn/aManual backupManual backupDefaultn/a - a summer solar surplus is a poor match to winter heating demand but could be Priority #4

 
The table above shows columns of energy sources ordered by reverse energy cost versus the major energy consumers in the house: battery storage, car charging, space heating and water heating. Energy consumers are ranked according to the value of displacing the the alternative energy course if not solar:

  1. Battery storage – I currently only charge the battery storage from solar, although there would be a seasonal economic argument to charge from cheap rate electricity if the differential between day and night rates was higher.
  2. Car charging – I generally charge on cheap night-rate electricity when I don’t have enough solar. In summer I program my car charger via the ImmerSUN’s 7-day timer to deliver sufficient charge for the day ahead, but sufficient headroom to make use of any available solar.
  3. Water heating – water heating is my 3rd priority for solar self-use and is automatically based up by the gas boiler which runs for an hour making hot water in the early evening if the tank isn’t already hot from diverted solar power during the day. The gas thermostat is also set slightly colder than the immersion heater – still very usable for a bath or shower from gas but giving some ability to delay water heating from a dull day to a following sunny day.
  4. Space heating – my space heating is generally gas. It would be possible to run a heater (or heaters) such as storage radiators via the ImmerSUN’s third output, but I consider that the cost of the heater(s) and installation is unlikely to be recouped given the major mismatch between surplus solar generally being in summer and heat demand being in winter.

Here’s a little Tonik..


Today my energy supplier Tonik wrote to me inviting me to consider solar panels, a car charger, or a storage battery – all of which I already have.  However on their website I found a wider vision of the future home which they thought could halve energy consumption. I thought it would be interesting to compare their vision with my status.

As you can see from the table below the content is quite similar, although I have more ambitious use of solar and more sophisticated smart heating management.

Tonik's VisionMy Q3 2017 statusMy Q3 2019 status
Switch to Tonik for lowest cost renewable electricity.Done.Now with Octopus
Smart meterWaiting on TonikSupplied via Octopus
Connected thermostat (whole of house device)Connected thermostats (individual room temperatures and schedules)
LED bulbsDone.
Smart tariffWithout a smart meter on nearest equivalent (Economy 7)Agile Octopus dynamic smart tariff.
Solar PV Done.
Battery storage.Done.
-Surplus solar electricity diverted to charge electric car.
-Surplus solar electricity diverted to heat water.

Solar output – 2017 Jan – Jun

2017 H1

Now that we’re half way through 2017 it seemed appropriate to have a look at energy usage from the solar panels – especially as those six months reflect the first six months with the battery storage system.

The graph is taken from my ImmerSUN smart controller which automatically diverts surplus solar electricity to the car charger or immersion heater.  The battery storage system has independent controls but its benefits can be seen via the ImmerSUN.

The purple line shows the consumption of electricity (excluding the immersion heater) and is relatively stable month by month.  Consumption is relatively large due to my electric car and cooking with electricity.

The green line shows the generation of electricity from my solar panels.  Not surprisingly output is lower in the winter, but from April we generate more electricity than we use despite our relatively high consumption.  In principle we could be electricity independent during those months but for the time of consumption not matching the time of generation.

The red line complements the green line as it shows the import or purchase of electricity from the grid, and thus reduces as the generation rises.

The blue line shows the diversion  of electricity to heat water via the immersion heater when neither the battery storage system nor the car charger can absorb the available electricity.

Finally on the graph the turquoise line shows export of electricity to the grid when all smart capability within the house to use electricity is exhausted i.e. battery storage system at maximum power or full, electric car battery full or absent, and water in cylinder is hot.

Among the numbers:

‘Savings” at £80 refer only to the value of the water heating achieved from solar electricity versus buying electricity (although our backup is mains gas).

“Self consumption” at 86% refers to the proportion of solar panel output used i.e. not exported to the grid.

“Green contribution” at 59% refers to the proportion of total electricity consumption (excluding water heating) derived from the panels rather than from the grid.


Bought Electricity 2016

Yesterday I produced a graph of the number of units of electricity that I’d bought or imported each month since we changed to Economy 7 metering back in October 2015 – a change that I made to reduce the costs of charging my electric car.  I rather surprised myself.

Key features that caught my attention were:

  • If I ignore the months of significant solar generation where significant electricity is available that isn’t bought, then from November 2015 to March 2016 and November 2016 to December 2016 there are 6 months of consecutive month-on-month reduction in bought electricity.
  • Comparing November and December between 2015 and 2016 (the only 2 months available for direct comparison) there’s a reduction of a round a third in bought electricity.
  • Comparing December 2016 with January 2016, bought electricity is down by a quarter.

That seems to be a compelling case for a significant reduction in import having taken place. Such a reduction could be combination of 2 sorts of things, firstly fundamental reductions in electricity use such as through having a more energy-efficient appliance, or secondly shifting use from paid-for electricity to free solar electricity (albeit that the months in question are winter months where less solar is available).

Potential contributors to this effect are as follows:

  • November 2015 to March 2016 – Increasing availability of the garage for car charging. In November 2015 I demolished an internal partition within the garage that had rendered the remaining space too small for a car.  That created an open double garage which allowed a car in for the first time since the partition was created in the 1980s. In March a suspect garage door was replaced making routine access much easier since the old door was badly corroded, required considerable effort to lift, and had an odd locking arrangement.  Thus during this period garage use went from 0 to 100% utilisation for car parking/charging. This might seem an odd item to include but my rationale is that if the electric car is in the garage then it will be warmer than if outdoors and charging will be more efficient as there will be less heating and more charging. Charging also has potential to be at higher current in the garage due to the availability of a Mode 3 charger which I think is also more efficient.
  • December 2015 – gas boiler replacement. Again perhaps not obvious at first sight, but if the new boiler gets the water hotter then less work needs to be done pumping water round radiators to take place to deliver a certain heat output at the radiators.
  • January 2016 – fridge freezer replacement. In January we replaced the former separate fridge and freezer with a single combined fridge-freezer. Although considerably larger in combined volume, the new fridge freezer replaced a freezer that I’d had for over 25 years so I anticipate an energy saving there.  The new fridge-freezer is rated A+ at 496 kWh/annum.
  • April 2016 to September 2016 – charger control project. Development of the charger control project shifts some electric car charging from overnight bought electricity to daytime free electricity even in winter. Previously even on a sunny winter’s day I probably wouldn’t have charged in the daytime due to a risk of import ruining the economics, but now I just leave the car plugged in virtually all the time and let the charger run automatically if and when sufficient free power is available.
  • July 2016 – double oven replacement. In July the failure of the fan on the oven prompted a oven replacement as the old fan was inaccessible for replacement due to corrosion of the surrounding bolts. I’m not sure how old the prior oven was (although I have evidence of the kitchen being remodelled in 2005) , but anticipate an efficiency gain due to replacement.  The new double oven is rated A/B – i.e. the smaller oven is efficiency A and the larger one efficiency B.
  • December 2016 – storage battery. Installed too late in December to have much of an influence here, the ability of the battery to capture electricity that would have been exported as surplus to requirements for later use should reduce bought electricity. The secondary ability of the battery to storage cheap night time electricity for later day-time use is likely to be of interest only in the winter months, and then won’t reduce demand (indeed it will increase demand slightly due to its round-trip efficiency) but it will reduce costs.

It will be interesting to see how this develops through 2017.

Electricity use 2016

The immerSUN provides a useful app showing electricity use which includes an annual option.  The graph below shows the 2016 annual data:
Although some of the data was only collected from mid-March 2016, the graph still shows useful information. I think that the graph overstates bought / imported electricity in January to March but understates generated electricity proportionately in the same period.

The purple line shows monthly electricity consumption and is broadly consistent month-to-month.

The green line shows the generated electricity from the solar PV system.  Its seasonality is clearly visible.  Solar generation exceeds electricity use in four summer months, and is very close in a fifth.

The red line shows bought electricity.  It’s generally a mirror image of the green line reflecting more purchased electricity in winter and less in summer, but is not zero even in months where generated electricity exceeds used electricity due to time of day issues – cooking and car charging often occur at times when solar output is low such as cooking in the evening and charging at night.

The blue line shows surplus day-time electricity being used to heat water, and thus saving gas.

The turquoise line shows surplus day-time electricity being exported once the water has reached its set point.

It will be interesting to see how this changes in 2017 as a result of a full year of solar car charging in its current mature condition and with the new battery storage that should help get more of the generated electricity used by saving it for evening use.

Discounted renewable power

img_0596We’ve recently moved to Bulb as our electricity and gas supplier. Bulb is a new company founded by Hayden and Amit providing 100% renewable electricity and 10% renewable gas and, for us, was the cheapest provider of the same.

Bill logo

Bulb logo

Bulb are currently offering a £50 discount to new customers via this link, so there’s even more incentive to go renewable.

They also have 9.8 out of 10 on TrustPilot, a UK call centre, and are a Living Wage employer.

Energy Unit Costs

We’ve just switched energy suppliers at the end of a fixed rate term.  Unit costs are as follows:

Oct 2015
- Sep 2016
Oct 2016
- Dec 2016
Jan 2017
- date
Day-time electricity 11.71 p/kWh11.90 p/kWh11.48 p/kWh
Night-time electricity 7.57 p/kWh6.86 p/kWh7.87 p/kWh
PV electricity (when available if metered)4.85 - 4.91 p/kWh4.91 p/kWh4.91 p/kWh
Any-time gas3.01 p/kWh2.43 p/kWh2.35 p/kWh
PV electricity (when available if deemed like mine)0.00 p/kWh0.00 p/kWh0.00 p/kWh

In both cases electricity is on so-called ‘green’ plans where the supplier sources electricity to match my consumption from renewable sources such as wind turbines, solar farms, or hydroelectric.

I’ve included my export rates in the table as for some technologies this will make a difference to the cost-effectiveness of that technology.  My electricity company chooses to deem my export so it pays me assuming that 50% of my generated electricity is exported, rather than metering and paying for my actual export.  That results in the cost to me of using my own solar being zero, whereas if export was metered then using my own solar would cost me the export payment.  Thus for me it’s economically attractive to use excess solar to make hot water rather than using gas thus saving the cost of gas but, for someone with metered export, the lost export payment would outweigh the saving in gas.

Since the table rows are ranked by unit price (higher priced fuels are at the top) then another way to look at this is that it’s financially attractive to replace a fuel higher in the table with one lower in the table, but disadvantageous to replace a fuel lower in the table with one above.

Annual Energy costs

I was reading a newspaper article earlier which highlighted a 3 bed semi with annual energy consumption costs of £500.  Our net energy consumption costs for my early ’70s 4 bed detached in 2015/6 was £400.  That includes charging my electric car.

img_0591

The house has:

  • A-rated gas boiler (Dec 2015),
  • A-rated double glazing throughout (prior owner),
  • C-rated hot water cylinder with bottom-entry immersion heater and all accessible hot pipes insulated (Dec 2015),
  • 7 day timer (prior owner) with Thermostatic Radiator Valves (TRVs)  throughout (except hall and 2 towel rails – Dec 2015),
  • Standard cavity fill and 4″ loft insulation (prior owner, now nearer 10″ but Oct 2016 installation outside 2015/6 data window),
  • Almost 100% low energy bulbs (mostly Sep 2015),
  • 4kWp solar panels (Sep 2015) with energy management system (Sep 2015) with remote monitoring (Mar 2016) directing surplus PV to car charger (Apr 2016) and/or hot water cylinder (Dec 2015), and
  • Economy 7 electricity (Oct 2015).

I spent £1,000 on gas and electric in 2015/6 which was partially offset by £600 revenue from my solar PV giving net costs of £400. Given that some of the above were introduced during the year, a full year’s use should reduce consumption further.