Category Archives: Electricity storage

Monitoring the HEMS

For some time now I’ve been thinking about creating a real time display which pulls together data from a variety of sources around the home to provide an overview of what’s going on without the need to visit multiple web pages or apps. Until the last 10 days or so that involved little more than thoughts of how I might evolve the existing immersun web page with more content (I don’t have the skills to write my own app), but then about 10 days ago I saw an online gauge that someone else had created to show energy price and inspiration struck. Ten days later I have my monitor working, albeit not complete:

HEMS monitor

The monitor pulls together information from:

  • My electricity tariff for p/kWh
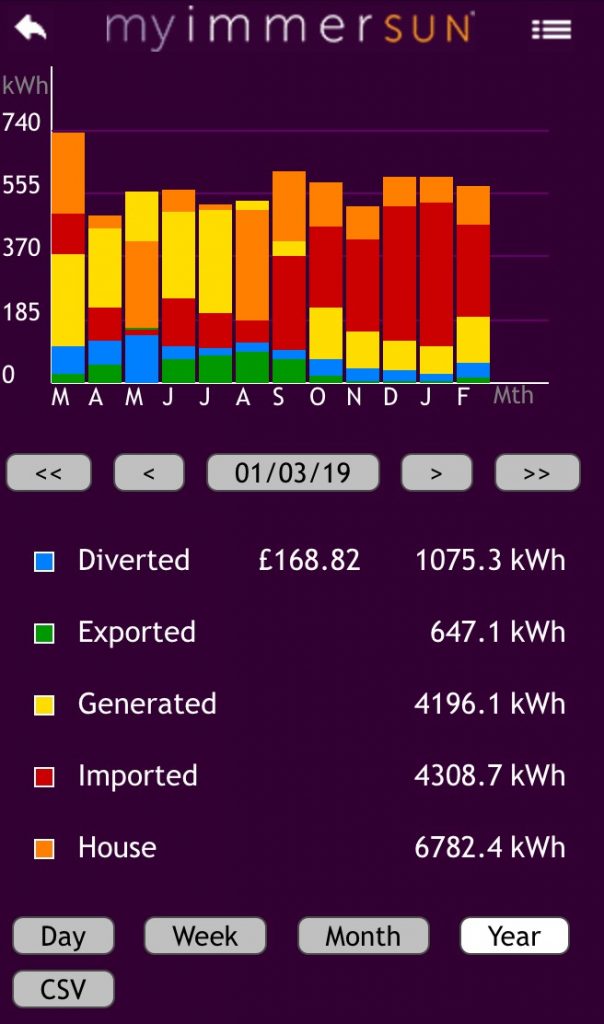
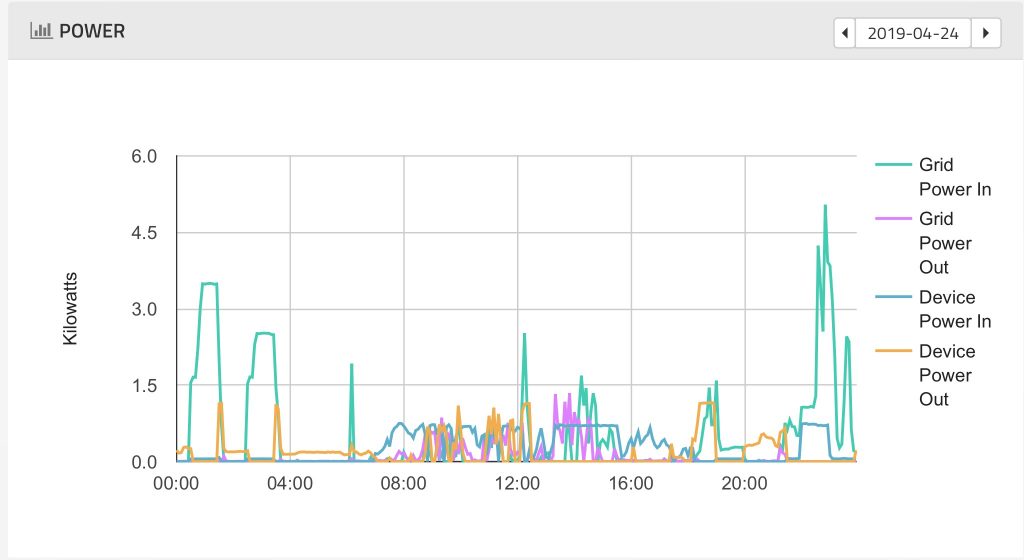
  • My immersun for power data (to/from: grid, solar, water, house)
  • My storage battery for power in/out and state of charge
  • My HEMS for electricity cost thresholds between different battery modes.

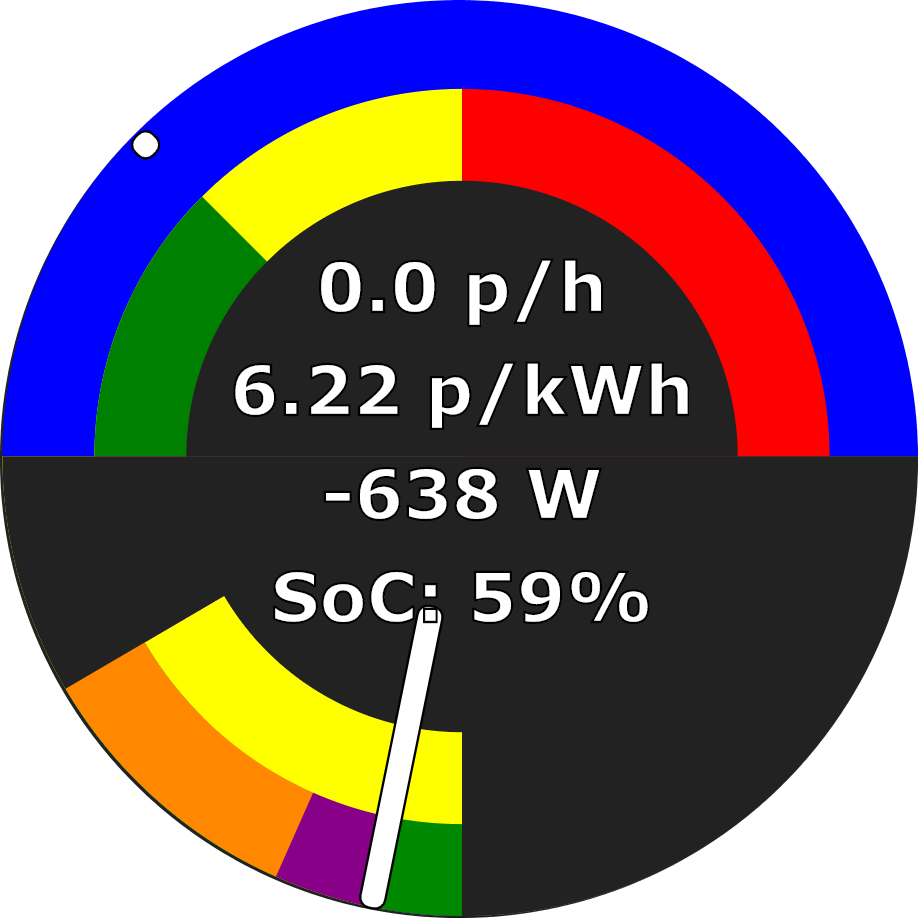
The gauge consists of two parts: (i) an upper electricity cost part and (ii) a lower power part.

The upper electricity cost part is effectively a big price gauge from 0 p/kWh to 25 p/kWh with a needle that moves each half hour as the price changes. It has various features:

  • The outer semi-circular ring (blue here) shows today’s relationship between battery mode and electricity price. Today is very sunny, so no electricity was bought from the grid to charge the battery, and this part is all blue for normal battery operation. If the days was duller and electricity was to be bought to charge the battery, then two further sectors would appear:
    1. a dark green sector from zero upwards showing the grid prices at which the battery would be force charged from the grid, and
    2. a light green sector showing when the battery is not permitted to discharge but may continue to charge from solar.
  • In inner semi-circular ring (green / yellow / red here) currently just colour-codes increasing electricity price, but will be used to show today’s prices at which car charging and water heating are triggered from the grid.
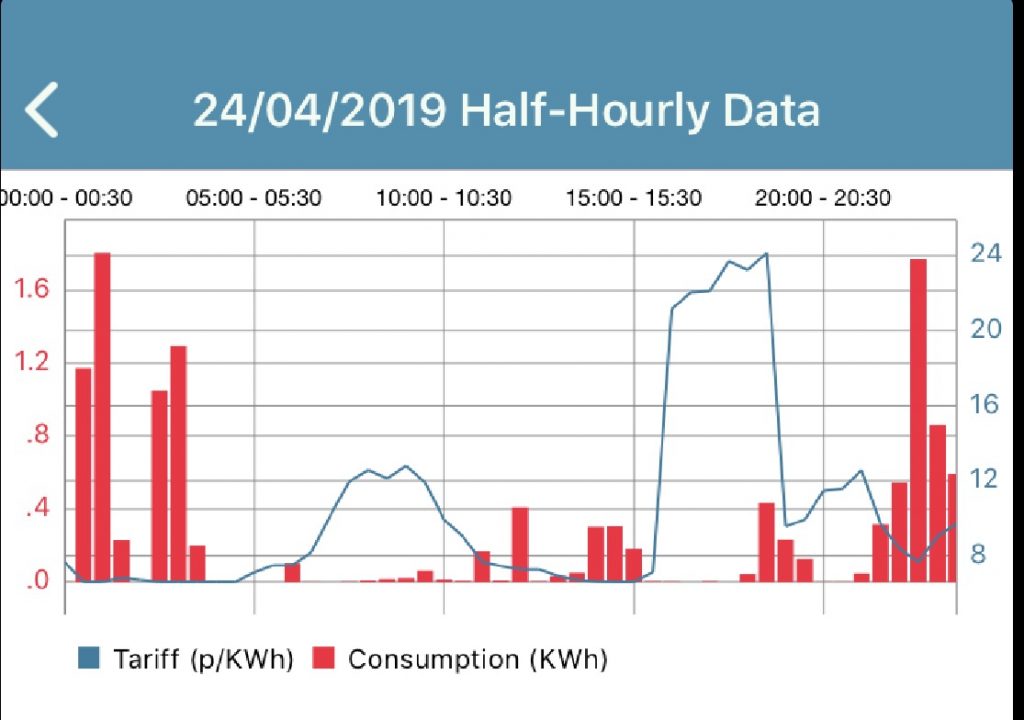
  • The current price per kWh is taken from Octopus’s price API, while the current cost per hour is derived both from this and the grid power from the immersun.
  • The needle grows from a simple dot indicating the price per kWh only when no power is drawn from the grid to a full needle when the electricity cost is 10 pence per hour or more.

The lower power part is effectively a power meter ranging from 5,000 Watts of export to the left to 5,000 Watts of import to the right. It updates every few seconds. It has various features:

  • The outer semi-circular ring (orange /maroon / green here) shows how power is being consumed:
    • orange – shows consumption by the house less specified loads
    • maroon – shows battery charging
    • blue (not shown) – shows water heating
    • green – shows export to the grid
  • The inner semi-circular ring (yellow here) shows the source of power. The sum of the sources should equal the sum of the consumers. The sources are:
    • maroon (not shown) – shows battery discharge
    • yellow – shows solar power
    • red (not shown) – shows grid power
  • The power value shows the net import or export from / to the grid, while SoC refers to the state of charge of the battery (0-100%). The combination of import power and electricity price gives the cost per hour in the top gauge.
  • The needle position shows net import (to the right) or next export (to the left). The needle should thus be to the left of the green sector, or to the right of the (unseen) red sector. Needle length show the full power being handled and is thus proportionate to the angle of the sector including all the colours in the lower gauge and extends from 0 to 5 kW.
Monitor installed on an old phone in the kitchen.

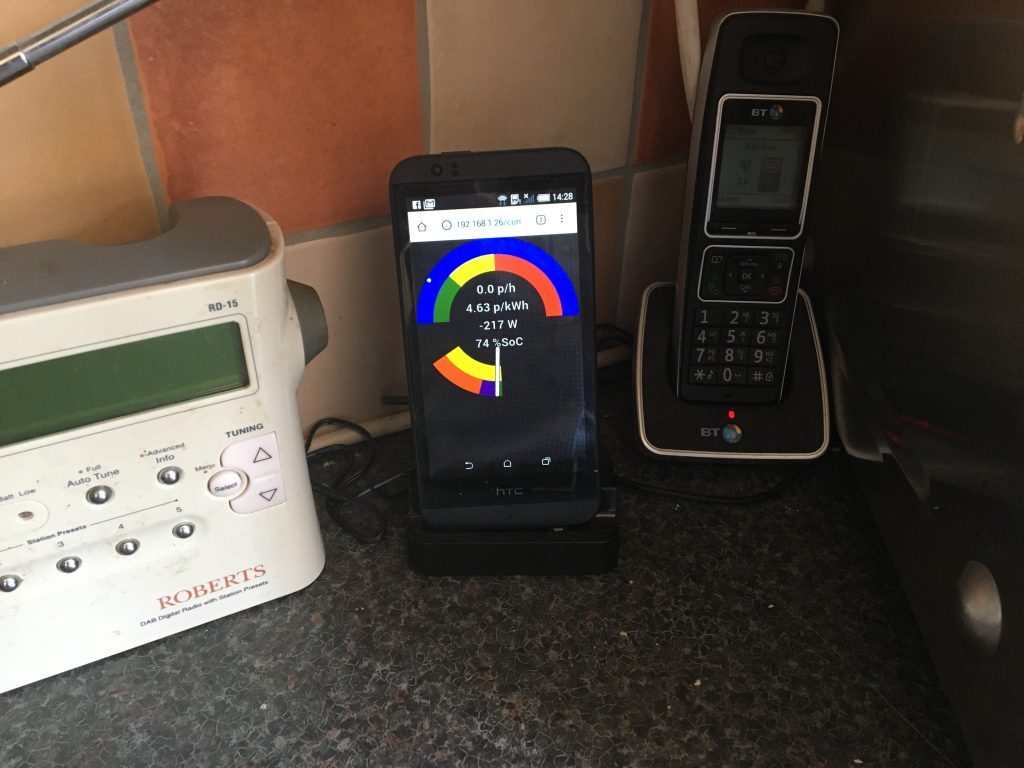
The gauge scales to fill the smallest of screen height or width and translates to be centrally positioned regardless of screen size. My intention is to display it on an old mobile phone as an energy monitor, but I can also access it on any web browser on any device within the home.

Tonic solar, a little light music

As winter turned to spring my thoughts for my HEMS turned to thinking about how to adjust the operation of the HEMS in managing battery charging to account for anticipated solar production. Previously the HEMS was configured to buy a preset number of hours of charge from the grid each day, typically overnight when the power tends to be cheapest. Through 2019 as the seasons changed I periodically adjusted this figure to create headroom to store charge from the solar panels later in the day. However I would like to make this adjustment automatically day by day.

Late last year I came across solcast a website that predicts the output of solar panels. The user creates an account, describes their PV array (location, capacity and orientation), and can then download predictions via API.

Solar prediction for the next three days

The orange line shows the predicted output for the next few days, with the light grey area showing the confidence interval from 10 to 90%. As a prediction there’s a degree of uncertainty associated with the prediction as there is with a weather forecast. The 10% line shows that 1 day in 10 the output will be lower than the grey area, while the 90% line shows that 1 day in 10 then output will be higher than the grey area.

My original prediction were based on the orange line (the 50th percentile) where output was equally likely to be above or below this amount. However my risk on an incorrect prediction is not even. If I fail to buy enough power from the grid when the price is low then I risk paying up to 35p/kWh to buy when the price is high, whereas if I buy an unnecessary cheap kWh from the grid I may spend an unnecessary 5p/kWh on average. Thus I decided to take a more conservative position on risk to obtain the lowest cost position. I opted for a 20% risk, so 1 day in 5 I might underestimate my purchase from the grid reflecting the ratio of grid prices high:low. I estimated this 20th percentile assuming a normal distribution on the low side where the 20th percentile = 0.34 * 50th percentile + 0.66 * 10th percentile.

The process is as follows:

  1. download the data in a half-hourly format to be comparable to the half-hourly Agile electricity price data,
  2. calculate the 20th percentile from the 10th and 50th percentiles,
  3. count the number of half-hours in the 20th percentile data above a threshold that provides for charging the battery at full power,
  4. establish the earliest half hour when solar would charge the battery at full power,
  5. adjust the period for buying power from the grid by the period anticipated for solar charging (tomorrow a total of 7 hours is to be achieved by 6.5 hours from solar leaving 0.5 hours from the grid),
  6. adjust the end time for buying power from the grid to align with the earliest hour when the battery can charge at full power from solar.
HEMS schedule with battery behaviour modified for predicted solar generation

The result of these calculations can be seen above. One half-hour of lowest price battery charging has been identified overnight to meet the requirement for charging from the grid. Normal HEMS behaviour has also identified several other periods of grid charging at lower cost during the day, but these are not counted towards the target for buying from the grid due to the potential for a double count of solar and grid charging during the day. (In a similar manner there are multiple start times during the afternoon when the dishwasher or washing machine can be run on grid power more cheaply than the optimal overnight start time.)

No explicit command from the HEMS is required to enable proportional charging of the battery from the solar panels when there is a solar surplus as 2 of the 3 used battery operating modes (normal and charge-only) have this capability, and the third mode force charges the battery. If the battery is force charged during solar surplus then the source of the energy will of course be the solar panels, but any shortfall will be met from the grid.

modecharge behaviourdischarge behaviourcomment
NormalProportional to solar surplusProportional to shortfallUsed at high grid prices (today discharging enabled at > 8 p/kWh)
Charge onlyProportional to solar surplusNo dischargeUsed at mid grid price to save stored energy for period of higher grid price (between 5 and 8 p/kWh today)
Force chargeFull powerNo dischargeUsed at lower grid price to buy from grid (today buying at < 5p/kWh). If low price occurs at time with reasonable solar generation then use of solar output will happen automatically, with only any shortfall coming from the grid.
Battery behaviour in different operating modes

Smart Export Guarantee – FiT for purpose?

Solar PV installations like mine that are a few years old generally qualify for the UK’s Feed-in Tariff (FiT) which pays both for generation and notionally for export, while newer installations are covered by the Smart Export Guarantee (SEG). The older FiT scheme was universal in the sense that all larger electricity companies had to participate and they all paid the same rates, while with the newer scheme there’s still an obligation for larger companies to participate but the rates are all different. Older installations like mine can optionally swap the export component of the FiT for the SEG, but is that an attractive option?

SEG Payments by provider

SEG payments differ widely between providers so it’s worth shopping around.

My FiT export payment is currently 5.38 p/kWh on a deemed export basis, which means that, rather than measure actual export, it is assumed that half of my generation is exported. My electricity supplier Octopus offerers one of the best SEG rates at 5.5 p/kWh but that’s on the actual export, not the deemed export.

Monitoring data March 2019 – February 2020
AlternativeDescriptionEnergy exportedRate paidTotalComment
Baseline FiT2,098 kWh (50% of 4,196.1 kWh) 5.38 p/kWh£112.87
Scenario #1 Switch to SEG without other changes 647.1 kWh5.50 p/kWh£35.5968% reduction
Scenario #2Add disable water heating from solar to above.1,722.4 kWh (1,075.3 + 647.1 kWh)5.50 p/kWh£94.75
Provide equivalent water heating from gas1,075.3 kWh 3.2 p/kWh / 90% (£38.23)
Total£56.5250% reduction

Octopus Energy does also offer the alternative of a variable export rate based on wholesale prices, akin to their Octopus Agile import tariff, but for export. However it’s my belief that I would need a much larger battery than I have now (4 kWh) in order to benefit from this as it will always be generally better value to use that stored energy to avoid the early evening peak price period (up to 35 p/kWh) than to sell it back to the grid at a lower price and then need to buy more energy myself. If I had a bigger battery (both in terms of energy and power) then I could both meet my own needs and sell back to the grid.

Overall however I think that it’s clear that, with my current relatively small battery and deemed export tariff, I’m better off on the older FiT scheme than the newer SEG scheme even with one of the better-paying SEG providers.

Saving on electricity

I’ve been seeing a few online advertisements recently touting 70% savings on electricity through a combination of solar panels and battery storage. I’ve also been looking for a way to express my savings through my smart tariff so this seemed like a opportunity to try that.

My start point is a years data from my monitoring system..

Monitoring data for March 2019 to February 2020

I also went through a year of electricity bills (with slightly different start and end dates) concluding that my average purchased electricity cost was 7.08 p/kWh. Thus my average electricity costs (including solar) are on the right of the table below:

sourcequantityest unit priceEst totalmy uniT pricemY totalmy saving v. Est
Bought4,309 kWh15.75 p/kWh£678.677.08 p/kWh£305.08£373.59
Generated2,473 kWh15.75 pkWh£389.500.00 p/kWh£0.00£389.50
Total / Average6,783 kWh15.75 p/kWh£1,068.324.5 p/kWh£305.23£763.09
Comparison between my electricity cost and the UK average

If I look at the Energy Saving Trust’s assumptions as a baseline, they have the average UK cost of electricity as 15.75 p/kWh. If I’m paying an average 4.5 p/kWh for each kWh used with my combination of solar PV, storage battery and smart tariff then I’m paying 28.6% of the cost of someone who used the same amount of electricity bought at the average UK rate or saving 71.4% of electricity cost. To put it another way, I’m paying £305.23 for electricity that would have cost the average UK consumer £1,068.32 (on the left of the table above) – a saving of £763.09.

(The baseline assumption that someone would have used the same amount of electricity as me without my level of technology is a slight over-estimate as I flex water heating between gas and electricity since my bought electricity price is sometimes lower than my bought gas price causing me to substitute electricity for gas. Someone on a conventional electricity tariff and gas would never make that substitution as their gas would always be cheaper than their electricity, hence my electricity consumption is a little higher than someone who would be on a conventional electricity tariff.)

I’m also generating feed-in tariff due to the age of my system (approximately 4.5 years old) which would be £714.59 per annum at current rates, and making 1,075 kWh of hot water from surplus solar electricity which saves £38.22 in gas (the diverted / hot water saving in the screenshot above is based on a notional electricity price, not a gas price). Unless I’ve missed something that’s an annual return of £1,515.90 (£763.09 + £714.59 + £38.22).

In my previous post I estimated my investment at £8,670 so with an combined annual savings and revenue of £1,515.90 that’s a 17.5% return or a payback of 5.7 years. Previously I’d estimated 9 years including the battery, but this was without the benefit of the smart tariff. As we’ve now had the solar PV for 4.5 years that’s very promising, although as my return seems to be accelerating it will take more than 4.5 past years + 1.2 future years (total 5.7 years) to achieve payback.

The current 5.7 years to payback would have achieved payback in spring 2021 as the near bookend, while the prior 9 years would have been autumn 2024 as the far bookend. In practice I could not have achieved the lower bookend of 5.7 years, even had I invested in all the supporting technologies simultaneously, because I’m combining the legacy Feed-in Tariff (FiT) scheme for my solar PV with the Octopus Agile dynamic smart electricity tariff which started in February 2018,

The cost of smart

Discussion elsewhere prompted me to look into what I spent on what you might term my energy smart systems relating to electricity consumption, so I thought I’d document it here.

ItemDescription CostComment
1Solar photovoltaic system (4kW)£5,500Bundled with ImmerSUN.
2Powervault battery storage (4kWh)£2,000Free installation as part of UKPN trial.
3ImmerSUN management system with monitoring.£600Estimate based on today’s pricing.
4Remote-controlled car charger.£300Modified used charger from eBay. My own software.
5Raspberry Pi items to make HEMS£200My own software.
6Wet goods automation (WIFIPLUG x 2)£70
TOTAL£8,670

Prior analysis of items #1-#4 in pre-Agile days has suggested a total of 9 years to achieve payback on this investment through use of around 85% of the generated energy. Solar panels are potentially good for over 20 years operation, although I doubt the lead-acid batteries will still be operating for anything like that long.

The combination of item #5 with my Octopus Agile dynamic smart electricity tariff has resulted in my average bought electricity price being 7.75 p/kWh in 2019, about half the UK average. I suppose that I could make the same judgements and program items manually each day, but the HEMS significantly reduces my time commitment to achieve that.

Item #6 is my most recent addition. The sophistication of the algorithm combining the Agile tariff with a simple model of the cycle of each device is such that I would never achieve such a high quality result manually. However the saving is perhaps only a three pence each day so maybe £10 per year on my Agile tariff and thus 7 years to pay for the two smart plugs.

Much of this content is thus around 7 years to payback. The HEMS is potentially much quicker, but relies on having smart systems to control such as battery storage and car charger.

The ‘Appiest Days of My Life

One of the consequences of integrating a smart home is the large number of different apps, web portals and potentially sources of APIs involved. The ones I use include:

TitleAppPortalAPIPurposeComment
BrightYNYReads and stores consumption from smart meter.No price data for my tariff due to smart meter limitations.
EveY /3NNEve’s alternative to Home for all HomeKit accessories with additional functionality for Eve’s own devices.I prefer this to Home for editing rules.
I use Eve products mostly for central heating control.
HomeY /3NNApple’s own app for the HomeKit smart home ecosystem.Need to refer to device manufacturers own apps (such as Eve or WIFIPLUG) for some configuration and data.
HEMSNYN My own web portal to view HEMS schedule and status via Apache web-server on Raspberry Pi.
MyImmersunYYY /1Control of ImmerSUN power diverter.Available API provides some measurement and status data as per main screen of the app.
PowervaultNYY /2Control of Powervault storage system.Available APIs provide some user scheduling and status capability.
OctoWatchdogY /3YYFuture cost, and historic costs and consumption (30 prior days) from Octopus (electricity supplier).APIs provided by Octopus.
App developed by an enthusiast using Octopus APIs.
Octopus’s own web portal provides historic consumption but does not pair this with cost. Monthly statements show graph of consumption and cost for each day.
WIFIPLUGYNYControl and measurements from own brand smart plugs.Plugs also appear in Home and Eve apps.
I use for dishwasher and washing machine.

Notes to table:

  1. APIs not officially released. Reverse-engineered by an enthusiast and available on line.
  2. APIs not officially released. Used as part of a sponsored trial when I first got the battery and re-used by myself with some manufacturer support.
  3. iOS only. Not available for Android.

Some of these apps have similarities:

  • Both Bright and OctoWatchdog show whole of house energy consumption (and potentially cost) derived from the smart meter. However they have differences too. A smart meter sits on two networks: (i) the Wide Area Network (WAN) via which the meter communicates with the energy supplier and (ii) the Home Area Network (HAN) which links the devices in the home (electricity meter, gas meter, CADs/IHD and gateway). Bright connects to the HAN via small piece of hardware called a Glow Stick Wi-Fi CAD and collects its own data in real time and stores its own records of energy consumption in the cloud; while OctoWatchdog involves no extra in-home hardware, and takes data a day in arrears from Octopus not storing anything in the cloud itself. Bright’s USP is the real time consumption and current day’s data (neither of which OctoWatchdog supports), while OctoWatchdog’s USP is the availability of electricity price which isn’t available from the meter.
  • Both Eve and Home interact with all devices in the whole HomeKit ecosystem. Eve is best for creating rules and has more ability to configure Eve’s own devices, while Home is best for sharing access with family members. WIFIPLUG’s app is more limited only interacting with their own devices, and thus cannot see Eve or other HomeKit devices.
  • Both MyImmersun and WIFIPLUG apps, and the Powervault portal, allow configuration of their own manufacturer devices. They all have, for example, timer capability and data logging. MyImmersun is better for giving a whole-of-home view showing solar panel output and net input to house (so provides a more comprehensive energy monitor), Powervault shows no solar panel output but does give a view of whole-of-home, while WIFIPLUG provides only a view of the energy consumption of devices plugged in to the WIFIPLUGs.

HEMS in action

Yesterday provided a good example of my HEMS in action as the electricity price dropped quite low due to stormy weather conditions. Normally at this time of year the HEMS isn’t doing much with the storage battery as daytime solar output is enough to fully charge the battery, but yesterday low pricing was enough to automatically enable both battery charging and water heating overnight. Car charging was due to run anyway driven by the demand for an hour of charging, but battery charging and water heating was triggered by the low price rather than a needed to take power for a pre-defined period of time.

HEMS schedule 9th August

The screenshot above from my phone shows the HEMS’ plan for the the early hours of the 9th. The first price column shows one hour of car charging at the cheapest price. The second column shows half an hour of water heating as the electricity price has fallen below 3.5 p/kWh when it is assumed to be cheaper than gas. The third column shows four hours of battery charging when the electricity price is below 5 p/kWh.

Metered electricity consumption (HAN side) 9th August

The above image from the HAN side of my smart meter shows the energy consumption of the house varying through the night in response to these requests from the HEMS – battery charging at the widest point, car charging above that for an hour, and water heating above that for 30 minutes.

Half-hourly metered consumption (WAN side) and electricity price for 9th August

Finally this image shows the energy consumption versus price data for the same period shows how the action of the HEMS increases electricity demand as the price drops. Indeed on this day there was virtually no consumption at any other time.

For August 9th as a whole I paid 52 pence for 7.547 kWh of electricity. Taking off the 21 pence for the standing charge leaves 31 pence for the electricity kWhs alone, an average of 4.11 p/kWh.

The Big Picture

After a series of quite detailed posts, I think that the time has come for an updated high level overview of what we have.

Heat loss from the home

We moved to our early 1970s house almost 4 years ago bringing with us our electric vehicle. The house had already been refurbished with new double-glazed windows, had cavity insulation (although that wasn’t recorded on EPC so must have predated the prior owners), and a token level of loft insulation. The existing gas boiler was arthritic, couldn’t heat the whole house, but was quite good at heating the header tanks in the loft! We had gravity-fed gas hot water (i.e. no thermostat or pump on the cylinder) which was completely obsolete, the cylinder dated back to the building of the house and had no immersion heater (although we had the wiring for one). So what did we do?

Space heating:

Eve Thermo eTRV
  • We substantially increased the loft insulation to reduce heat loss.
  • We had a modern condensing gas boiler installed to improve efficiency.
  • We updated to smart controls using eTRVs to set both temperature set points and schedules at room level. I built a smart interface to the boiler so that heating can be enabled remotely. I programmed a series of rules into Apple Home allowing the smart thermostats to enable the boiler when any thermostat wants heat and disable it when no thermostat wants heat. Some rooms also have additional rules linking heating to open windows or movement sensors. All of this reduces heat losses by only heating rooms that are (or will be shortly be) in use.

Electricity supply:

Solar panels
  • We installed our own solar panels given 4 kWp generation. (I also own a small share of a solar farm although there’s no contract that I’m aware of between that farm and my home energy supplier)
  • I invested in an immerSUN to maximise self-use of our own solar by enabling loads when surplus solar is available.
  • We switched to a green electricity supplier so when we need to buy electricity it comes from renewable sources.
  • We bought a small storage battery 4 kWh to store some of our solar production for use later in the day. Subsequently I can also use it in winter to buy when the electricity price is relatively low to avoid buying when the price is relatively high.
  • We chose a dynamic smart tariff to buy electricity at the lowest price based on market prices established the day before. The prices change each half hour and are established in the late afternoon on the day before.

Water heating:

Hot water cylinder
  • We replaced the old hot water cylinder with a modern insulated one (to reduce heat loss) with a low immersion heater (to allow more of the water volume to be heated).
  • Our principal water heating is now by diverting surplus solar electricity proportionately to the immersion heater, that’s backed up by the gas boiler which is enabled briefly in the evening for water heating in case the water isn’t yet up to temperature, and when the electricity price falls below the gas price I can enable the immersion heater on full power.
  • All accessible hot water pipes are insulated.

Electric car charger:

Electric car charger.
  • I built my own electric car charger that takes an external radio signal to switch between four settings 0, 6, 10 and 16 Amps to help me adjust consumption to match to availability of output from my solar panels. (Subsequently such products were developed commercially with continuously variable current limits, but the limitations of my immersun and on/off radio signal don’t allow me to go quite that far. Having said that my car only does 0, 6, 10 and 14 Amps so I would gain no benefit from a continuously-variable charger paired with a 4-level car).

Smart electricity controls:

Smart controls
top: HEMS (to manage bought electricity) and junction box
mid: radio transmitter (to car charger)
bottom: immersun (to manage self-consumption)
  • We have two systems for smart control of electricity:
    1. The immersun to maximise self-use of our solar electricity by proportional control of loads.
    2. A HEMS to manage the purchase of electricity (when necessary) at the lowest price by maximising consumption when the price is lowest.
  • When both systems want to enable loads (because the bought price is low and we have a surplus from our own panels) then cost is prioritised, so we’ll buy from the grid any demand not being met from our own panels.
  • Both systems are linked to 3 devices:
    1. Battery storage. The immersun is configured to work alongside the battery storage with the battery storage as the top priority to receive surplus solar PV. The HEMS can switch the status of the battery as required to charge from the grid when the price is lowest, or to discharge when the price is highest, or indeed to revert to default behaviour.
    2. Car charger. Second priority for the immersun after battery storage.
    3. Immersion heater. Third priority for the immersun after car charging.

The future

I have no firm plans for the future. I’m toying with adding to the HEMS various features including:

  • Making the display switch between GMS and BST as appropriate (it’s all UTC at the moment).
  • Edit configuration via the web interface rather than a virtual terminal.
  • Control a domestic appliance. Our washing machine was replaced relatively recently, but the dishwasher is playing up a little and may be a candidate for HEMS integration where the optimum start time is selected to deliver lowest energy price.

Different perspectives

The above images show four different perspectives on the same day of data (April 24th) from different sources within the home.

Smart Meter HAN

Firstly, the Smart Meter HAN image shows bought electricity to the home. Each smart meter sits on a Home Area Network (HAN) which is how the In-home display provided with the meter gets its data. The in-home display is an example of a Consumer Access Device (CAD). In my case I also have a Hildebrand Glow Stick as a CAD. The Glow Stick, which looks something like an oversized USB stick, also connects as a CAD to the smart meter allowing the meter to be read. An associated app, Hildebrand’s Bright, allows the Glow Stick to be read via the cloud. In principle the Bright app can display either energy in kWh or cost, but in my case can only display energy in kWh as Octopus don’t push the price data into the smart meter so energy cost always reports as zero. The data is presented by the minute.

Smart Meter WAN

Secondly, the Smart Meter WAN image shows the same data but from the perspective of the Wide Area Network (WAN) whch connects the smart meter to the energy retailer (Octopus for me). This half-hourly data is reported via the Octo Watchdog app. The data reported is cost per kWh (the blue line) and energy consumer / kWh (the red columns). The energy data in the red columns follows that of the red line in the prior illustration but in lower resolution (half-hourly versus minute-by-minute). You can clearly see most energy being bought when the price is lowest.

Powervault

Thirdly, the Powervault image shows grid in/out and battery in/out. The green grid-in line mimics the red data from the above images. The battery in/out data is solely visible in this image. The resolution is good enough to see shorter events like kettle boil cycles.

Immersun

The final image, from the Immerun, is probably the most useful although it lacks energy price and hides battery in/out within the House data (hence ‘House’ being zero at times). The immersun alone reports output data from the solar panels and diversion to the immersion heater. It also lumps the car charger energy within ‘House’, indeed none of these views can directly report the car charger behaviour although its the dominant energy consumer here.

I’m planning to construct my own view showing all the different prices of data together in one place. I already have access to:

  1. The Immersun data via the same API called by their app. I came across a blog post that described how to do this.
  2. The Powervault data API (I only have a control API at the moment) which should give me battery in/out (at least I’m on a promise of the API at the moment).
  3. The Hilbebrand data which duplicates the Powervault Import/Export at the moment, but has the potential to provide independent monitoring of my car charger.

In principle then that would leave me able to report 3 x energy sources (grid, panels and battery; of which grid and battery would be bi-directional) and report 3 x energy consumers (car, water heating and home).

Export metering and battery storage

A recent discussion centred on whether, as someone in receipt of UK feed-in tariff (FiT) and having a smart meter, I should be on metered export or deemed export. I had previously been advised that my smart meter did not have an export register, but playing with the buttons revealed an active export register.

The illustration above taken from OFGEM’s Guidance for generators: Co-location of electricity storage facilities with renewable generation supported under the Renewables Obligation or Feed-in Tariff schemes (Version 2) shows a configuration like mine, but rules out metered export since I can charge my battery from the grid and then export that power back to the grid. FiT terms are that only generated renewable power can be exported for FiT payment and thus, regardless of the capability of my meter, I’m only permitted to deem export. Deemed export does not incentivise purchase of power from the grid and then export.

There could be an opportunity to use the export meter as part of an export tariff instead of the FiT export component, which wouldn’t have a restriction on buying and exporting grid power, but my high levels of self-use make this unattractive compared to deemed export at 50% of generation.