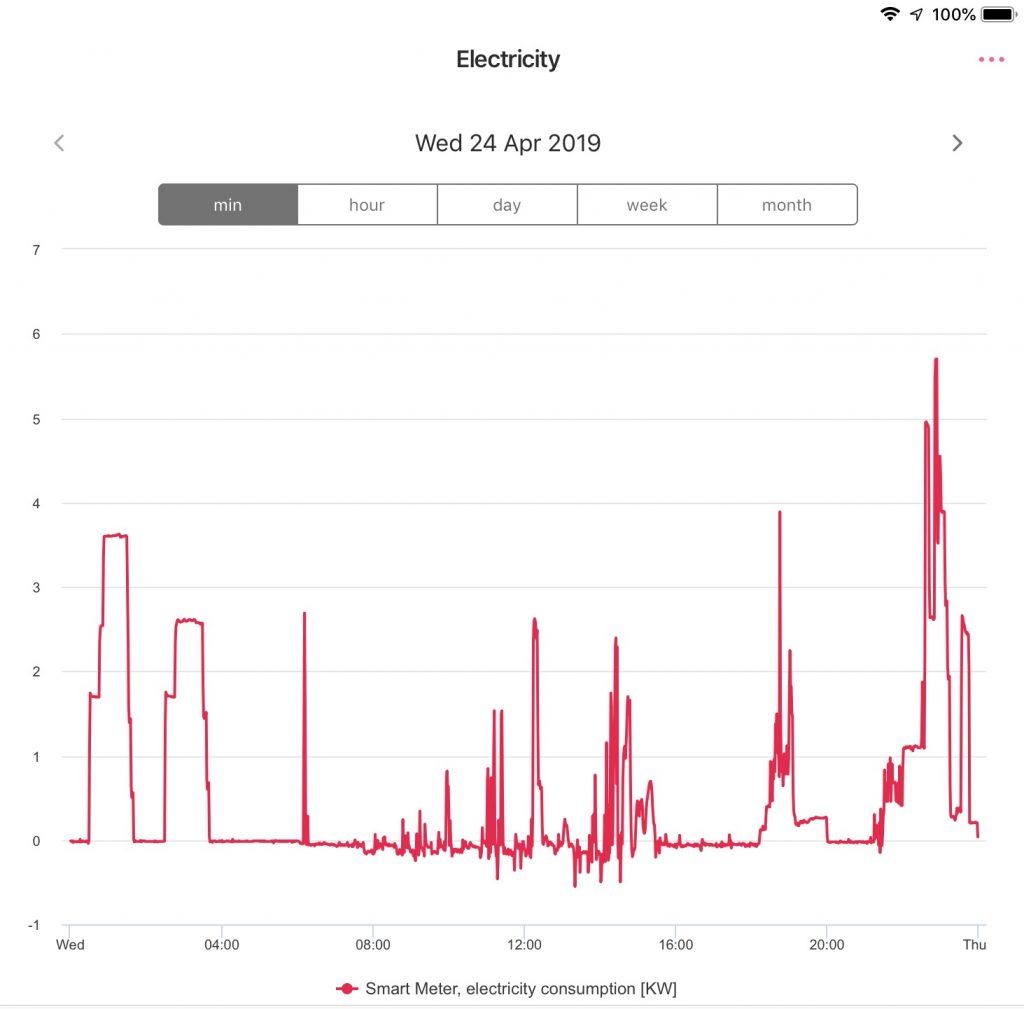
Smart Meter HAN 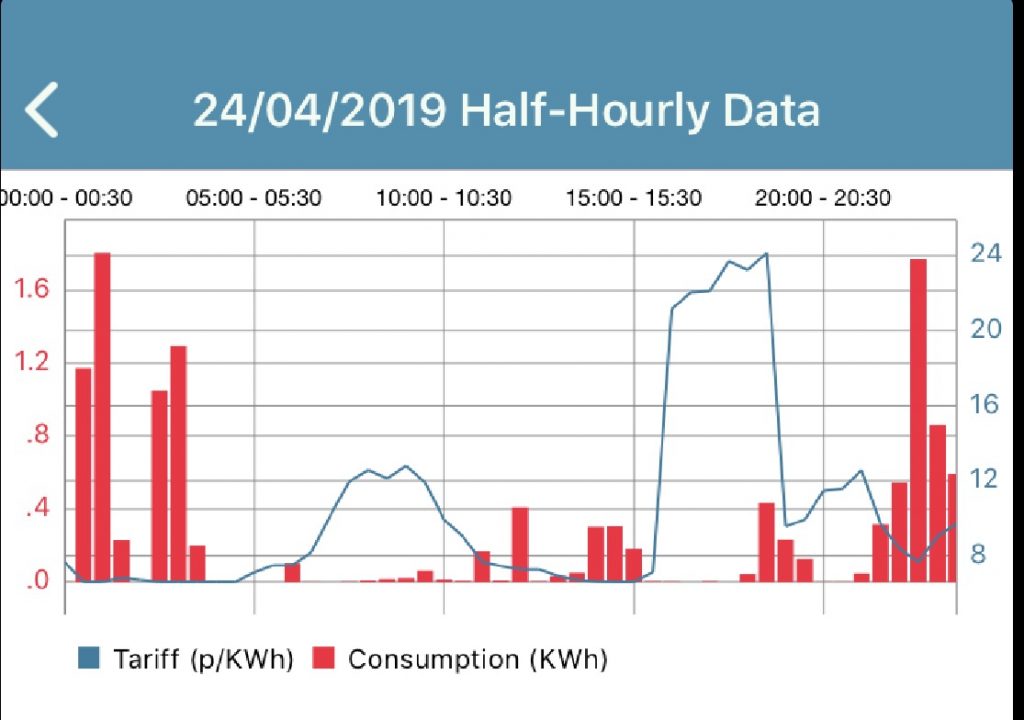
Smart Meter WAN 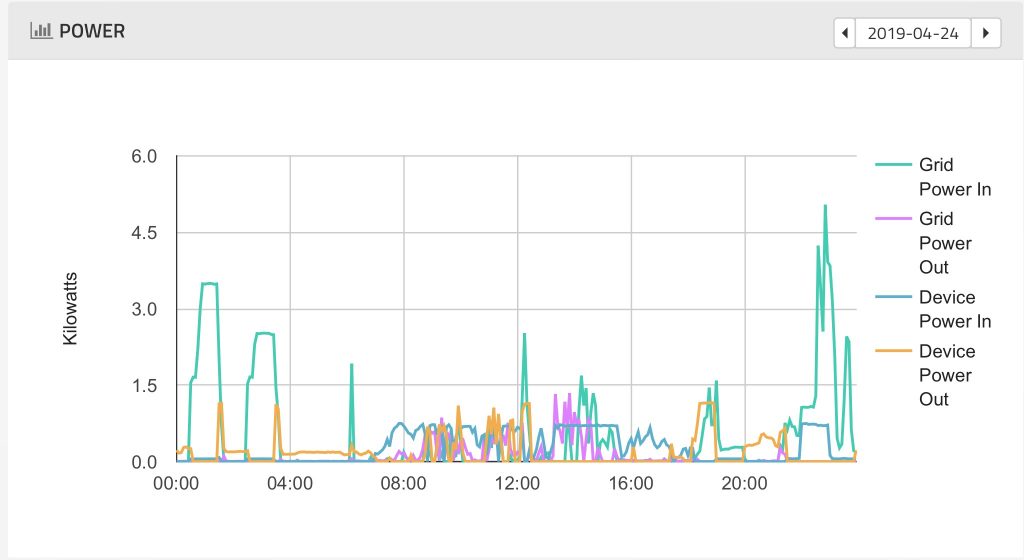
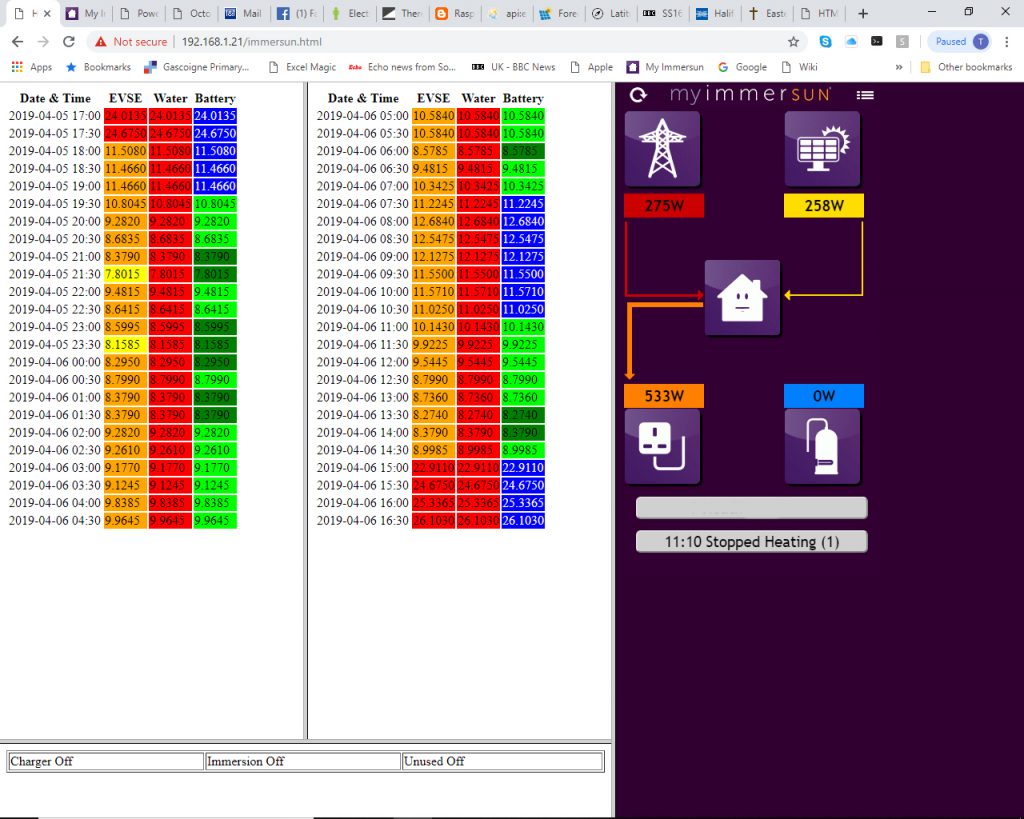
Powervault 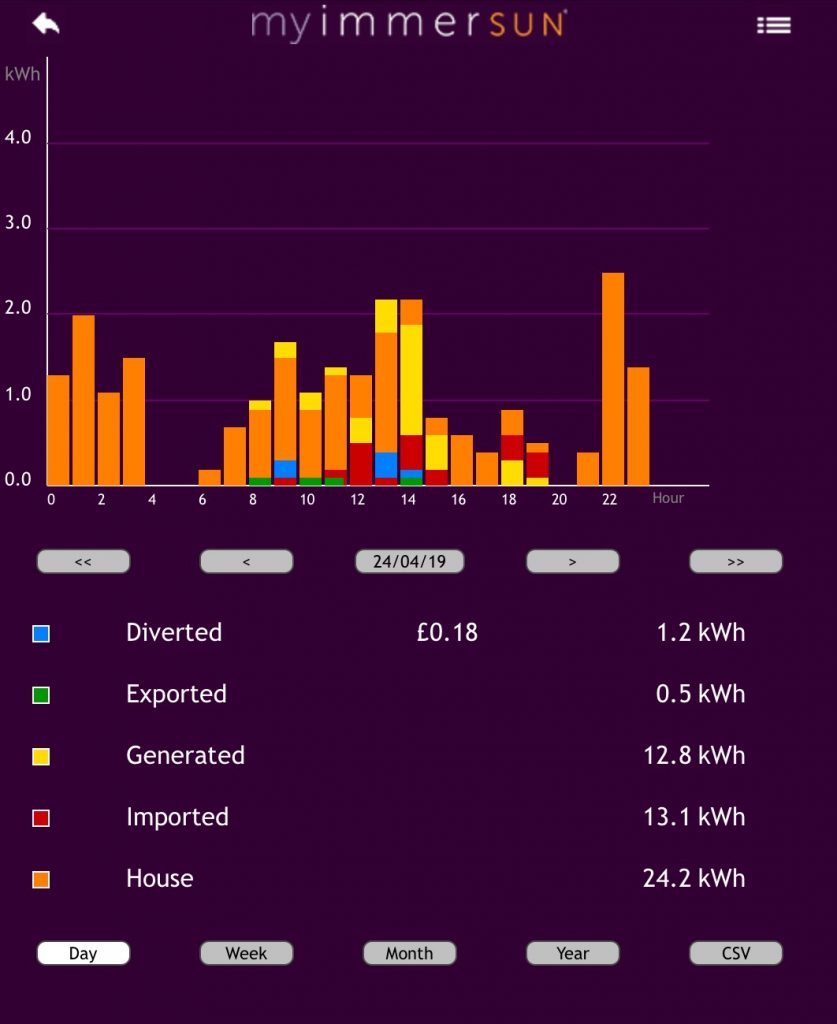
Immersun
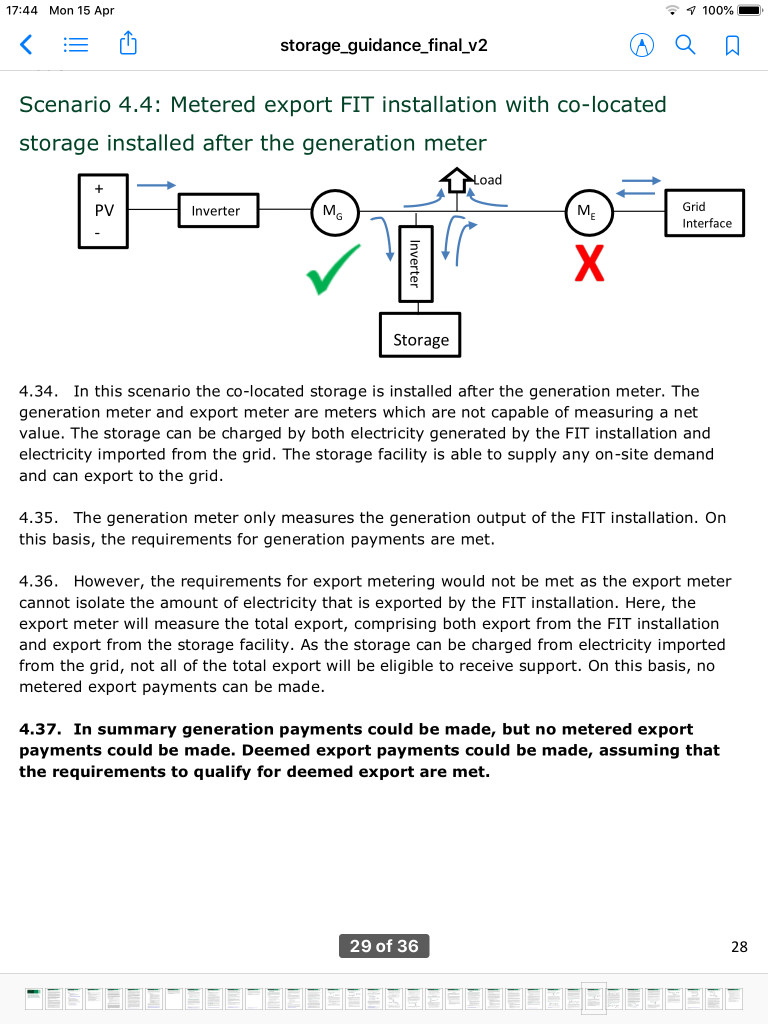
The above images show four different perspectives on the same day of data (April 24th) from different sources within the home.
Firstly, the Smart Meter HAN image shows bought electricity to the home. Each smart meter sits on a Home Area Network (HAN) which is how the In-home display provided with the meter gets its data. The in-home display is an example of a Consumer Access Device (CAD). In my case I also have a Hildebrand Glow Stick as a CAD. The Glow Stick, which looks something like an oversized USB stick, also connects as a CAD to the smart meter allowing the meter to be read. An associated app, Hildebrand’s Bright, allows the Glow Stick to be read via the cloud. In principle the Bright app can display either energy in kWh or cost, but in my case can only display energy in kWh as Octopus don’t push the price data into the smart meter so energy cost always reports as zero. The data is presented by the minute.
Secondly, the Smart Meter WAN image shows the same data but from the perspective of the Wide Area Network (WAN) whch connects the smart meter to the energy retailer (Octopus for me). This half-hourly data is reported via the Octo Watchdog app. The data reported is cost per kWh (the blue line) and energy consumer / kWh (the red columns). The energy data in the red columns follows that of the red line in the prior illustration but in lower resolution (half-hourly versus minute-by-minute). You can clearly see most energy being bought when the price is lowest.
Thirdly, the Powervault image shows grid in/out and battery in/out. The green grid-in line mimics the red data from the above images. The battery in/out data is solely visible in this image. The resolution is good enough to see shorter events like kettle boil cycles.
The final image, from the Immerun, is probably the most useful although it lacks energy price and hides battery in/out within the House data (hence ‘House’ being zero at times). The immersun alone reports output data from the solar panels and diversion to the immersion heater. It also lumps the car charger energy within ‘House’, indeed none of these views can directly report the car charger behaviour although its the dominant energy consumer here.
I’m planning to construct my own view showing all the different prices of data together in one place. I already have access to:
- The Immersun data via the same API called by their app. I came across a blog post that described how to do this.
- The Powervault data API (I only have a control API at the moment) which should give me battery in/out (at least I’m on a promise of the API at the moment).
- The Hilbebrand data which duplicates the Powervault Import/Export at the moment, but has the potential to provide independent monitoring of my car charger.
In principle then that would leave me able to report 3 x energy sources (grid, panels and battery; of which grid and battery would be bi-directional) and report 3 x energy consumers (car, water heating and home).