
What contrasts 2018 has been so far for solar PV!
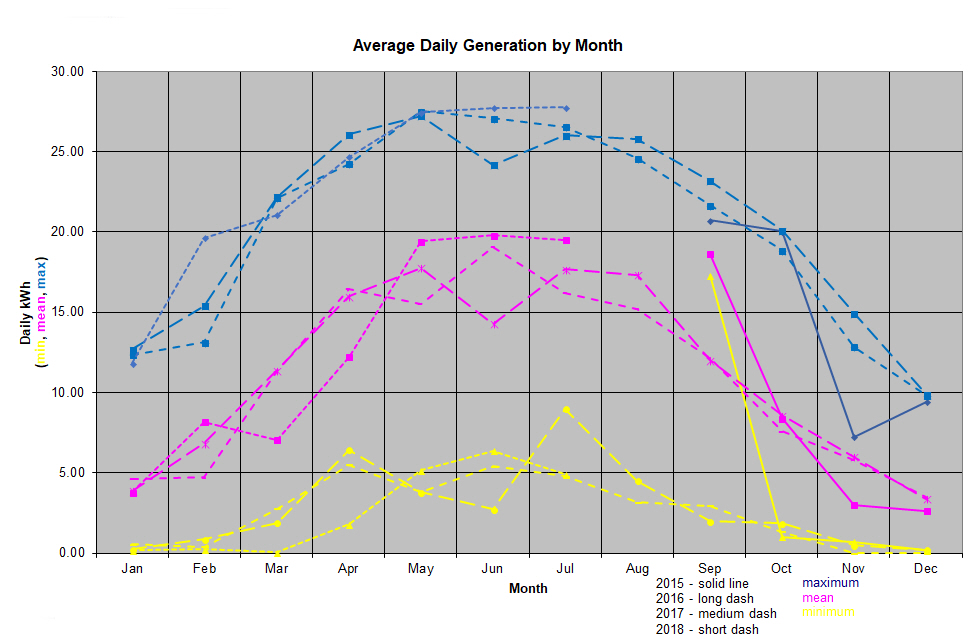
As ever, my graph shows the maximum, average, and minimum daily output for each calendar month of each year since the system was installed in late September 2015 (approaching 3 years ago). As can be seen from the middle group (the daily average) 2018 has produced a run of 3 months May to July with the best daily average outputs for their respective months since installation. February 2018 was also the best ever February; although January, April and May managed to be the worst examples of their respective months. Hence certainly a year of contrasts as every month is either the best or worst for its respective month since installation.
At the level of the best day in any calendar month (the blue line), May is remarkably stable with the best daily output for May for each of the last three years being almost identical, while new monthly records were set for February, June and July.
July 2018 was also a record-breaker for another reason – it was the first month in which our earnings from the feed-in tariff (which in the UK has both generation and export components) exceeded £100. That achievement is helped by the index-linking of the feed-in rates which rise every year, and by July having 31 days which gives a slight edge over June’s 30 days.
Pingback: Electricity Purchase to July 2018 | Greening Me